Attribute Group Variability
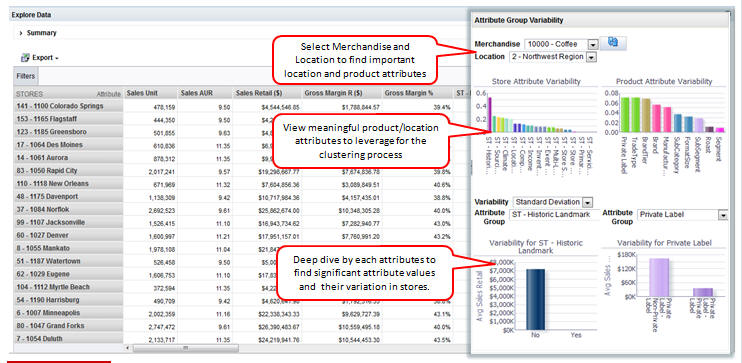
This is used to analyze the most significant attributes (product or location) for a specific merchandise in a selected location.
The attribute group variability section shows attribute graphs for location and product, indicating the key attributes that are driving sales performance.
The attribute variability section, for each attribute group, shows the sales variability for each attribute value in the selected stores. It calculates the index for the attribute group, indicating attribute significance.
