Data Filtering Histograms
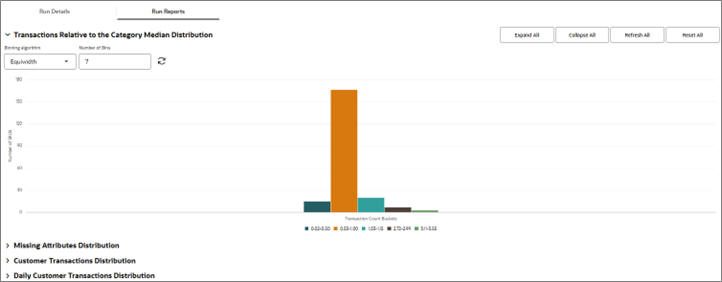
The following histograms illustrate the effects of filtering. You can use the information displayed in the histograms to adjust the configuration of the filters in order to eliminate outlier data. If you modify the filters, you must re-run the stage.
Table 2-11 Filter Histograms
| Histogram Name | Description |
|---|---|
|
Transactions Relative to the Category Median Distribution |
Displays the number of transactions relative to the category median for a SKU's category. |
|
Missing Attribute Distribution |
Displays the number of attributes that have missing values per number of SKUs. |
|
Customer Transaction Distribution |
Displays the number of transactions in historical data per number of customers. |
|
Daily Customer Transaction Distribution |
Displays the relative number of transactions per day per number of customers. |
Figure 2-17 CDT Transactions Relative Histogram

Description of "Figure 2-17 CDT Transactions Relative Histogram"
Once you are satisfied with the pruning results, click Next to go to the Calculation stage.