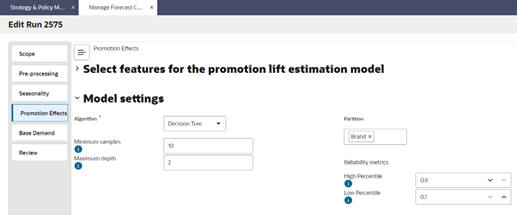
Forecast Configuration — Promotion Model Settings
Algorithm: Available options are Decision Tree and Generalized Linear Models (GLM).
Minimum samples: Minimum number of data points for each leaf node of the decision tree. This is used to ensure there are enough data points for each node.
Maximum depth: Number of levels between the leaf node and the top of the decision tree. Start with a value between 4 and 6, depending on the number of features being used and increase the number gradually to see if the model performance improves.
Partition: The model can be partitioned, based on one or more of the features used for building the model. Selecting a partition builds a separate model for each value corresponding to the chosen partition. Multiple features can be selected to determine a partition. Partitioning by higher levels in the product hierarchy and the location hierarchy or based on relevant product/location attributes can help to determine the promotions lifts more accurately. Lower levels of product/location hierarchy may not have sufficient data to create reliable parameters.
Reliability metrics:
High percentile: A value of 0.9 removes the top 10 percent of the observed lift values for building the model. Adjust the setting to remove outlier values with very high lift.
Low percentile: A value of 0.1 remove the bottom 10 percent of the observed lift values for building the model. Adjust the setting to remove outlier values with very low lift.
Figure 11-32 Model Settings for Promotion Effects
- PMO_LLC_PL_MODEL table: Contains the details about the promotion model.
- RUN_HDR_ID: Estimation run id.
- CASE_TABLE, CASE_COLUMNS: Contains all the features available for the user to select.
- VIEW_NAME, VIEW_COLUMN_NAMES: Based on the user selection in the UI.
- Using IW, MODEL_NAME can be used to apply the model for a chosen time frame on the CASE_TABLE.
- Root Mean Squared Error (RMSE) and Mean Absolute Error (MAE): Error metrics for the promotion lift values.
- Average Error (AVG_ERROR), Median Error (MEDIAN_ERROR), and Weighted Error (ERROR_WGT): % Error metrics for the promotion lift values.
- ERROR_WGT: % Error weighted by sales units.
Figure 11-33 Promotion Effects Output Review in IW