Process
This guide contains a chapter for each of the modules with detailed instructions. In general, each module contains a set of tabs, including an overview tab and tabs to use the module functionality.
Customer Decision Tree
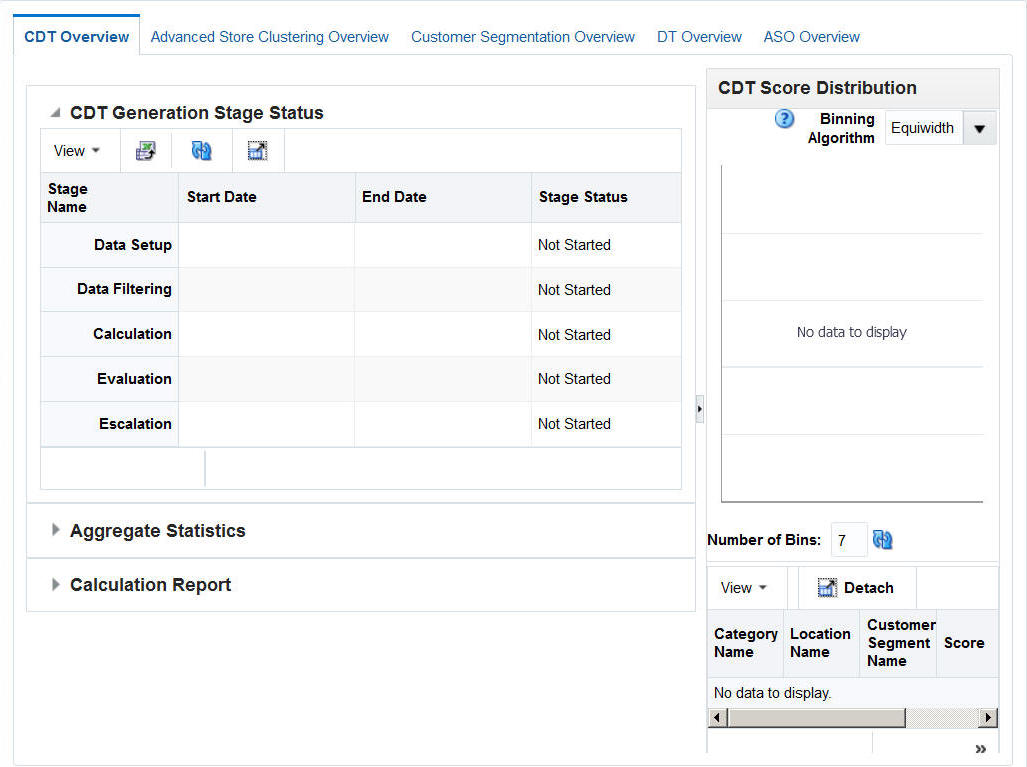
The Customer Decision Tree Overview tab is shown in following figure.
When you use the CDT Cloud Service module, you follow this general iterative process to create and manage CDTs:
-
Setup. You define the domain of calculation by selecting the categories and time frame for the calculation of the CDTs.
-
Data Filtering. You configure filters that remove input data that might cause errors in the calculation or that might lead to inaccurate or unreliable answers.
-
Calculation. You calculate a specific version of a CDT. Different versions of the CDT based on different configurations can be calculated and compared.
-
Evaluation. You examine the results of the calculation and determine the reliability and accuracy of the answers. You can prune inaccurate or unreliable results.
-
Escalation. When you are satisfied with the results, you can set the escalation path to fill in the holes for partitions whose CDTs were removed during pruning by setting up a search path through the segment hierarchy and the location hierarchy. Then, you can set a version of a CDT as complete.
Within each stage, you set the required parameters. In some stages, once you do that you click Run to initiate the process. To determine when a run is complete, go to the Overview tab and click the Refresh icon in order to see the current status of each stage. If you make changes to a stage, you must re-run that stage and all the relevant stages that follow it as the results of those stages are made invalid by the changes you made.
Demand Transference
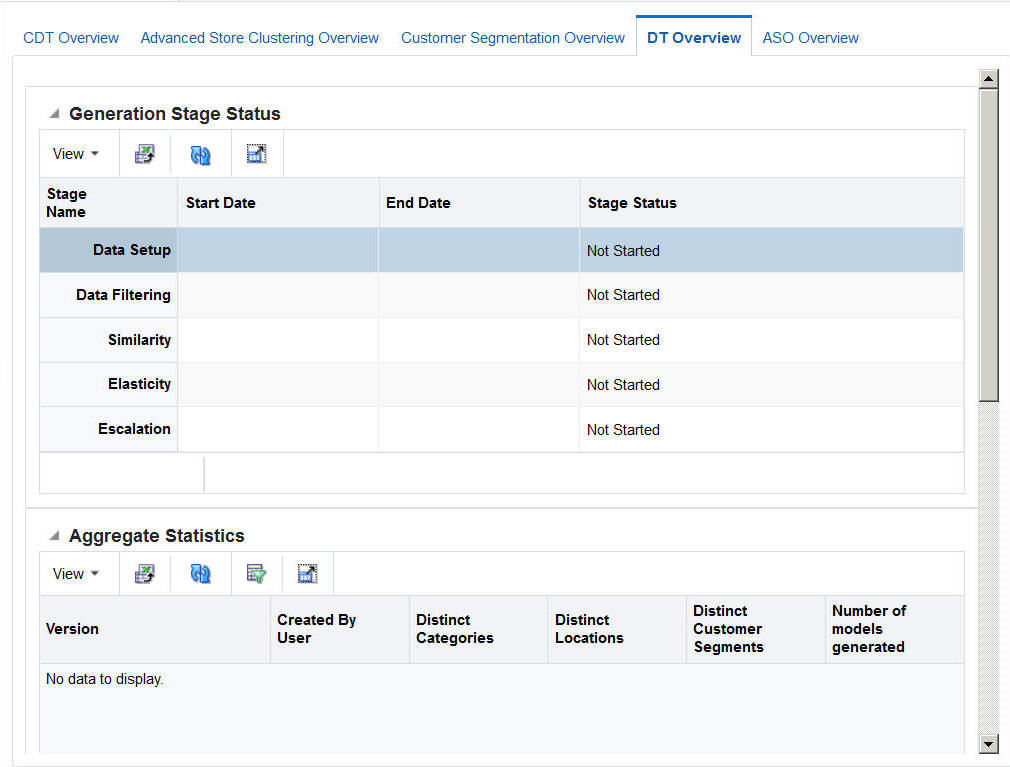
The Demand Transference Overview tab is shown in the following figure..
When you use the DT Cloud Service module, you follow this general iterative process to create and manage DT models:
-
Data Setup. You define the categories to be used in the DT calculation.
-
Data Filtering. You configure filters that remove input data that might cause errors in the calculation or that might lead to inaccurate or unreliable results.
-
Similarity Calculation. You calculate similarities and assess the results of the calculation.
-
Elasticity Calculation. You calculate the assortment elasticities and assess the results in terms of substitutable demand, which is the percentage of demand of a SKU that is retained when the SKU is deleted from the stores where it is selling.
-
Escalation. When you are satisfied with your results, you can set the escalation path to fill in the holes for partitions whose DT models were removed during pruning by setting up a search path through the segment hierarchy and the location hierarchy. Then you can set a version of the DT model as complete.
-
Manage Models. Use this tab to set time intervals for evaluating your results and to override the value for the maximum substitutable demand percentage.
Advanced Clustering
The Advanced Clustering Overview tab is shown in the following figure.
Figure 1-4 Advanced Clustering Overview Tab
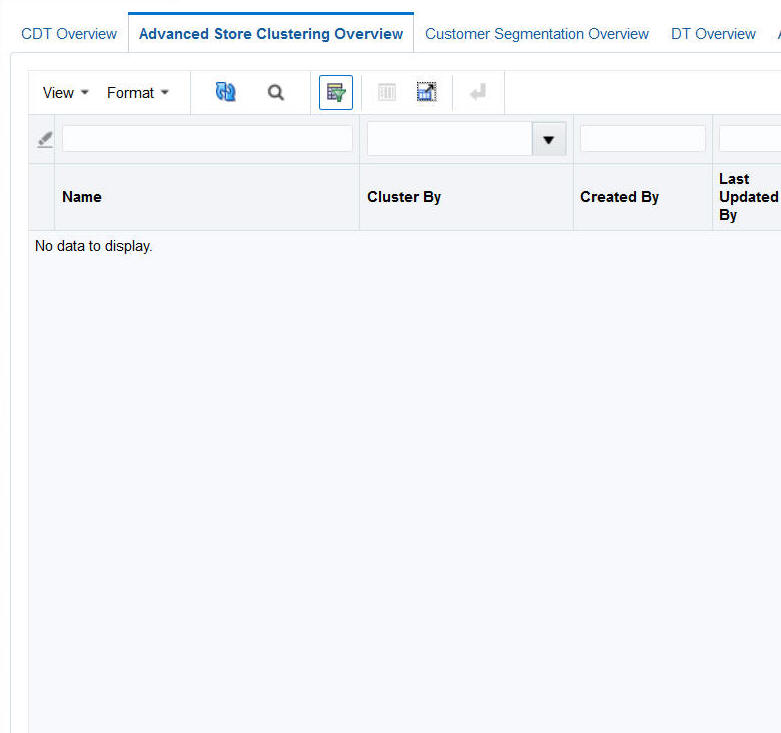
Description of "Figure 1-4 Advanced Clustering Overview Tab"
To use Advanced Clustering, follow this general process to create and manage clusters, working in the Generate Store Clusters tab and the Manage Store Clusters tab:
-
Cluster Criteria. View all available clusters for specified merchandise, location, and calendar. Review cluster criteria or scenario details for each cluster. Use an existing cluster as the basis for creating a new cluster.
-
Explore Data. Examine the input data for the cluster. Review multiple data points and significant attributes using the contextual information.
-
Cluster Setup. Define multiple what-if scenarios. Such scenarios can be compared with one another throughout the clustering process.
-
Cluster Results. View the scenario results and compare scenarios.
-
Cluster Insights. Gain an understanding about cluster results and cluster performance prior to approval by examining the contextual information.
-
Manage Store Clusters. Manage existing cluster criteria. Perform manual overrides and approve clusters.
Customer Segmentation
The Customer Segmentation Overview tab is shown in the following figure.
Figure 1-5 Customer Segmentation Overview Tab
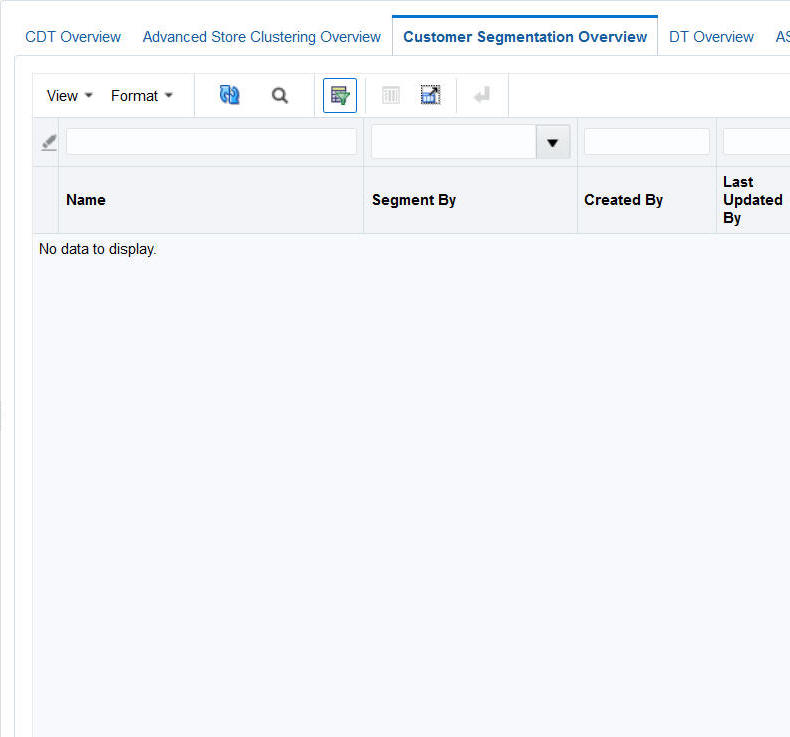
Description of "Figure 1-5 Customer Segmentation Overview Tab"
To use Customer Segmentation, follow this general process to create segments, working in the Generate Customer Segment tab:
-
Segment Criteria – View all available segments for the specified merchandise, location, and calendar. Review the segment criteria or scenario details for each segment. Use an existing segment as the basis for creating a new segment.
-
Explore Data – Examine attributes and their summaries for the segment. Review multiple significant attributes and their correlations using the contextual information.
-
Segment Setup – Define multiple what-if scenarios. Such scenarios can be compared with one another throughout the segmentation process.
-
Segment Results – View the scenario results and compare scenarios.
-
Segment Insights – Gain an understanding of segment results and segment performance prior to approval by examining the contextual information.
Assortment and Space Optimization
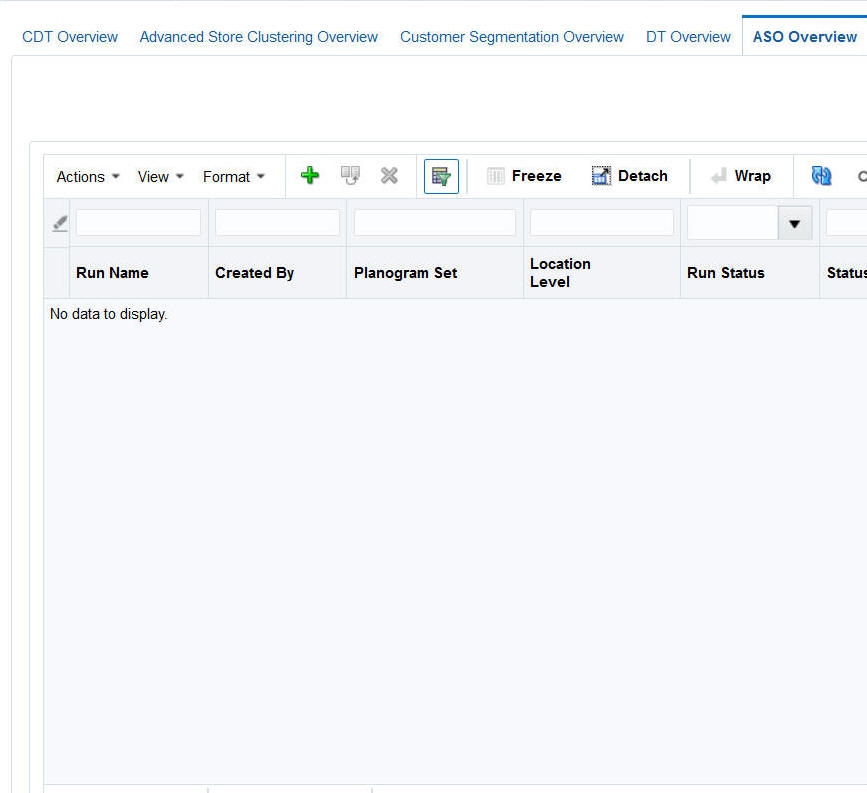
The Assortment and Space Optimization Overview tab is shown in the following figure.
ASO is used to optimize a category manager's assortment plan by creating optimal planograms. The category manager creates a preliminary assortment and wants to determine how well that list of products can fit in stores, given the available space, product sizes, and merchandising goals, constraints, and rules. The application creates virtual planograms that organize products onto fixtures in a way that best achieves the optimization objectives. Once the manager finalizes the optimization results, the product level data can be exported for use in planning applications.
