Forecast Review
You can access Forecast Review from the task list shown below.
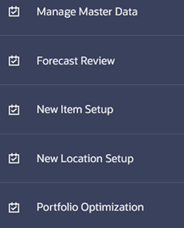
This section describes the workflow and screens available to review, adjust, and approve forecasts. It shows the forecast with its components, baseline, and promotional peaks. It also shows sales of last year, and cumulative interval information. The navigation of this worksheet is very conveniently driven by navigation exceptions.
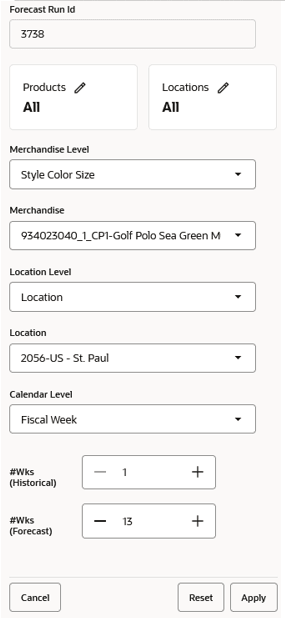
When entering the workspace, you can open the top filters panel.
The settings in the define the scope of the workspace.
For instance, you can select the products and locations that you want to review. Also, you select the number of historical and future weeks. Note that all the above selections can be made very easily. It is not necessary to select a huge scope, since working with smaller chunks of data is much more manageable from the workflow and performance perspectives.
Figure 12-26 Forecast Run Id
Once the scope of the workspace is determined, you move to the main screen and starts reviewing the forecasts. The information can be reviewed in grid format, as a chart or both. There is also the option to view the data in a pivot table.
Figure 12-27 Forecast Review Actions
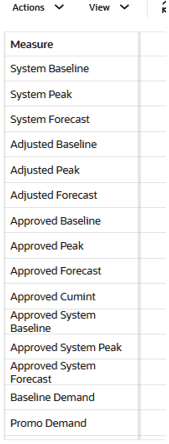
The metrics available in the screen are:
System Baseline
The System Baseline displays the system-generated baseline forecast. The values contained in this field are read only. The system baseline incorporates level, trend, seasonality, but no causal-related information.
System Peaks
The System Peaks displays the offer impacted demand generated by the engine. It is a read-only field, the together with the System Baseline equal the total demand.
System Forecast
This is a read-only measure that equals the system baseline plus the system peaks.
Adjusted Baseline
The value in this field initially defaults to the System Baseline if the forecast is automatically approved by the system or through a Forecast Approval Alert. Otherwise, the value in the Adjusted Baseline is different than the System Baseline if the metric has been updated by you.
Adjusted Peak
The value in this field initially defaults to the System Peak if the forecast is automatically approved by the system or through a Forecast Approval Alert. Otherwise, the value in the Adjusted Baseline is different than the System Baseline if the metric has been updated by you.
Adjusted Forecast
This is a read-only measure that equals the adjusted baseline plus the adjusted peaks.
Approved Baseline
The value in this field initially defaults to the Adjusted Baseline if the forecast is automatically approved by the system or through a Forecast Approval Alert. Otherwise, it displays the last approved baseline value.
Approved Peak
The value in this field initially defaults to the Adjusted Peak if the forecast is automatically approved by the system or through a Forecast Approval Alert. Otherwise, it displays the last approved peak value.
Approved Forecast
This read-only metric displays the approved forecast quantity. If changes are made to the Adjusted Forecast, the value in the Approved Forecast will reflect the adjustment.
Approved System Forecast
The Approved System Forecast is populated with the last System Forecast approved for a time series:
- Approval Method set to Automatic Approval
- Approval Method set to a Forecast Approval Alert and the alert is not triggered
Approved Cumint
Cumulative Intervals are used in safety stock calculation within allocation and replenishment systems. Its value is similar to a running total of a percentage of the actual forecast and is read only.
Baseline Demand
This read-only measure is the demand data used to generate the baseline forecast. This allows you to compare Actuals to forecast values. The metric is based on the historical sales which are undergoing several rounds corrections, including the removal of offer impacts on demand.
Promo Demand
This read-only measure is the demand data used to generate the forecast. This allows you to compare values. The metric is based on the historical sales which are undergoing several rounds corrections. The Promo Demand equals the Baseline Demand plus the promo driven demand.
Last Year Demand
This read-only measure equals the Baseline Demand shifted 52 weeks. This enables a convenient way to compare last years and future demand.
A screen that complements the review workflow is the Approval Information tab, that opens when you click Details.
Figure 12-28 Approval Information

The two views have synchronized product and location hierarchies.
Escalation Level
Displays the intersection at which the seasonality was calculated when generating forecast for this item/location combination.
Base Demand
Displays the base demand value used when generating forecast for this item/location combination.
Forecast Approval Method
This measure displays the approval method used.
Violated Exceptions
If the approval method is one of the alerts, this measure displays the approval alerts that were violated.
Approval Notes
In this box, the user can enter text. For instance, the user can write: Adjusted the promo demand up because of the upcoming supplier offer.
Ready for Approval
This control is very important for the approval process. It is disabled if the product/location is not approved. It is enabled if the product/location is approved. If a forecast was not approved and is manually adjusted, the control will be enabled. Finally, a user can manually enable the control. When the control has been enabled, the forecast is approved after clicking the Approve button in the main screen.
The workspace also has baseline and promo What-if capabilities.
The baseline What-if is performed in the other tab of the side cart:

The What-If Parameters view allows you to modify forecast parameters and immediately evaluate their impact in the Forecast Results grid.
Three forecast parameters are available for adjustment. As soon as a parameter is changed, the What-If flag is automatically selected, indicating that a What-If simulation can be run.
To generate a new forecast, click the What-If Baseline button. The simulated forecast is displayed in the What-If Baseline measure in the Forecast Results grid. You can run the Baseline What-If simulation as many times as necessary until you are satisfied with the results.
Note:
A Baseline What-If simulation recalculates the forecast across the entire forecast horizon.When you are satisfied with the simulated forecast, select Copy to Adjusted Baseline from the custom menu. This action copies the values from the What-If Baseline measure into the Adjusted Baseline measure.
If you want the adjusted forecast to become the official forecast, you must Approve the forecast. Approval copies the Adjusted Baseline values into the Approved Forecast measure.
The selected parameter values are retained and used the next time the forecast batch is run.
The adjustable parameters affect both:
- Base demand - the overall magnitude of the forecast.
- Seasonality - the shape and seasonal pattern of the forecast.
Baseline What-If can be performed at either the Item/Store level or an aggregate level.
The level at which the What-If simulation is performed is determined by the intersection currently displayed in the main Forecast Results grid. This intersection is controlled by the Top Filter settings.
The following are the measures in the What-If view
What-If: This Boolean measures specifies if the user can perform What-if. If it is unchecked, no What-if is triggered.
To perform What-if you need to select at least one of the following measures:
- What-If Seasonality Level
- What-If Base Demand Method
- What-If Base Demand History Length
If the What-if flag is on, you can run it by clicking What-if Baseline.
What-if Seasonality Level: This measure lets you specify a certain escalation level from which the seasonality curve will be used during What-if.
What-if Base Demand Method: This measure lets you override the forecast method for the base demand to be used during What-if.
The choices are all the methods available for base demand in the forecast setup task.
What-If Base Demand History Length: This measure lets you specify the number of weeks used to calculate the base demand during What-if.
What-if Seasonality Level Requested: This measure displays the requested seasonality level.
This can be different from the What-if Seasonality Level Picked, because the requested level
What-if Seasonality Level Picked: This measure displays the picked seasonality level.
This can be different from the What-if Seasonality Level Requested, because the requested level may be pruned. In this case escalation is performed to pick the next intersection
What-if Base Demand Method Requested: This measure displays the requested base demand method.
This can be different from the What-if Base Demand Method Picked.
For instance, if the requested method is Pick Best, the method picked will show the actual winner of the Auto Baseline competition.
What-if Base Demand Method Picked: This measure displays the picked base demand method.
This can be different from the What-if Base Demand Method Requested.
For instance, if the requested method is Pick Best, the method picked will show the actual winner of the Auto Baseline competition, like Holt.
What-if Base Demand History Length Requested: This measure displays the requested history length to calculate base demand
What-If Base Demand History Length Picked: This measure displays the actual number of weeks used to calculate the base demand
System Seasonality Level Picked: This measure displays the escalation level used in generating the system forecast.
System Base Demand Method Requested: This measure displays the requested base demand method to generate the system forecast.
This can be different from the System Base Demand Method Picked.
For instance, if the requested method is Pick Best, the method picked will show the actual winner of the Auto Baseline competition.
System Base Demand Method Picked: This measure displays the picked base demand method when generating the system forecast.
This can be different from the System Base Demand Method Requested.
For instance, if the requested method is Pick Best, the method picked will show the actual winner of the Auto Baseline competition, like Holt.
System Base Demand History Length Requested: This measure displays the requested number of weeks used to calculate base demand when generating the system forecast.
System Base Demand History Length Picked: This measure displays the actual number of weeks used to calculate base demand when generating the system forecast.
You can also perform What-if for promotions and price in the Forecast Review workspace. This information is setup and reviewed in the main grid of the workspace.
The promo What-If workflow is as follows:
- Modify the What-If Discount and/or What-If Event values for the desired forecast weeks.
- Click What-If Promo to generate a new promotional forecast.
- Review the results in the What-If Peak measure in the Forecast Results grid.
- Repeat steps 1 to 3 as many times as necessary until you are satisfied with the results.
- When you are satisfied with the simulated forecast, click Copy to Adjusted Peak to copy the What-If Peak values into the Adjusted Peak measure.
The following action buttons are added to the workspace:
-
What-If Baseline: generates forecast with the parameter changes.
-
Copy to Adjusted Baseline: copies values from What-If Baseline into Adjusted Baseline.
-
What-If Promo: clicking this button triggers the what-if promo call.
-
Copy to Adjusted Peak: copies the values in the What-If Promo measure to the Adjusted Peak measure.