Color Usage in Tables and Graphs
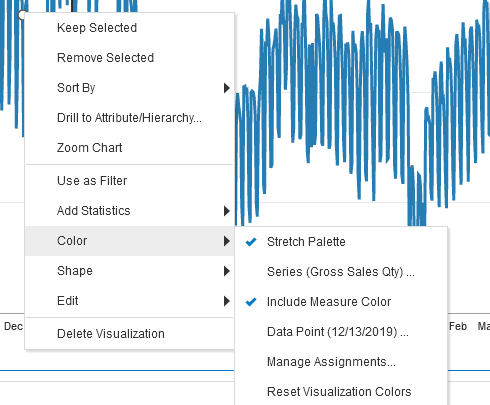
The default set of color pallets used in Oracle Analytics for cell shading and visualizations are designed with accessibility in mind and should provide sufficient contrast between on-screen elements. If you are choosing your own colors, avoid using multiple similar colors for data elements, and do not convey important information solely through the color of the element. To select a color range or specify your own, right-click on a visual element and use the Color menu option for Manage Assignments.
Figure F-7 Color Properties
