5 KPIs
This chapter describes the KPIs dashboard in Workspace, and how it is configured to show tiles. The following topics are covered:
The KPIs dashboard is available to internal (retailer/portal owner) users, who have Advanced Reporting Administrator, Advanced Reporting User, or Advanced Reporting Reader access rights. The contents of the dashboard are configured by the user. Clicking a tile opens the full KPI chart or table.
KPIs Dashboard
As an Advanced Reporting user, you will see the KPIs dashboard within the Workspace page.
Figure 5-1 KPIs in Workspace
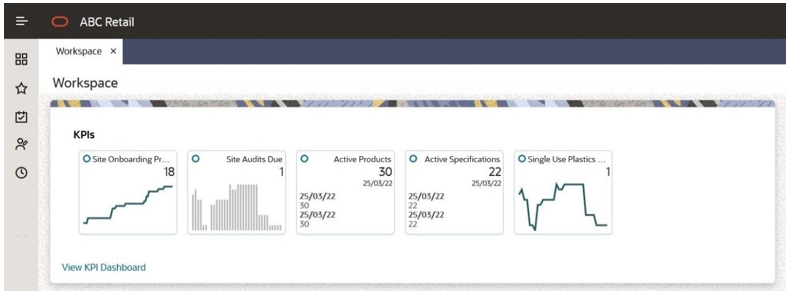
You must configure which KPIs you wish to appear in the dashboard, from those that are available to you. For further details, see the Configuring the Dashboard section.
Once you have added KPIs to your dashboard, they are shown as a set of tiles. Use the > and < controls to scroll through the list if there are more to show.
The KPI data is based on KPI reports that are generated in classic Brand Compliance. The tile shows the KPI metric, and either a thumbnail representation of a chart, or the latest three values of a table.
Clicking the tile opens the KPI Dashboard page containing the full chart or table.
Configuring the Dashboard
The KPIs available to you are those which you have access to within the classic Brand Compliance Reports module. This requires you to be granted access to the KPI as a recipient, and the KPI must be made available for selection as a Workspace KPI. See the Managing Workspace KPIs section.
Adding KPIs
To add tiles to your dashboard:
-
Click the View KPI Dashboard link within the dashboard, or select the Workspace/KPI Dashboard option from the Tasks menu.
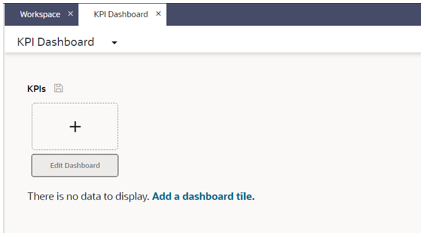
Figure 5-2 KPI Dashboard Page - Add Dashboard Tile
-
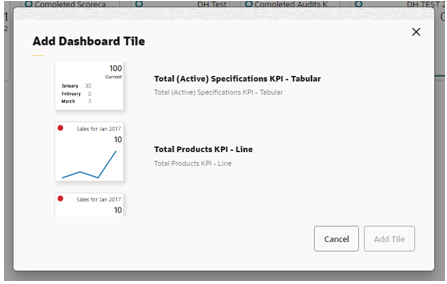
From the KPI Dashboard page, click Add a dashboard tile or the + control, and select from the list of available KPIs.
Figure 5-3 Add Dashboard Tile Dialog Box
-
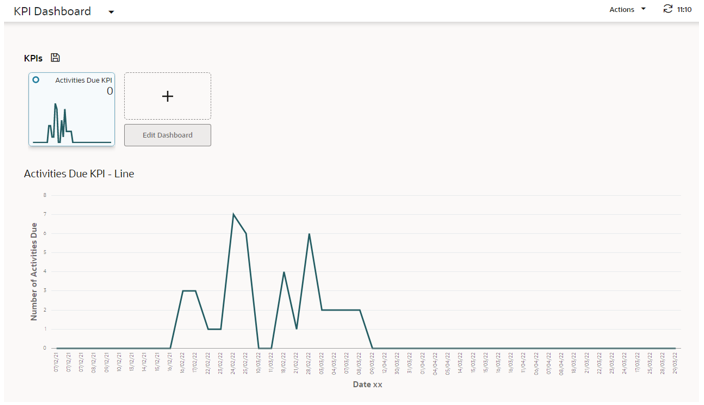
Click Add Tile. The KPI Dashboard page is refreshed to show the selected KPI has been added as a tile, plus the full chart or table.
Figure 5-4 KPI Dashboard Page - KPI Added
-
Repeat to add other KPIs. You can select up to 12 tiles to show in the dashboard.
-
Click the
 Save icon to permanently apply the selections
to your dashboard.
-
Return to the Workspace page and refresh the page. The KPIs Dashboard will now show your selected KPI tiles.
Editing the Dashboard
Once your dashboard is populated, you can reconfigure it to add, remove, or reorder your tiles.
To edit your dashboard, open the KPI Dashboard page by clicking a tile or the View KPI Dashboard link within the dashboard, or by selecting the Workspace/KPI Dashboard option from the Tasks menu.
Figure 5-5 KPI Dashboard Page - Edit KPIs
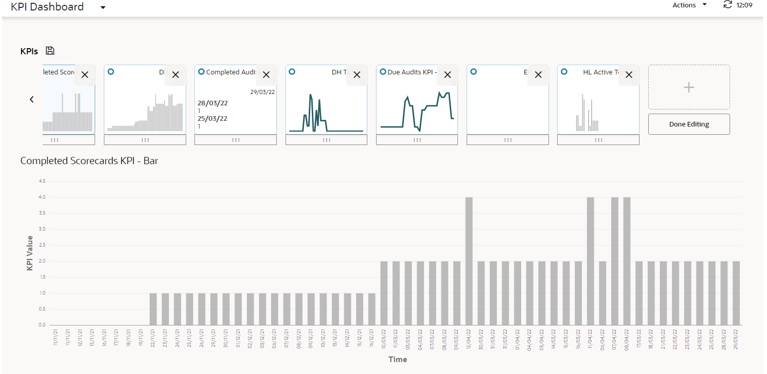
To add a tile, locate the + control in the right-most tile, and complete per the Adding KPIs section.
To remove or move a tile, click the Edit Dashboard button, then click the X control on the tile to remove it, or click the … control and drag and drop the tile to move it. As an alternative to dragging and dropping, you can right-click the … control and use the Cut and Paste Before/Paste After options.
When you have made the changes, click Done Editing and then click
the ![]() Save
icon to permanently apply the selections to your dashboard. Return
to the Workspace page and refresh the page to see the changes.
Save
icon to permanently apply the selections to your dashboard. Return
to the Workspace page and refresh the page to see the changes.
Managing Workspace KPIs
For a KPI to be selectable to add to your dashboard, you must be assigned as a recipient of the KPI report when it is scheduled to run.
The KPI report must also be configured to be available for selection in the Workspace KPIs dashboard. This can be done by users with Advanced Reporting Administrator or Advanced Reporting User access rights, using the Manage Workspace KPIs option within the classic Brand Compliance Reports module menu.
To make a KPI report output available for selection in the Workspace KPIs dashboard, create a record for it within the Manage Workspace KPIs area.
Figure 5-6 Manage Workspace KPIs

Select the KPI Schedule that relates to the KPI, and enter a Name to identify it as a Workspace KPI. A Description and Sequence number can optionally be used to provide more information, and set its order, when presented in the Add Dashboard selector.
Then select the Display Type for the required type of KPI output (Tabular, Bar Chart or Line Chart), and provide the X Axis and Y Axis labels.
Report Schedule Reversioning
The Workspace KPI record forms the link between the Workspace KPI tile and the KPI Report Schedule, thus providing users who have been named on the Report Schedule with access to that KPI for use in their KPIs dashboard.
When a KPI Report Schedule is selected in the Workspace KPI record, the link is formed to that Schedule, not to a specific version of it. Therefore, if the Schedule is reversioned, there is no need to relink the Workspace KPI record.
As a new version of the Schedule may exclude a user who previously had access, and who has the KPI selected in their dashboard, the KPIs dashboard always references the latest version of each KPI tile’s Schedule record, to determine if the user is named on that version. If they are not, the tile is not displayed or selectable, even if they had access to it previously.
If there is not an active version of a Schedule, any associated tiles will not be displayed or selectable within the KPIs dashboard.
Viewing KPIs
To view a KPI chart or table, open the KPI Dashboard page by clicking a tile or the View KPI Dashboard link within the dashboard, or by selecting the Workspace/KPI Dashboard option from the Tasks menu. The full chart or table is presented beneath your dashboard tiles. Clicking another tile will refresh the page to show the chart or table for that KPI.
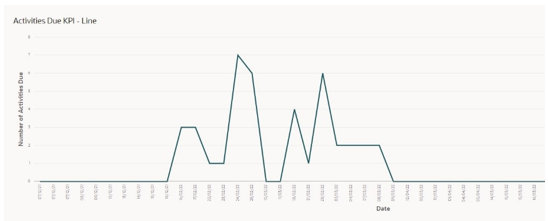
Chart KPIs are presented as bar chart or line chart, with the KPI value as the y-axis and the x-axis being the time interval.
Figure 5-7 Chart KPI
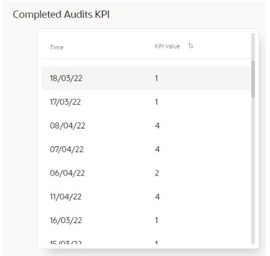
Tabular KPIs are presented as a scrollable list, with a sort option on the y-axis KPI value column only.
Figure 5-8 Chart KPI
