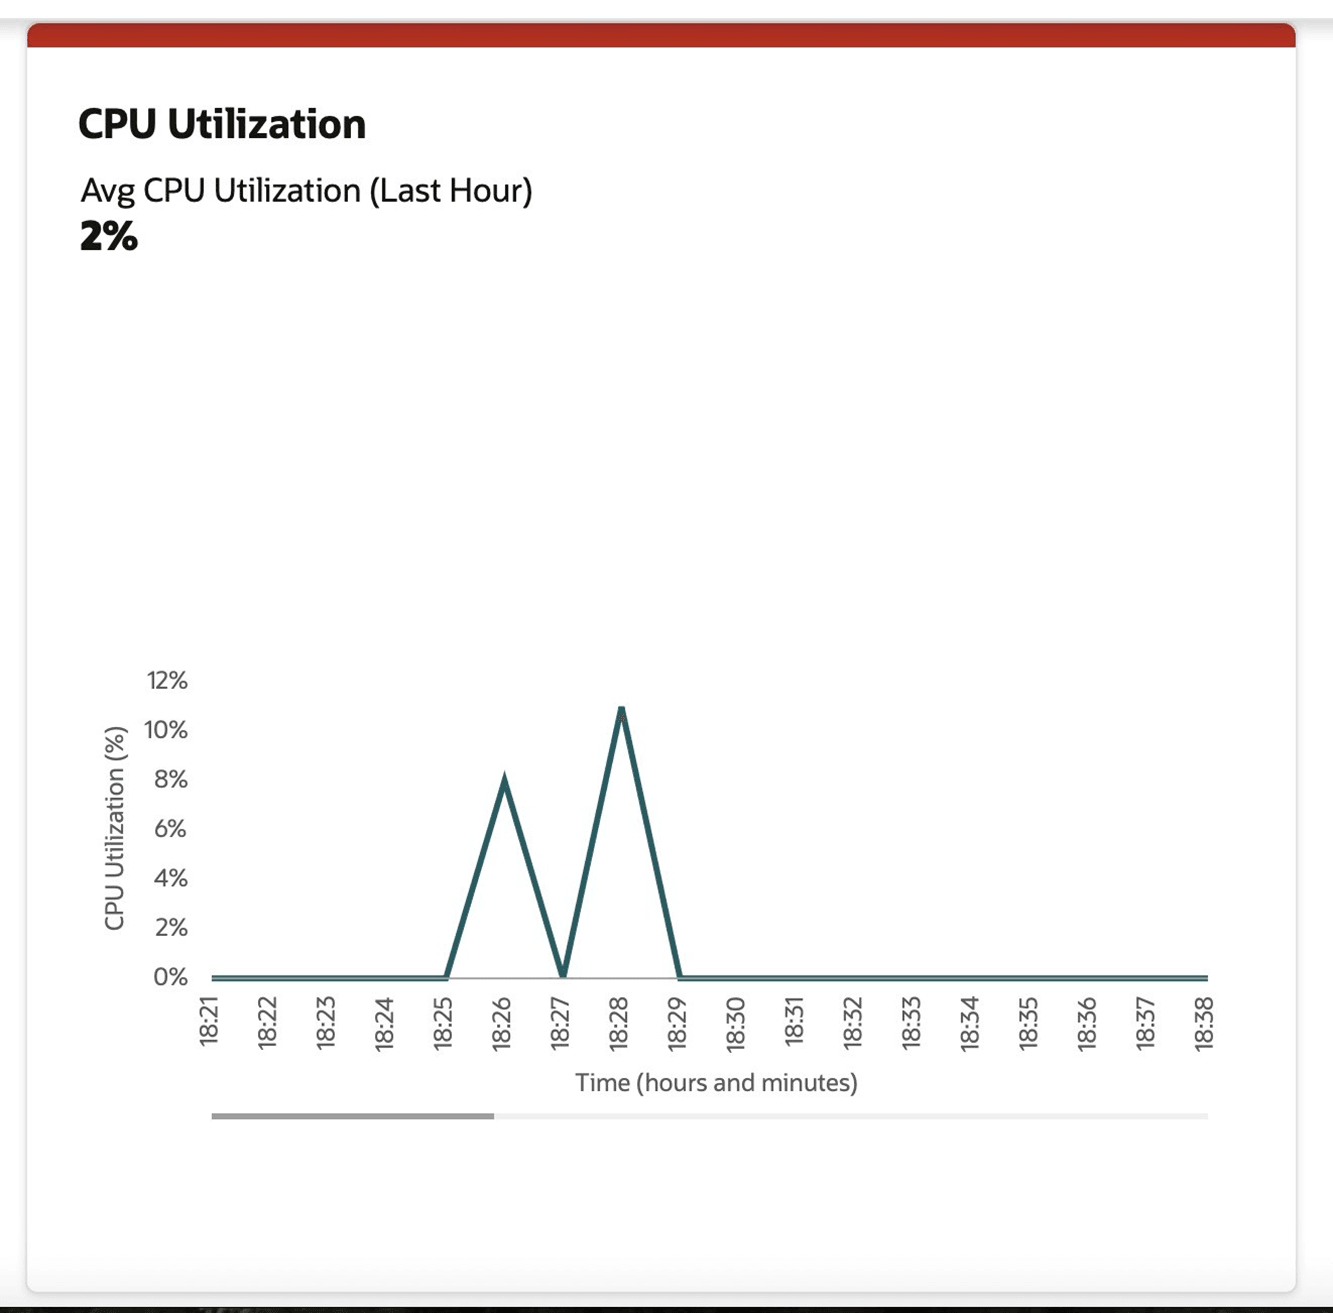
E CPU Utilization Metric Tile Example
This document provides a full working example of a PL/SQL-based REST service that exposes Oracle CPU metrics as a JSON response suitable for Oracle Retail Home dashboard tiles. It includes a line chart of CPU usage over time and a summary of average CPU utilization for the past hour.
Overview
The implementation draws on the v$metric_history and
v$parameter views to retrieve and normalize CPU usage. It uses
PL/SQL functions to generate the required JSON structure for visualization. The data is
exposed through an anonymous block suitable for use in an APEX RESTful service.
Function: get_cpu_count
Purpose
This function queries the v$parameter view to determine the number of
CPU cores available to the database instance. This count is used to normalize CPU usage
metrics from Oracle’s internal monitoring views (which report usage across all CPUs). By
dividing usage by the CPU count, the result is expressed as a per-CPU percentage, making
it easier to interpret across systems with different configurations.
Error Handling
If the parameter is not found or an unexpected error occurs, the function returns 0 to ensure downstream logic can continue gracefully.
CREATE OR REPLACE FUNCTION get_cpu_count RETURN NUMBER IS
  l_cpu_count NUMBER;
BEGIN
  SELECT TO_NUMBER(value)
    INTO l_cpu_count
    FROM v$parameter
  WHERE name = 'cpu_count';
  RETURN l_cpu_count;
EXCEPTION
  WHEN no_data_found THEN
    RETURN 0;
  WHEN OTHERS THEN
    RETURN 0;
END;
/
Function: get_rh_chart_data_json
Purpose
This function builds a JSON-formatted line chart showing CPU utilization over time. It
uses v$metric_history, which contains recent time-series metrics
(typically at one-minute intervals), and converts each sample’s end time into a
human-readable format ( HH24:MI). CPU usage values are normalized using
get_cpu_count.
Key Features
-
Uses
JSON_ARRAYAGGto collect multiple data points into a single array. -
Wraps the data in a chart structure expected by Oracle Retail Home tiles.
-
Includes metadata such as axis titles, tooltip rendering, and value formatting.
Design Note
Because the metric CPU Usage Per Sec returns usage across all CPUs in
centiseconds (that is, 1/100 second), dividing by the CPU count yields per-core
utilization (0.00–1.00 range, often rendered as a percentage with two decimal
places).
CREATE OR REPLACE FUNCTION get_rh_chart_data_json RETURN CLOB IS
  l_json CLOB;
BEGIN
  WITH chart_data AS (
    SELECT TO_CHAR(m.end_time, 'HH24:MI') AS sample_time,
           ROUND((m.value / 100) / get_cpu_count(), 2) AS cpu_utilization_pct
      FROM v$metric_history m
     WHERE m.metric_name = 'CPU Usage Per Sec'
  )
  SELECT JSON_OBJECT(
            'type' VALUE 'line',
            'items' VALUE JSON_ARRAYAGG(
              JSON_OBJECT(
                'name' VALUE cd.sample_time,
                'series' VALUE 'CPU',
                'value' VALUE cd.cpu_utilization_pct
              ) ORDER BY cd.sample_time
            ),
            'renderTooltips' VALUE 'true',
            'valueFormat' VALUE 'PC',
            'renderXAxisLabels' VALUE 'true',
            'renderYAxisLabels' VALUE 'true',
            'xAxisTitle' VALUE 'Time (hours and minutes)',
            'yAxisTitle' VALUE 'CPU Utilization (%)'
          )
     INTO l_json
     FROM chart_data cd;

  RETURN l_json;
END;
/
Function: get_rh_summary_json
Purpose
This function computes a single-value summary of CPU usage: the average CPU utilization across all data points in the last hour. Like the chart data, values are normalized using the number of CPUs.
Output Format
The function produces a JSON array with a single item:
{
  "name": "Avg CPU Utilization (Last Hour)",
  "value": <normalized average>,
  "valueFormat": "PC"
}
Use Case
This value appears prominently at the top of the metric tile as a high-level indicator of system load.
CREATE OR REPLACE FUNCTION get_rh_summary_json RETURN CLOB IS
  l_json CLOB;
BEGIN
  WITH summary AS (
    SELECT ROUND(AVG((m.value / 100) / get_cpu_count()), 2) AS avg_cpu_utilization
      FROM v$metric_history m
    WHERE m.metric_name = 'CPU Usage Per Sec'
  )
  SELECT JSON_ARRAYAGG(
           JSON_OBJECT(
             'name' VALUE 'Avg CPU Utilization (Last Hour)',
             'value' VALUE avg_cpu_utilization,
             'valueFormat' VALUE 'PC'
           )
         )
    INTO l_json
    FROM summary;

  RETURN l_json;
END get_summary_json;
/
Function: get_rh_cpu_utilization_json
Purpose
This function combines the output of the previous two functions into a single JSON object with two keys:
-
items: Contains the summary. -
chart: Contains the line chart data.
Design Pattern
The approach ensures separation of concern: each sub-function is responsible for one part of the structure, and this final function composes them.
Why FORMAT JSON is Used
It preserves the embedded JSON structure when building the outer object, avoiding character-escaping issues.
CREATE OR REPLACE FUNCTION get_rh_cpu_utilization_json RETURN CLOB IS
  l_json CLOB;
  l_items CLOB;
  l_chart CLOB;
BEGIN
  l_chart := get_rh_chart_data_json();
  l_items := get_rh_summary_json();
  SELECT JSON_OBJECT(
           'items' VALUE l_items FORMAT JSON,
           'chart' VALUE l_chart FORMAT JSON
           RETURNING CLOB
         )
    INTO l_json
    FROM dual;

  RETURN l_json;
END get_rh_cpu_utilization_json;
/
Anonymous Block (REST Service Source)
Purpose
This anonymous PL/SQL block serves as the source code for an APEX RESTful service. When the REST endpoint is invoked, this block executes and returns a complete JSON response representing CPU usage data.
Key Elements
-
owa_util.mime_header('application/json'): Sets the HTTP content type to JSON. -
htp.p('Cache-Control: no-cache'): Disables caching to ensure fresh data. -
htp.prn(l_json): Prints the resulting JSON to the response body.
Context
This block is typically configured as the source of a GET method in Oracle APEX RESTful services. It bridges the backend metric data with the frontend visual tile.
DECLARE
  l_json CLOB;
BEGIN
  l_json := get_rh_cpu_utilization_json;

  owa_util.mime_header('application/json', FALSE);
  htp.p('Cache-Control: no-cache');
  owa_util.http_header_close;

  htp.prn(l_json);
END;
Example REST Service Response
{
  "items": [
    {
      "name": "Avg CPU Utilization (Last Hour)",
      "value": 0.02,
      "valueFormat": "PC"
    }
  ],
  "chart": {
    "type": "line",
    "items": [
      { "name": "18:26", "series": "CPU", "value": 0.08 },
      { "name": "18:27", "series": "CPU", "value": 0 },
      { "name": "18:28", "series": "CPU", "value": 0.11 },
      ...
    ],
    "renderTooltips": "true",
    "valueFormat": "PC",
    "renderXAxisLabels": "true",
    "renderYAxisLabels": "true",
    "xAxisTitle": "Time (hours and minutes)",
    "yAxisTitle": "CPU Utilization (%)"
  }
}
Figure E-1 CPU Utilization Tile Displaying Average and Time-Series Values Derived from the REST Service