2 Retail Insights Cloud Service
Dashboards and Tiles
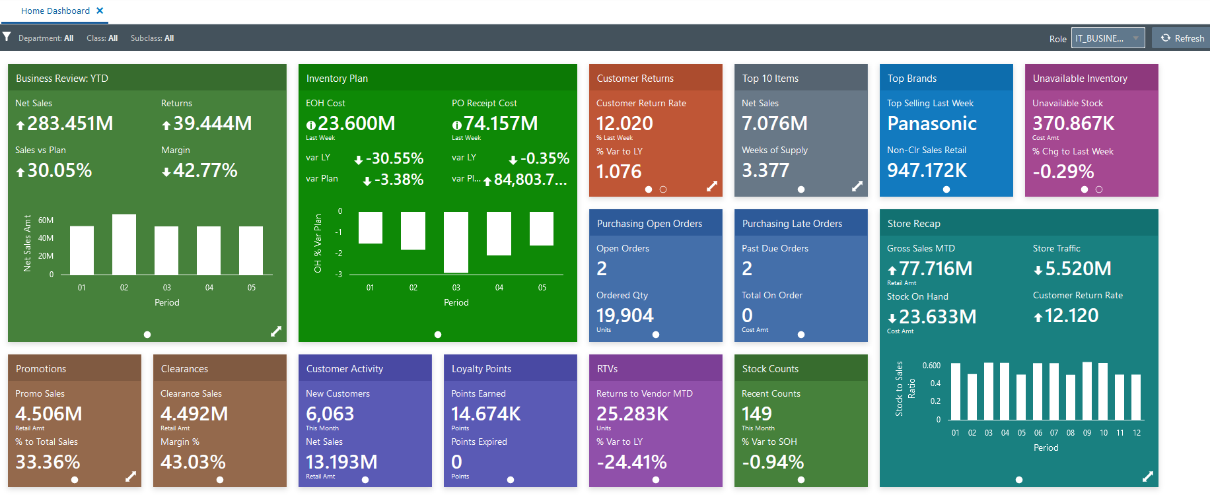
If you purchased Oracle Retail Insights as part of your Oracle Retail subscription, then Retail Home can be populated with thousands of pre-integrated metrics through that platform. Retail Insights (RI) provides a set of pre-built sample tiles and dashboard layouts for Retail Home to get a new user started with RI/Retail Home integration. The sample tiles include tile states, filters, layouts, and embedded Data Visualization (DV) content for a variety of common reporting areas such as sales, inventory, and purchase orders. To import this content into your Retail Home environment, go to the Application Navigator Setup, select the RI application row in the table, and click Refresh Seed Data. The application name in the table must be Retail Insights as the seed data is linked to that name only. The sample dashboards created by the seed data import are intended for use by the roles described below.
| Dashboard Role | Summary |
|---|---|
|
INVENTORY_ANALYST_JOB |
Dashboard for a user group that primarily cares about inventory levels and movement of stock. |
|
IT_BUSINESS_ANALYST_JOB |
Dashboard for a user group that wants a broad overview of the current state of their business so they can drill in to focus on different areas needing analysis. |
|
LOYALTY_MANAGER_JOB |
Dashboard for a user group focused on customer activity, such as loyalty programs and promotions. |
|
PRICING_ANALYST_JOB |
Dashboard for a user group that cares mainly about the retail value of goods sold relative to costs across the different price points such as promotions and clearances. |
Inventory Analyst Dashboard
This dashboard highlights some of the key reporting areas that may be of interest to an inventory analyst user group from Retail Insights in the areas of inventory on-hand and on-order, inventory comparisons to plan, returns to vendor, recent stock count adjustments, and unavailable inventory levels. The Inventory Movement tile expands to a Data Visualization (DV) project which provides a deeper analysis of inventory levels and movement.

IT Business Analyst Dashboard
This dashboard provides an overview of many different reporting areas in Retail Insights, intending to give a business analyst a quick snapshot of the current state of the business. Using the many different tiles on sales, inventory, POs, and other areas, the analysis can click through to additional reports to dig into problem areas as needed. The Business Review tile expands to a DV project that reports on sales performance across the business, while the Store Recap tile expands to a more store-centric view of sales.
Loyalty Manager Dashboard
This dashboard provides a customer-centric view of data in Retail Insights for a user group that is interested in customer activity like loyalty point usage and promotion redemption. KPIs like New Customer counts and Capture Rate may be an important part of the retailer’s strategy when it comes to attracting and retaining customers. Like the other dashboards, this view also includes the sales performance tile so that all user groups have a common frame of reference for how the business is performing.

Pricing Analyst Dashboard
This dashboard includes metrics on the retail price of goods across different price points, which is important for pricing analysts to understand as they plan for future pricing strategies and set price points for promotional and clearance activities. Analysts may want to see promotional pricing KPIs such as the average discount percent customers are getting, or the ratio of promotional sales to total sales when determining future promotion pricing. They can see how much clearance inventory they currently have on hand, which is useful for deciding when to apply deeper markdowns to clear out more stock.

Retail Home Templates
RI includes several catalog objects intended to support integration with Retail Home. These objects can be located in the Shared Folders > Retail Home folder in the catalog.
The sample objects include:
-
Dashboard Tiles – these analyses are provided to demonstrate the various BI tile formats used in Retail Home, and they also feed into the sample dashboard layouts.
-
Filters – these pre-defined filter objects can be added to RI analyses that are going to be linked to Retail Home tiles. Setting up filters for RH tiles requires that the RI analysis have an associated filter on it, otherwise the analysis will not refresh when filter values are changed.
-
LOVs – these pre-defined filter data sources are provided to enable Retail Home filtering on many different dimensions in RI. You must specify a data source in Retail Home filters for it to populate the list-of-values. The LOV in Retail Home and the filter on the RI analysis must have matching values.
-
Projects – these DV projects are used in the sample Retail Home dashboards, but you are free to copy and repurpose them for your own dashboards and reporting, both in Retail Home and elsewhere.
For more information on creating RI analyses for Retail Home, refer to the Custom Tile State Reports Configuration chapter of the Oracle Retail Home Administration Guide.
Customizations
Retail Home provides direct integration with Retail Insights in the form of role-based dashboards and KPI tiles, allowing retailers in the Oracle Cloud to surface customized insights and analytics directly to their business users without logging in to RI itself. This allows the entire business to benefit from RI's rich data model and advanced analytic capabilities without the overhead of learning the product or navigating through multiple cloud solutions. This section will explain the integration architecture and provide a step-by-step walkthrough to connect Retail Home and RI.
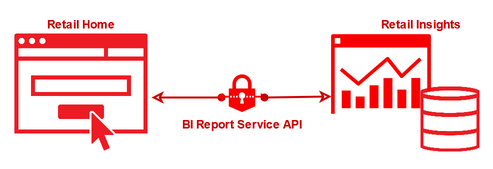
The Retail Home integration is largely service-oriented, leveraging report templates to determine which API calls it should make to retrieve data. When selecting a BI report template in Retail Home, the system uses an authenticated connection to a BI report service API which can call RI reports and send the results to external consumers. Any data in RI can be used as long as the analysis conforms to the Retail Home template's specifications.
The following templates in Retail Home are configured to query reports in RI:
-
BI Two Metric Template (1x1 Tile Size)
-
BI Twelve Metric Template (1x1 Tile Size)
-
BI Four Metric with Chart Template (2x2 Tile Size)
-
BI Six Metric with Chart Template (2x2 Tile Size)
-
BI Image Table Template (2x2 Tile Size)
-
BI Image Metrics Table Template (2x2 Tile Size)
-
Data Visualizer Template (Expanded View Only)
The BI templates will use Oracle Analytics analyses (also known as Oracle Analytics Classic reports). The Data Visualizer template uses a Project file created from DV and saved in a shared location in the RI catalog. The Chart templates require two additional analyses: a chart configuration analysis and a chart data analysis. Examples of all analysis types are provided in this document.
Retail Insights Report Configuration
Retail Home Dashboard Setup
Creating Four/Six Metric Tiles
Debugging Tile Results
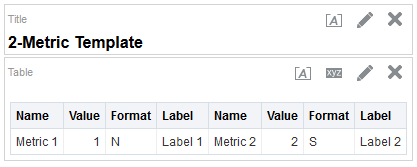
The first step in using the RH/RI integration is creating the source analysis that will provide the data for the dashboard tile. To begin, create a new analysis using a Retail Insights subject area. Add fields to the analysis matching the screenshot below. A sample analysis is also included in the Retail Insights catalog.

Each field follows specific rules as follows:
-
Name – Must provide a character-based primary label for the metric. Should not be more than 15-20 characters, as any longer will get cut off on the resulting tile.
-
Value – Returns the data you wish to show in the tile. Can be a number or text.
-
Format – Must be a code using one of (‘N’, ‘S’, ‘PC’) for number, short-number, and percent. If you are providing a text value instead of a number, set the field to a null value using two single quotes (‘’).
-
Label – Provide an optional label which is placed under the metric value. If not used, set the field to a null value using single quotes.
When you run the analysis, it must return only a single row of data with all fields populated with a value or hard-coded to null as explained above. An example result set is shown below.
When you are finished editing the analysis, save it to a shared location in the Retail Insights catalog. This means placing it under a /Shared Folders/Custom/sub-directory. In this example, the analysis is saved in the Catalog in the following location: /Shared Folders/Custom/Retail Home/Retail Home Tiles/2-Metric Template
To configure Retail Home to use the analysis created in the prior step, use the following instructions.
-
Login to Retail Home as an administrator (having the role RETAIL_HOME_ADMIN) and open the Settings > Dashboards and Reports > Dashboards > Custom Reports tab.
-
Create a new report using the Add button.
-
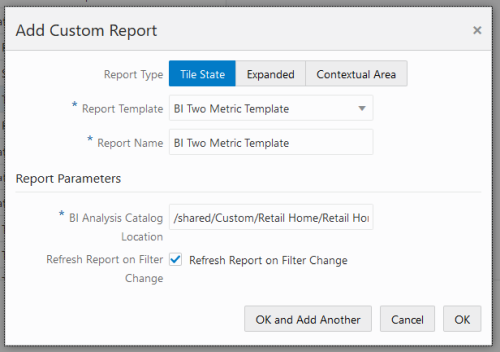
Select the BI Two Metric Template. Enter a unique name to uniquely identify the report.
-
The BI analysis path uses a slightly different format from the catalog in RI. Anything in Shared Folders will use the file path /shared/, for example: /shared/Custom/Retail Home/Retail Home Tiles/2-Metric Template
-
Lastly, select the checkbox to ensure the tile refreshes if any filters are changed (leaving it unchecked means the tile will not re-execute for filter changes).
When you are finished, the configuration should appear like below. Click OK to save the report configuration.
The next part of the configuration must be done from the Settings > Dashboards and Reports > Dashboards > Dashboard Configuration tab.
-
From the first step in the process flow on this tab, create a new dashboard tile to display your report on.
-
The tile name is shown in the header bar of the tile.
-
The application should be selected as Retail Insights.
-
The URL can be left as the default one for the application, or you can replace it with a custom link.
-
Lastly, choose a color for the tile.
When you are finished, the configuration should appear like below. Click OK to save the tile configuration.
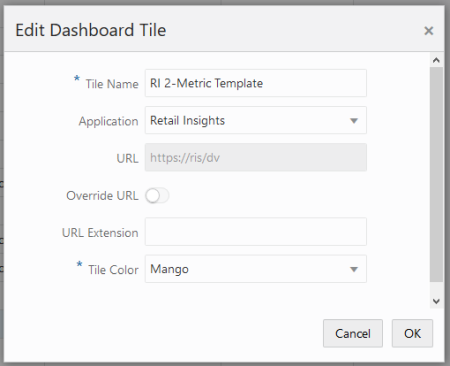
Now click through the process flow until you reach the Layouts screen. If you do not have any Layouts created, add one for a role of your choice (creating a layout for RETAIL_HOME_ADMIN is typical for testing configurations before publishing them to users). Once the layout is created, locate the new tile in the panels on the right and click the plus sign next to it to move it to the right-most list. Keep the tile size as 1x1.

Advance to the Tile States screen. Select your dashboard and tile from the dropdown menus. From the main table on the left side, use the Add action to add your report as a tile state in this tile. Ensure the Displayed checkbox is enabled.
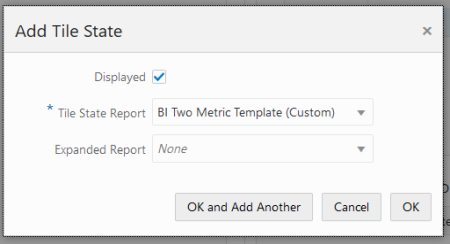
Click OK to save the changes. Return to the Home Dashboard tab. Select your dashboard from the dropdown menu and click Refresh to reload the tiles. If you had to create the layout, then you may need to close the tab completely and re-open it first. Your new tile should appear in the dashboard and pull the data from Retail Insights.
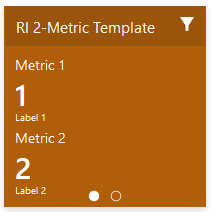
The general process for creating the other tile types is the same as the two-metric tile. The main differences are:
-
The larger tiles have a 5th field for each metric in the analysis, which supports status symbols such as up or down arrows. These fields must use the word associated with the symbol (up, down, critical, etc.) and can be hard-coded or dynamically chosen using CASE statements in the RI formula. The complete list of available status codes is provided in the Retail Home Administration Guide: https://docs.oracle.com/cd/F16882_01/rh/pdf/210/html/admin_guide/rpt_data_reqs.htm#BABBDFDI
-
The charts in the 2x2 tiles require a configuration analysis and a data analysis. The configuration analysis is a fixed set of input fields that control chart formatting and labels. The data analysis is a two-column dataset of key/value pairs. All of the fields are detected by Retail Home based on their position in the analysis from left to right. For details on what each field is, refer to the Retail Home Administration Guide section on BI layouts: https://docs.oracle.com/cd/F16882_01/rh/pdf/210/html/admin_guide/rpt_data_reqs.htm#BABBEHBH
Samples of other BI analysis types are provided in Retail Insights in the Catalog path:
/Shared Folders/Retail Home/Dashboard Tiles
Adding Filters to Tiles
Filters in Retail Home are a way for the user to control the results returned on a tile. Filters can both be sourced from RI data and be passed back into a BI tile to filter the results. Filters are persisted locally for each user across sessions, meaning that a tile will always display the same results on first logging in, based on the user’s prior selections.
Sourcing Filters from RI
Just like a tile, the filters use BI analysis to get their data. The analysis in RI must have exactly two columns for the filter ID and Value pairs. The IDs are used in API calls to filter data. The Values are displayed in user interfaces. An example using Department data is shown below.
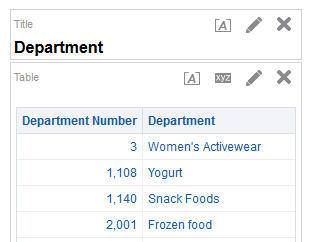
After saving this analysis in a shared location, you can add it as a data source in the Dashboard Filters screen in Retail Home. The filter must be created inside the Retail Insights application so that it is available for all tiles which are also linked with Retail Insights. An example filter using the Department data is shown below.
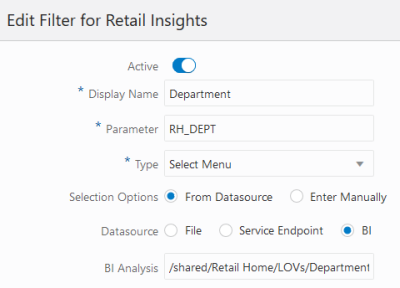
The parameter must be a single string of letters or underscores with no spaces or other special characters. This parameter will be passed on to the URL of the BI Report Service API calls, so any special characters could cause an incorrect URL which will prevent report results from returning
Using Filters in RI
For the filter in Retail Home to be applied inside an RI analysis, you must create an RI filter that looks for the parameter you’ve created. This filter must use a precise format, or it will not return the expected results. The filter must be created using the convert-to-SQL option when adding a new filter. An example using the sample department filter configuration is shown below.
Both filter data sources and filter objects for analyses are provided in the Retail Insights catalog at the paths below. These can be used in your Retail Home dashboards as-is or you may make copies of them to create your own.
/Shared Folders/Retail Home/LOVs (for sourcing filter data)
/Shared Folders/Retail Home/Filters (for adding filters to tile analyses)
Adding Filters to Tiles
Once you have completed both of the previous sections, you may add the filters to one or more tiles in the Tile States configuration screen. For a filter to be applied, the Application Name must match between the tile and filter objects. Matching filters are displayed in a table in the bottom right corner of the Tile States screen. Simply enable any of the filters you want to use with your tile.
An example filter configuration for a Retail Insights tile is shown below.
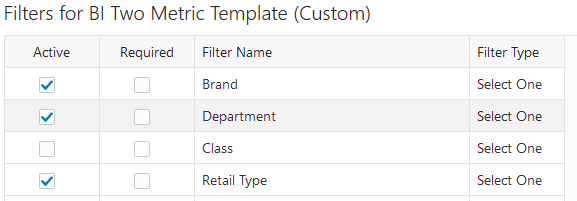
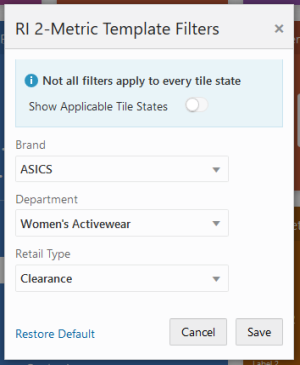
Once the filters are enabled, return to the Retail Home Dashboard tab and refresh the dashboard containing your tiles. Clicking the filter icon on the tile will now bring up a filter screen where you can select from your specified criteria.
When creating new tiles based on RI data, you may get unexpected results such as formatting errors or missing/null values that require adjustments in the source analysis. To identify if the analysis is the root cause of the issues, you may use your browser’s development tools to view the results of the BI Report Service API calls.
Using Firefox, you can access the tools by hitting F12 on the keyboard. Make sure you are on the Network tab as shown below.

Now refresh the Dashboard using the Refresh button and wait for the network traffic to load. You will see a call to an API like the following:
https://ris/RetailHomeRESTServices/services/private/bi/analysis

Click on the Response tab of this API call. You should see the JSON response data containing the BI analysis results. The fields are numbered starting from 0, which is the order of the columns in the source analysis from left to right. Use these results to fine-tune your RI analyses until they are returning the expected results to Retail Home.

If the API call has resulted in an HTTP error code (404, 500, etc.) then the service is not available, and you should contact Oracle Support for assistance. If the API call was successful but no data was returned, then your BI analysis may not have been saved to a shared location or it may have been configured incorrectly in the Custom Report configuration in Retail Home.
Administration Tools
Resource Bundle Customization
Retail Insights supports the use of the following Retail Home tasks:
-
Resource Text Strings
-
Import Management
Resource Text Strings
Import Management
The Resource Text Strings screen provides the capability to customize the resources present in the resource bundles in Retail Insights. These text strings are used as the labels and descriptions for all metrics and attributes in the base catalog.
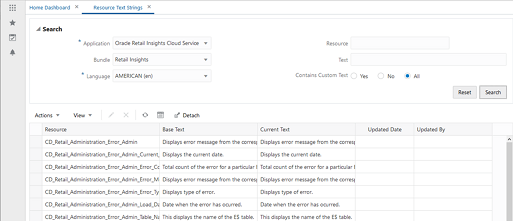
During or after your implementation of Retail Insights, you may decide that some attributes or metrics need to be re-labeled to have more meaningful values for your users. From this screen, you can edit the default labels and they are persisted to RI as part of the nightly batch process. Resources starting with CN_ are for object names displayed in the folders in an analysis or DV project when using the Retail Insights subject areas. Resources starting with CD_ are the descriptions of those objects, which can only be seen by hovering the mouse cursor over the attribute or metric.
Users may leverage these actions in the Resource Text Strings screen for RI data:
-
Edit
-
Search
-
Export to Excel
You should not add or delete rows as such changes will not be picked up by RI.
Retail Insights also supports exporting the text strings displayed in the Resource Text Strings screen, modifying them from Excel, and then importing them in the Import Management screen. You should always start with an export of the data from Retail Home. Creating an Excel file with the same layout will result in errors when importing. When you import the text strings, the new values should appear in the Current Text field in Resource Text Strings.
For more details on the resource bundle and import management screens, refer to the Oracle Retail Home Administration Guide.