4 Creating and Modifying Reports
Getting Started with Oracle Analytics
Note:
If you have a full Retail Insights subscription, then you will have access to the Analytics Classic portion of the user interface, which uses a URL ending in “analytics”. If you do not have an RI subscription but you are using one or more other Retail Analytics & Planning (RAP) applications, then you will have access only to Data Visualization (DV). Within each section of this chapter, it will be noted if the content refers only to Analytics or DV.Retail Insights uses the Oracle Analytics Server (OAS) platform as its user interface. Learning about the core features and functionality of this interface is a necessary first step in accessing your data and building analyses and dashboards. OAS is split into two modules, Analytics Classic and DV. Analytics Classic uses the concepts of analyses and dashboards to display your data, while DV uses workbooks which are a combination of both types of objects in one modern interface.
An analysis is a query against your organization's data that provides you with answers to business questions. Analyses enable you to explore and interact with information visually in tables, graphs, pivot tables, and other data views. You can also save, organize, and share the results of analyses with others. Users of Retail Insights can be granted the ability to view existing analyses or create new ones, depending on your permission levels.
Once an analysis is created and saved, it can be added to dashboards. Dashboards can include multiple analyses to give you a complete and consistent view of your company's information across all departments and operational data sources. Dashboards provide you with personalized views of information in the form of one or more pages, with each page identified with a tab at the top. Dashboard pages display anything that you have access to or that you can open with a web browser including analyses results, images, text, links to websites and documents, and embedded content such as web pages or documents.
To learn more about creating and viewing analyses in Oracle Analytics, start here:
https://docs.oracle.com/en/middleware/bi/analytics-server/user-oas/create-analyses.html
Within DV, use workbooks to access your data, build reports, design multi-page dashboards, and visualize the results using graphs. Workbooks combine the concepts of analyses (which are singular tables or graphs on one dataset) and dashboards (which include many different views and filters).
To learn more about creating workbooks in DV, start here:
https://docs.oracle.com/en/middleware/bi/analytics-server/user-oas/visualize-and-analyze-data.html
Analysis Methods
The Retail Insights presentation model is designed in two different subject areas based on the reporting scenarios and analysis methods that Retail Insights supports:
-
Retail As-Is
-
Retail As-Was
A single instance of Retail Insights offers as-is and as-was analysis for the slowly changing dimensions Product and Organization. Slowly changing dimensions are dimensions with data that changes slowly, rather than changing on a time-based, regular schedule.
Although facts and dimensions appear similar across these subject areas, they are modeled differently in the Oracle Analytics repository. For example, Item or Subclass or Class might appear similar in all subject areas, but their sources and join conditions are different to support the appropriate method of reporting.
As-Was reporting is only available to Retail Insights subscribers. As-Is reporting should be used for all other Retail Analytics & Planning (RAP) applications.
As-Is Reporting
This type of reporting reflects the current nature of facts and dimensions as they are known to be true today. The performance of a dimension is tracked according to the current state of the dimension in a hierarchy without regard to time period.
If hierarchies have changed or items have been reclassified, as-is reporting shows history as if it had occurred under the current hierarchy or parent. Performance of the previous hierarchy or parent cannot be seen in as-is reporting.
See "Reclassification" in Dimensions and Attributes for more information.
As-Was Reporting
As-was reporting reflects the current values of transactions tied to a dimension value that was applicable at a former point in time. The performance of a dimension is tracked along the changes it has undergone in a hierarchy over a period of time. One of the effects of reclassification is that the presence of two hierarchies or parents makes it possible to compare an entity's performance before and after it undergoes this change.
In fact tables, all history is kept under the former hierarchy or parent, while all data after a reclassification is under the current hierarchy or parent.
Drilling allows you to see a particular report at a given level, and then view the same report at a lower level, to examine data at a finer level of granularity. This type of analysis makes well-defined hierarchies extremely important. Drill paths must be clear, and facts must add up between levels of aggregation. This requirement explains why changes to the position of an entity in the hierarchy are considered major.
Support for Multiple Currencies
Oracle Retail Insights supports five currencies:
-
Local Currency
-
Document Currency
-
Global 1 Currency
-
Global 2 Currency
-
Global 3 Currency
During installation, these currencies are defined for your organization. You need to know how these currency mappings are used when you design reports. For example, currencies could be defined as follows:
Table 4-1 Currency Mapping
| Currency Mapping | Currency |
|---|---|
|
Document Currency |
EURO |
|
Local Currency |
GBP |
|
Global 1 Currency |
USD |
|
Global 2 Currency |
CAD |
|
Global 3 Currency |
AUD |
By default, all data in Retail Insights will be displayed in your Primary (Local) Currency, such as USD for customers in the United States. The data warehouse nightly batch processes convert document and other currencies into the primary currency and store those values in additional tables and columns.
You have the ability to change individual reports to display in a different currency by using prefix variables. The approach will be different based on whether you use Analytics Classic analyses or DV workbooks.
To use this functionality in an analysis, follow these steps:
-
Create the report with required amount/currency metrics.
-
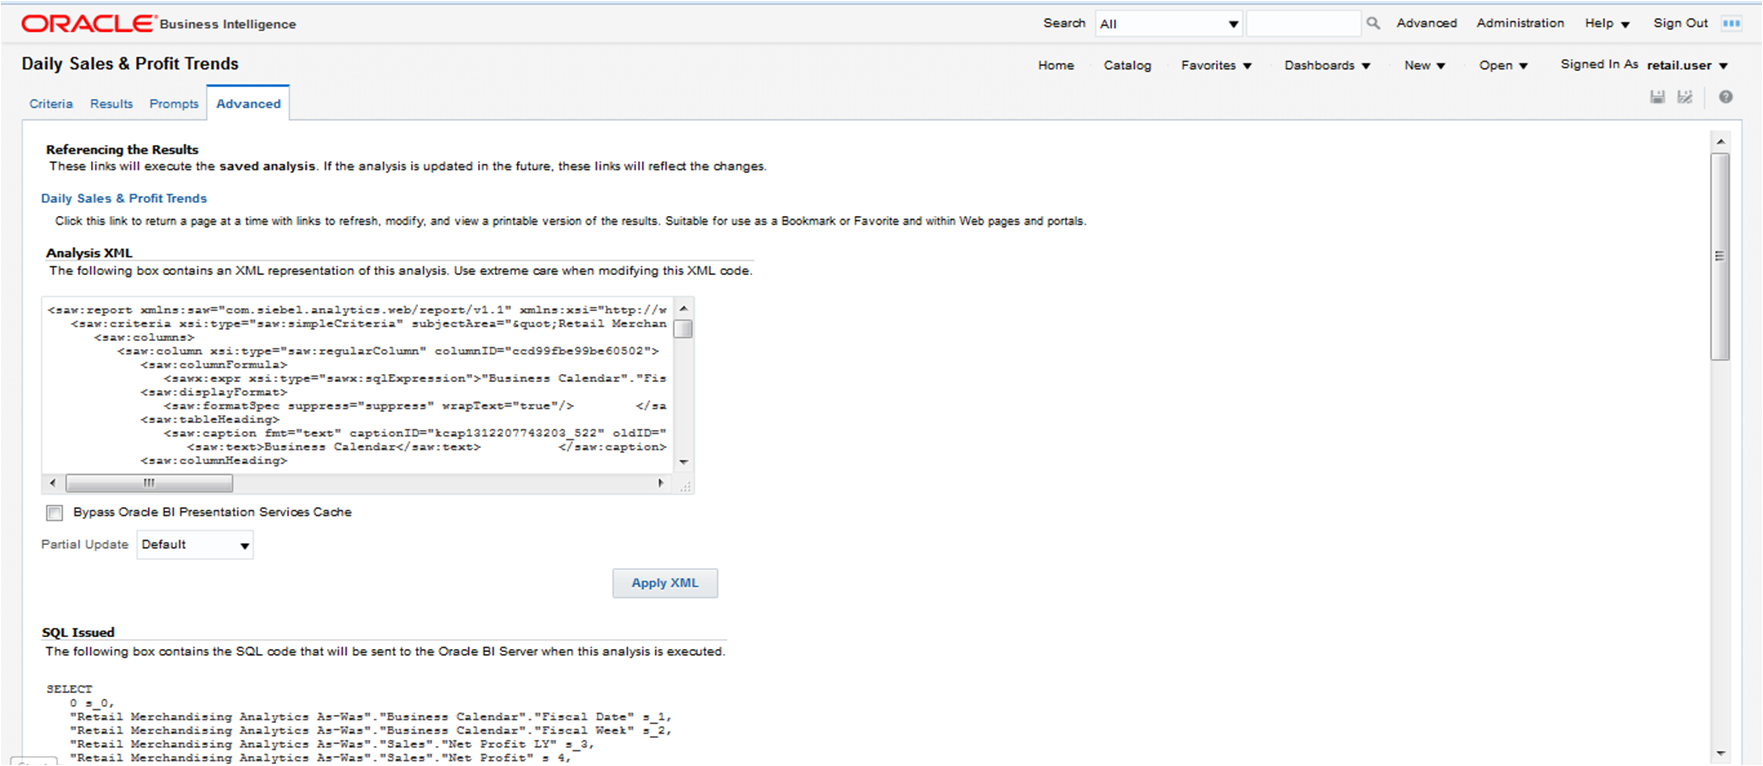
Select the Advanced tab.
-
Under Advanced SQL Clauses, in the Prefix text box, add the following:
SET VARIABLE PREFERRED_CURRENCY = 'Document Currency';
-
At the top, for testing only, you may select the check box Bypass Oracle BI Presentation Services Cache. This is needed initially to force the server to re-query the database after changing a variable value, but should not be used after testing is done.
-
At the bottom, click Apply SQL.
-
Save the report. The results should now display currency values in the specified currency type when the report is executed.
To use this functionality in a DV workbook, follow these steps:
-
Create your DV workbook with the required amount/currency metrics.
-
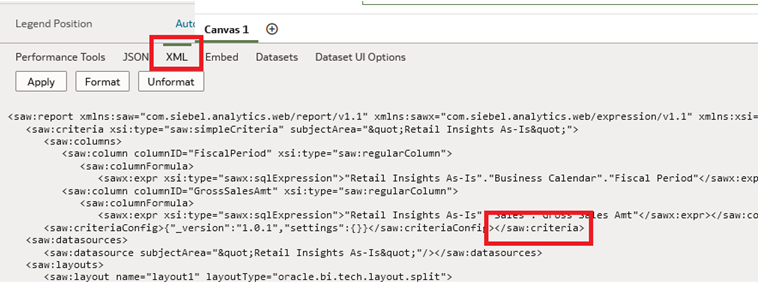
Open the Developer menu for the workbook from the main (…) menu in the upper right corner of the report.
-
Click on the XML tab and locate the portion of the XML ending with </saw:criteria>
Figure 4-1 DV Workbook XML Tab
-
Just before the ending criteria tag, insert the following XML (changing the currency type as needed): <saw:prefix>SET VARIABLE PREFERRED_CURRENCY = 'Document Currency';</saw:prefix>
-
Click Apply. The DV report should be refreshed to show the new values.
Support for Multiple Calendars
Oracle Retail Insights supports two variations of the business calendar for the purposes of last year (LY) reporting.
-
Unshifted Calendar
-
Shifted (or Restated) Calendar
During installation, a default calendar setting can be applied to use either the shifted or the unshifted calendar. This setting is held in C_ODI_PARAM and can be changed after installation, if needed.
Table 4-2 Calendar Type Options
| LY_SHIFT Parameter | Calendar Type |
|---|---|
|
UNSHIFT |
Unshifted Calendar |
|
SHIFT |
Shifted Calendar |
|
GUNSHIFT |
Gregorian Unshifted Calendar |
Retail Insights classic dashboards allow users to build a variable prompt to switch between either calendar type per-analysis, giving users the ability to compare shifted and unshifted data using the same metrics. For the Gregorian calendar, only the GUNSHIFT setting is supported, so a variable prompt is not needed.
To use this functionality in a report, or create it as a dashboard prompt, follow these steps:
-
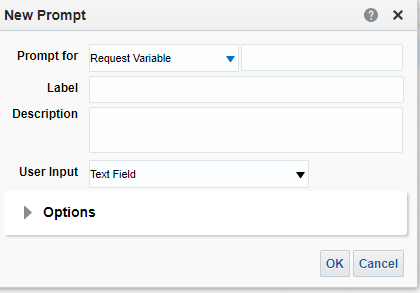
Create a New Prompt or Edit an existing one from the Prompts tab.

-
Select Variable Prompt as the type of prompt to create.

-
Select Request Variable from the drop down for Prompt For.
-
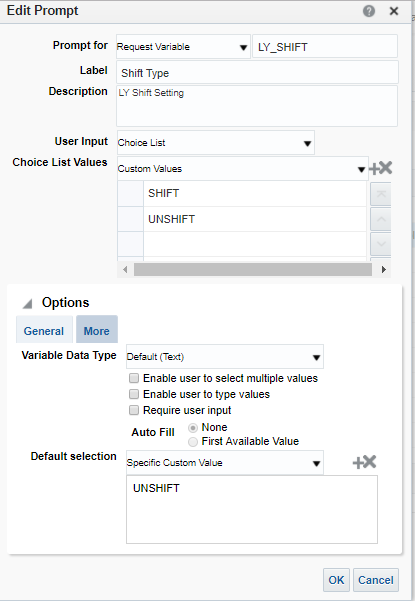
Select and fill all fields like below. Give the Variable Name as LY_SHIFT. Select User Input as Choice List and enter Custom Values as SHIFT & UNSHIFT. Give a Default value if needed.
-
Save this prompt and use it to switch the value of the session variable LY_SHIFT, which will change how LY metrics are displayed in your analysis or dashboard.
Using Variables
Retail Insights makes use of variables to provide certain values such as the current business date. It is important to understand how to use variables in your analyses, as this is the primary way you can get results that change dynamically based on your business activities. You can reference several types of variable in your analyses, dash-boards, and actions: session, repository, presentation, request, and global. Content authors can define presentation, request, and global variables themselves but other types (session and repository) are defined for you and update automatically.
For more information about the types of variables available and how they are used in Oracle Analytics, start here:
https://docs.oracle.com/en/middleware/bi/analytics-server/user-oas/advanced-techniques-reference-stored-values-variables.html
In addition to the system variables defined by Oracle Analytics, Retail Insights provides the list of repository variables below.
Table 4-3 Repository Variables
| Variable Name | Description |
|---|---|
|
Today |
Returns today's calendar date |
|
Yesterday |
Fetches the previous date based on the sysdate |
|
LastYearDate |
Returns the last year date based on the current sysdate |
|
CurrentDate |
Returns the current Business Date in the system |
|
CurrentWeek |
Returns the current Fiscal Week value |
|
CurrentQuarter |
Returns the current Fiscal Quarter value |
|
YTD |
Returns the current Fiscal Year value |
|
LastWeek |
Returns the previous Fiscal Week value |
|
LastWeek2 |
Returns the Fiscal Week value of two weeks ago |
|
LastWeek3 |
Returns the Fiscal Week value of three weeks ago |
|
LastWeek4 |
Returns the Fiscal Week value of four weeks ago |
|
NextWeek |
Returns the next Fiscal Week value |
|
FromPeriod |
Fiscal Period value which is one year back from ToPeriod |
|
ToPeriod |
Fiscal Period value for the current period, can be used with FromPeriod to get a 13-month rolling window |
|
Last 30 days |
Returns all Fiscal Week names for the last 30 calendar days |
|
CurrentGregWeek |
Returns the current Gregorian Week value |
|
CurrentGregMonth |
Returns the current Gregorian Month value |
|
CurrentGregQuarter |
Returns the current Gregorian Quarter value |
|
CurrentGregHalfYear |
Returns the current Gregorian Half Year value |
|
CurrentGregYear |
Returns the current Gregorian Year value |
|
LastGregMonth |
Returns the previous Gregorian Month value |
|
LastGregQuarter |
Returns the previous Gregorian Quarter value |
|
LastGregYear |
Returns the previous Gregorian Year value |
|
LY_SHIFT |
Set the type of LY calendar mapping that is used in reporting |
|
PREFERRED_CURRENCY |
The type of currency conversion performed in reporting |
|
SET_ITEM_CNT_CLR_QTY |
Set the EOH Clr Qty threshold for the Inventory Position Item Count Clr measure |
|
SET_ITEM_CNT_NCLR_QTY |
Set the EOH Non-Clr Qty threshold for the Inventory Position Item Count Non-Clr measure |
|
SET_ITEM_CNT_QTY |
Set the EOH Qty threshold for the Inventory Position Item Count measure |
|
SET_LOC_CNT_NCLR_QTY |
Set the EOH Non-Clr Qty threshold for the Inventory Position Store Count Non-Clr measure |
|
SET_LOC_CNT_QTY |
Set the EOH Qty threshold for the Inventory Position Store Count measure |
|
Wholesale |
Channel ID representing wholesale activity in the merchandising system |
Variables are used primarily as filter values to make an analysis dynamic. In classic analyses and dashboards, you will have the option to change any filter or prompt to use a Repository Variable. When you select this option, a new text box appears, and you must enter a variable name from the list above into that field.
To use variables in Data Visualization, you must add expression filters to the individual tables or graph views using the steps below.
-
Create a table or graph in a DV workbook.
-
In the grammar panel, expand the Filters menu by clicking the down arrow and select the Add Expression Filter option.
-
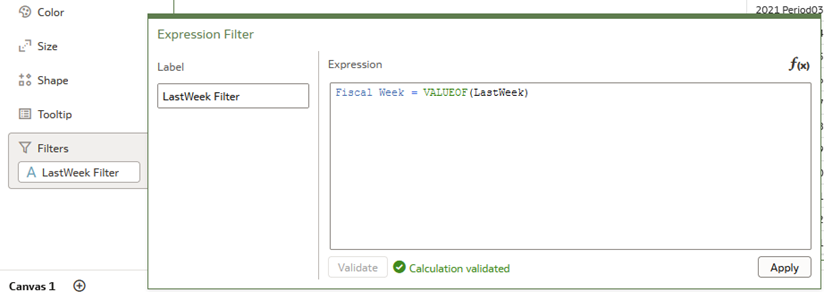
In the text box that appears, add your attribute that you will be filtering on, the operators needed, and the function VALUEOF(variablename) where the variable name is selected from the table above.
Figure 4-2 Expression Filter
-
Click Validate to check your statement for formatting issues and then click Apply. The specified variable filter will be applied to your current view.
When using calendar variables for filtering, they will supercede any calendar filters at the top of the workbook, so it is best to choose which method you are using for the entire workbook (either all tables will by dynamically filtered by calendar variables, or they will be prompted at the top of the workbook and users must select values). Other filters which are unrelated to the variables, like Product filters, can still be used at the top of the workbook and applied to all views uniformly.
Creating Reports for Sales Transactions
One of the most common uses of Retail Insights is reporting on your business's sales transactions. RI maintains a historical record of all sales transactions which occur both in your retail stores and in non-retail channels such as your web store and warehouses. It is therefore critical to understand the many ways in which RI presents sales data to the user, so that you can quickly and accurately report on the information that's relevant to you.
Types of Sales Metrics
RI broadly splits sales metrics into three basic types: Gross Sales, Net Sales, and Returns. Net Sales metrics are always calculated as (Gross - Returns) for a given quantity. Within each type, RI provides four basic measures of sales: Quantity, Retail Amount, Cost, and Profit. Examples of these basic metrics are provided in the table below.
Table 4-4 Sales Metrics
| Sample Metric | Explanation |
|---|---|
|
Gross Sales Qty |
Total sales units, not accounting for returns. |
|
Gross Profit |
Difference between the retail selling value and cost of goods sold, equivalent to Gross Margin $. |
|
Net Sales Amt |
Net retail sales amount, calculated as gross sales amount minus returns. |
|
Return Profit |
Difference between the retail amount of returns and the cost value of those returns. Represents the profit lost due to returned units. |
Adding these metrics to an analysis allows us to easily see how they relate to each other. For example, we can create an analysis with gross, net, and returned sales units and validate that net = gross - returns.
-
Start a new analysis in the Retail Insights As-Is subject area.
-
Locate the Sales folder in the left side panel of the Criteria tab and expand it.

-
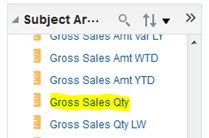
Scroll down until you locate the Gross Sales Qty metric, and double-click it to add it to the analysis.
-
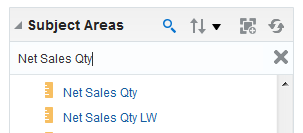
As you can see, there are quite a lot of sales metrics available. A quicker way to locate a metric is by using the Search box at the top of the metrics panel. Click the magnifying glass icon to access the Search panel.

-
Type Net Sales Qty into the search box and wait a few seconds for the search to complete. Scroll through the search results and double-click on the Net Sales Qty metric.
-
Repeat the previous step for the Return Qty metric. You should now have all three metrics in your Criteria.

-
Click on the Results tab to view the analysis. Note that net sales = gross - returns.

-
Repeat the steps for Sales Amt and Profit metrics if desired. It is important to note that "Qty", "Amt", and "Profit" are very common terms used throughout RI to represent these types of measures.
Dimensionality of Sales Metrics
All data in RI is represented by one or more dimensions, such as the Item or Organization dimensions. When we report on business data such as sales or inventory, we generally want to categorize it using these dimensions, however different types of data use different dimensions. It is important to understand which dimensions can be used with each set of measures in RI, as dimensions not supported by the data will not return results in your analysis. We refer to this as the "dimensionality" of the data.
For sales transactions, the available dimensions which can be used are shown below:
Table 4-5 Sales Transactions Dimensions
| Dimension Name | Example Attributes |
|---|---|
|
Item |
Department, Style, Brand |
|
Organization |
Region, Loc Number, Store Grade |
|
Fiscal Calendar |
Fiscal Year, Fiscal Week, Fiscal Date |
|
Supplier |
Supplier Num, Parent Supplier |
|
Retail Type |
Retail Type |
|
Customer |
Customer Number |
Not all dimensions will be available, depending on your business data and the way it is categorized in the source systems. The most commonly used dimensions are the Item, Organization, and Fiscal Calendar (a.k.a. Product/Location/Day levels).
-
From the Criteria tab of an analysis, first remove any existing metrics by clicking the "double X" icon to the far right of the screen.

-
Using the Search box in the Subject Areas panel, locate the Department, Region, and Fiscal Year attributes and add them to the analysis.

-
Now add one or more sales metrics, such as Gross Sales Qty, Gross Sales Amt, and Gross Profit.

-
Click on the Results tab to view the results.

-
Note that this returns quite a lot of data, so let's also add filters to it. Return to the Criteria tab, click on the "gear" icon next to Fiscal Year, and set a filter of 2017. Repeat the process for Department and Region to add the filters to your analysis.
-
Now click on the Results tab to view the changes to your analysis.
Transaction Types
RI also separates sales into different groups based on the type of sales transaction that was recorded at the point of sale, or by the auditing and merchandising systems. These transaction types are listed below, along with the abbreviations commonly used in RI to represent them.
Table 4-6 Transaction Types
| Transaction Type | Metric Abbreviations Used | Also Known As |
|---|---|---|
|
Regular |
Reg, R |
Full Price, Non-Clearance |
|
Promotional |
Pro, P |
|
|
Clearance |
Clr, C |
Markdown |
Net sales metrics in RI are further divided by the three main types of sales transactions (Reg, Pro, Clr). For example, it is possible to report only on Net Reg Sales Qty or Net Clr Profit. If a metric is not explicitly provided, then you may also use the Retail Type dimension to report on all sales metrics by their type, as shown below.

What this data represents may vary depending on your business practices. For example, promotional sales could represent sales from coupons, one-off discounts, loyalty award redemptions, or web-only events. Regular sales are typically any item sold at full price and not under promotion or clearance, while clearance sales are only for items sold on clearance.
Calendar Transformations
Sales metrics are further aggregated across various periods of time that are commonly used in business reporting. In order to perform side-by-side reporting of data using different time periods, it is necessary to use the specific metric for those periods. The metrics will generally be named using the abbreviations in the following table.
Table 4-7 Calendar Transformation Sales Metrics
| Abbreviation | Description |
|---|---|
|
(no abbreviation) |
Base metric (all time) |
|
LW |
Last week |
|
WTD |
Week to date |
|
MTD |
Month to date |
|
QTD |
Quarter to date |
|
HTD |
Half year to date |
|
YTD |
Year to date |
|
LY |
Last year |
|
LY LW |
Last week last year |
|
LY WTD |
Week to date last year |
|
LY MTD |
Month to date last year |
|
LY QTD |
Quarter to date last year |
|
LY HTD |
Half year to date last year |
|
LY YTD |
Year to date last year |
Time transformation metrics also require a point of reference to calculate against, such as a fiscal date. This reference point can be provided either as an attribute in the analysis (e.g. report on department sales by month, using WTD and MTD metrics), or as a filter on the analysis (report on department sales filtered to fiscal year 2017, and use QTD, HTD, and YTD metrics).
-
Using the department/region/year sales report we setup in the previous section, search for the metrics listed below and add them to your analysis.
-
Gross Sales Qty WTD
-
Gross Sales Qty MTD
-
Gross Sales Qty YTD
-
-
Click on the Results tab. Notice how only the YTD metric is returning data. This is because we currently have only the Fiscal Year specified as part of the analysis, so the other time transformation metrics have no point of reference.

-
Return to the Criteria tab, and click the "create a filter" icon
 on the far right of the Filters panel, and then select More Columns.

-
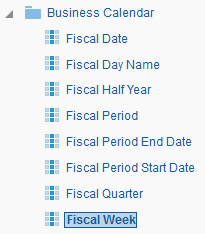
Locate and expand the Fiscal Calendar folder, and select the Fiscal Week attribute.
-
In the filter setup window, enter a value of 2017WEEK10 and click OK.

-
Click on the Results tab. Notice how your time transformation metrics have now been populated with values. This data is linked to the fiscal week you specified in your filter condition.

-
In order to see time transformations across more than one period, you must include a lower level calendar attribute in the analysis. Return to the Criteria tab and remove the filter on Fiscal Week. Then locate the Fiscal Week attribute in the Fiscal Calendar folder, and drag and drop it into your analysis.

-
Click on the Results tab. Note how the report shows many weeks of data, and your time transformations vary depending on the row.

Non-Merchandise Sales
The sales transaction metrics described so far are specifically for reporting on the sale of merchandise, such as the physical products held in your retail locations. Non-merchandise sales may not be captured as part of this data, depending on how your merchandising system is configured.
One example of non-merchandise sales which are not available in the sales transaction metrics are Gift Card sales. If you need to report against the sales of gift cards, a separate set of metrics are provided in the Gift Card Sales folder. The gift card sales metrics can be used at a level of Location and Fiscal Date, allowing you to see the total amount of gift cards sold by store/day.

Other Useful Sales Metrics
RI contains many calculated sales metrics in addition to the basic performance measures. Some commonly used calculations are listed below with their associated metric in RI.
Table 4-8 Calculated Sales Metrics
| Calculated Value | Related RI Metric Name |
|---|---|
|
Gross Margin % |
Gross Profit to Sales Amt |
|
Net Margin % |
Net Profit to Sales Amt |
|
AUR |
Avg Net Retail |
|
Employee Discounts |
Net Emp Disc |
|
Transaction Count |
Trx Count |
Creating Reports for Inventory Positions
Retail Insights holds stock position at a very low level, which is the ending position for every day for every item at every stockholding location. RI maintains a large variety of inventory metrics which span the entire lifecycle of your merchandise (from the initial order to in-transit, on-hand, RTV, and several others).
Types of Inventory Metrics
The stock position measures include quantity, retail value, and cost amount (usually interfaced from source systems based on weighted average cost calculation). There are three distinct groupings of stock position in Retail Insights:
-
On-hand stock (goods owned by the retailer and received in a location)
-
In-transit stock (goods owned by the retailer, received into one location such as a distribution center, but currently in transit to another store or warehouse)
-
On-order stock (goods on an approved Purchase Order which have not yet been received)
Two examples of on-hand measures are ending on-hand (EOH) for a time period, as well as beginning on-hand (BOH) for a time period. The EOH position for week 1 is the BOH position for week 2. On Order positions are tracked only at the end-of-period level, as the primary reporting method for those values is to show the current position at a given point in time.
Metrics pertaining to owned inventory (such as on-hand and in-transit) are further broken down by their clearance status. RI use the nomenclature "Clr" and "Non-Clr" to represent inventory that is either on clearance or at regular price.
Combining these metrics in an analysis will allow us to comprehensively track the position of our inventory over time.
-
Start a new analysis in the Retail Insights As-Is subject area.
-
Locate the Inventory Position folder in the left side panel of the Criteria tab and expand it.

-
Using the Search box, find and add the following metrics and attributes to the analysis:
Fiscal Week, BOH Qty, EOH Qty, In Transit Qty, On Order Qty
-
Note how BOH and EOH Qty match their positions over time, but the others are just a single positional value.

-
Now search for and add the metrics EOH Clr Qty and In Transit Clr Qty. Note that they are a subset of the total quantities shown in the base metrics, as they represent only merchandise which is in clearance status.

Dimensionality of Inventory Metrics
For inventory position, the available dimensions which can be used are shown below:
Table 4-9 Dimensionality of Inventory Metrics
| Dimension Name | Example Attributes |
|---|---|
|
Item |
Department, Style, Brand |
|
Organization |
Region, Loc Number, Store Grade |
|
Fiscal Calendar |
Fiscal Year, Fiscal Week, Fiscal Date |
|
Supplier |
Supplier Num, Parent Supplier |
|
Retail Type |
Retail Type |
-
From the Criteria tab of an analysis, first remove any existing metrics by clicking the "remove all columns" icon to the far right of the screen.

-
Using the Search box in the Subject Areas panel, locate the Loc and Fiscal Period attributes and add them to the analysis.

-
Now add one or more inventory metrics, such as EOH Cost, In Transit Retail, and On Order Qty.

-
Click on the Results tab to view the results.

-
Note that this returns quite a lot of data, so let's also add filters to it. Return to the Criteria tab, click on the "gear" icon next to Fiscal Period, and add a LIKE filter which gets any periods in 2017. In RI, the percent symbol (%) is used in pattern matching to mean "any character".

-
Now click on the Results tab to view the changes to your analysis.

-
While still in the Results, find the Supplier folder and add the Supplier attribute to the report, by dragging it after the Loc attribute.

Calendar Transformations
Inventory metrics are further aggregated across certain periods of time that are commonly used in business reporting. In order to perform side-by-side reporting of data using different time periods, it is necessary to use the specific metric for those periods. The metrics will generally be named using the abbreviations in the following table.
Table 4-10 Calendar Transformations - Inventory Metrics
| Abbreviation | Description |
|---|---|
|
(no abbreviation) |
Base metric (any time) |
|
LW |
Last week |
|
LY |
Last year |
|
VAR LW |
Variance this week/last week |
|
VAR LY |
Variance this year/last year |
Because inventory is positional, the behavior of time transformations is somewhat different from sales metrics. When reporting on EOH Qty by itself, you will always get the ending on-hand position relative to the time period in your analysis. Adding EOH Qty LY to the analysis will get the ending on-hand position for the same time period last year. Positional metrics cannot be added together over time, so you will not see transformations such as MTD or YTD.
Time transformation metrics usually require a point of reference to calculate against, such as a fiscal date. This reference point can be provided either as an attribute in the analysis (e.g. report on department inventory by month, using EOH and BOH metrics), or as a filter on the analysis (e.g. report on department inventory filtered to fiscal year 2017, and use EOH, EOH LY, and EOH Var LY metrics).
The exception to this rule is Current metrics. Current inventory metrics (such as Current EOH Qty) must NOT have a calendar attribute, as they are programmed to always return the most recent position of that inventory quantity, regardless of time. For example, if you simply want to know the current position of inventory for items at a location, and you don't want the report tied to any particular period of time, then it is best to use Current metrics.
In order to practice with inventory metrics using time transformations, we can create a report which looks at inventory position for a week in 2017, and compares it to last week and last year.
-
From the Criteria tab of an analysis, first remove any existing metrics by clicking the "remove all columns" icon to the far right of the screen. Do the same for the filters.

-
Using the Search box in the Subject Areas panel, locate the Department and Loc attributes and add them to the analysis.

-
Now add all of the time transformation metrics for an inventory position measure of your choice, such as EOH Cost.

-
Add a filter to specify a period of time to report against. Click the "add filter" icon, and go to More Columns. Locate the Fiscal Week attribute, and enter a value of 2017WEEK13. Click OK to save it.

-
Click on the Results tab to view your analysis.

Inventory Receipts
In some cases, it is necessary to report on inventory receipts separately from the positional status of inventory. For this purpose, RI has a separate set of metrics specifically for receipts. These metrics are NOT positional, and as such can be used in the same way as sales metrics to get sums and averages over time. For example, an analysis by Department and Fiscal Period will show the total receipts which occurred for each department/month combination.
Receipts are further split by type, as described below:
Table 4-11 Inventory Receipt Types
| Receipt Type | Description |
|---|---|
|
Allocation |
Receipts at a location due to an allocation |
|
PO |
Receipts at a location due to a purchase order |
|
Transfer |
Receipts at a location due to a non-allocation transfer |
Unavailable Inventory
The metrics in the Inventory Position folder generally represent total inventory, such as the total owned inventory at a location, or the total amount on order. In order to report on inventory at a location that has a non-sellable status, you must use the Inventory Unavailable folder of metrics.
Unavailable inventory metrics use a similar format and nomenclature as the inventory position (EOH, BOH, Clr and Non-Clr), and can be combined with Inventory Position in an analysis to get a better sense of sellable vs. non-sellable inventory. It is also possible to calculate the "available" inventory by subtracting an unavailable measure from the same-named total value (e.g. Available EOH Qty = EOH Qty - Unavailable EOH Qty).
Returns to Vendor
RTV units are units returned to the vendor for any reason (overstock, poor quality, etc.). Return to vendor analysis gives the retailer valuable insights for evaluating vendor performance. RI maintains a record of RTV units and the value of RTV units in cost and retail amount. RTV facts are held at the item/supplier/location/day/return-reason level.

Building Dashboards
Dashboards in Analytics Classic are the recommended way to publish information to a large audience in Retail Insights. Dashboards allow you to curate a set of analyses to inform your users about specific insights and KPIs, as well as give them the ability to explore that data using prompts.
Dashboards in RI are created within the /shared/Custom/ folder or a sub-folder beneath that, so that the reports can be made available to all users and not just the content author. This is the only folder in the Catalog reserved for you to add custom content (outside of your personal folder). Dashboards can have permissions as-signed to allow only certain users or groups to access it, if required. Dashboards may have one or many analyses, as well as other content like embedded DV projects or links to other pages.
To learn more about creating and viewing dashboards in Oracle Analytics Classic, start here:
https://docs.oracle.com/en/middleware/bi/analytics-server/user-oas/build-dashboards.html
Managing Content in Retail Insights
All user-created content in Retail Insights is stored within the Oracle Analytics Catalog. There are only two areas designated for user-created content:
-
Personal user objects should be saved in My Folders. These objects cannot be accessed by anyone except the user. Administrators do not have access to other users' personal folders. Every user automatically has a personal folder created for them when they first log into the system.
-
Shared objects should be saved in the Custom folder in the Shared Folders root directory. These objects are visible to all users, except where administrators have restricted the permissions. Do not create shared content outside of the Custom folder.
All objects created in the shared Custom folder are meant to be centrally managed by a customer administrator or BI team lead. Objects should be organized by functional group or business process, and have permissions assigned at the folder level to restrict access to specific roles or groups. Both folders and individual objects can have permissions assigned to limit the ability to view, modify, or execute them.
To learn more about managing content in Oracle Analytics, start here:
https://docs.oracle.com/en/middleware/bi/analytics-server/user-oas/manage-content.html
Sharing Content in Retail Insights
Retail Insights uses the native capabilities of Oracle Analytics Server to publish and share content. Use one of the following methods to share content with other users:
-
Create agents to deliver content to users by email or to their Home page in RI
-
Create content in the shared Custom folder and set the permissions to share it with other users
-
Create BI Publisher reports with a bursting query to send files to SFTP or email
To learn more about sharing content in Oracle Analytics, start here:
https://docs.oracle.com/en/middleware/bi/analytics-server/user-oas/automate-business-processes-using-agents.html
Visualizing Data
Retail Insights uses Data Visualizer (DV) as a tool to create custom datasets, advanced visualizations, and embedded content for other applications. DV is included as a component of Oracle Analytics Server and comes with all RI and AI Foundation environments, regardless of which services you own. When using DV with Retail Insights, the primary data sources you will work with are the RI subject areas. You also have the ability to import Microsoft Excel spreadsheets and join the files to RI data elements within the same project. You may also use DV to expose data from Innovation Workbench or the RI database directly.
To learn more about visualizing data in Oracle Analytics, start here:
https://docs.oracle.com/en/middleware/bi/analytics-server/user-oas/visualize-and-analyze-data.html
Known Issues and Common Questions
The following are additional considerations and suggestions for designing Oracle Retail Insights reports.
-
Stock ledger reports cannot be created below subclass and week, because data for these fact areas have the lowest levels of subclass and week from the source systems.
-
Comp and BOH (beginning on-hand) inventory metrics are only supported at week level. You must also use a prompt or filter on week or a higher level of the time dimension.
-
When reporting on any time transformation metrics like YTD, you must have a prompt or filter on the fiscal calendar, typically for one specific day or week.
-
To compare as-is and as-was results for the same report, create a single dashboard with these reports on different pages. The same report cannot include both as-is and as-was results.
-
Wherever there are many-to-many relationships, you must have prompts or filters on one value to avoid double-counting. For example, there can be overlapping seasons, and the same items can belong to both seasons. If there is no filter or prompt on season, the items common to both seasons can be double-counted. Another example of this is an item list, where the same item can be in multiple item lists. A filter or prompt on item list will ensure that correct data is displayed.
-
Retail Insights does not store attribute groups that do not have associated values. For example, Retail Insights will not consume location lists that do not have any associated locations. It will not show item UDAs that are not linked to any items.
-
Customer Order Demand cannot be analyzed by the Fulfillment Channel.
-
Order Fulfillment cannot be analyzed by the Demand Channel.
-
Demand and Fulfillment analysis is not supported by Season Dimension.
-
Market Item and Retail Item side-by-side analysis is not supported.
-
Season Based reporting is not supported for Market Item and Consumer Reports.
-
Market Item reporting is only supported for the As-Is Subject area.
-
Users should not drill from Customer Segment to Customer, even though this drill path has been enabled in Oracle Analytics. Drilling may cause performance issues if the proper aggregates have not been created for Customer attributes.
-
When combining data from multiple facts which make use of different dimensions (for example, Inventory Position and Purchase Orders), go into the Advanced tab of the analysis and select the checkbox for Show Total value for all measures on unrelated dimensions. This is required to see results when a dimension is not present on some facts, such as viewing EOH Qty with Purchase Order Number and PO Ordered Qty.