3 Predefined Retail Insights Reports
Retail Home Dashboards
Retail Insights provides a set of pre-built sample tiles and dashboard layouts for Retail Home in order to get a new user started with RI/Retail Home integration. The sample tiles include tile states, filters, layouts, and embedded DV content for a variety of common reporting areas such as sales, inventory, and purchase orders. To import this content into your Retail Home environment, you must go to the Application Navigator Setup, select the RI application row in the table, and click Refresh Seed Data. The application name in the table must be “Retail Insights” as the seed data is linked to that name only. If the application name was changed, then the import process will fail.
Table 3-1 Retail Home Dashboards
| Dashboard Role | Summary |
|---|---|
|
INVENTORY_ANALYST_JOB |
Dashboard for a user group that primarily cares about inventory levels and movement of stock. |
|
IT_BUSINESS_ANALYST_JOB |
Dashboard for a user group that wants a broad overview of the current state of their business so they can drill in to focus on different areas needing analysis. |
|
LOYALTY_MANAGER_JOB |
Dashboard for a user group focused on customer activity, such as loyalty programs and promotions. |
|
PRICING_ANALYST_JOB |
Dashboard for a user group that cares mainly about the retail value of goods sold relative to costs across the different price points like promotions and clearances. |
Inventory Analyst Dashboard
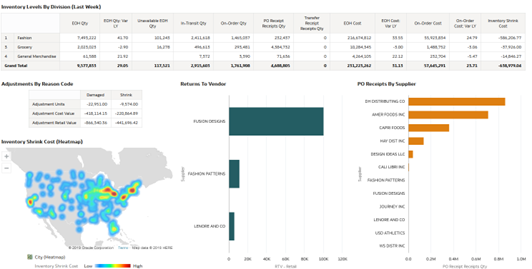
This dashboard highlights some key reporting areas that may be of interest to an inventory analyst user group. It displays data from Retail Insights in the areas of: inventory on-hand and on-order, inventory comparisons to plan, returns to vendor, recent stock count adjustments, and unavailable inventory levels. The Inventory Movement tile expands to a DV project which provides deeper analysis of inventory levels and movement.
Figure 3-1 Inventory Analyst Dashboard

This dashboard includes links to the following DV workbooks which allows users to drill into more details on their business data:
-
Inventory Analysis
The Inventory Analysis dashboard shows more details around the retailer’s current stock on hand and inventory movement transactions such as receipts and adjustments, giving you visibility into your stock levels and movement year over year.
Figure 3-2 Inventory Analysis Dashboard
IT Business Analyst Dashboard
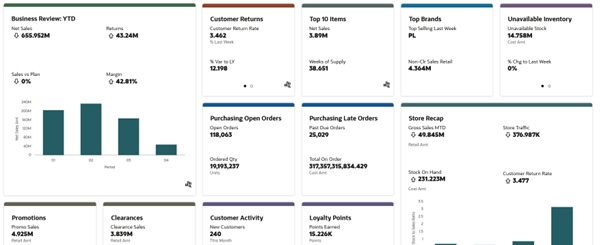
This dashboard provides an overview of many different reporting areas in Retail Insights, with the goal of giving a business analyst a quick snapshot of the current state of the business. Using the many different tiles on sales, inventory, POs, and other areas, the analysis can click through to additional reports to dig into problem areas as needed. The Business Review tile expands to a DV project that reports on sales performance across the business, while the Store Recap tile expands to a more store-centric view of sales.
Figure 3-3 IT Business Analyst Dashboard
This dashboard includes links to the following DV workbooks which allows users to drill into more details on their business data:
-
Category Performance
-
Returns Analysis
-
Top Bottom 10
-
Active Promotions
-
Stores Overview
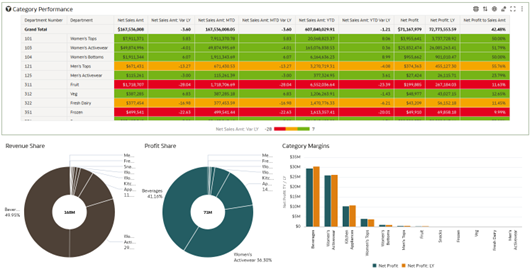
The Category Performance dashboard shows various sales metrics to help you understand which departments are performing well compared to last year across standard measures such as revenue and profit margin.
Figure 3-4 Category Performance Dashboard
The Returns Analysis dashboard shows return transaction metrics to identify which locations and categories are getting the most returned items from customers.
Figure 3-5 Returns Analysis Dashboard
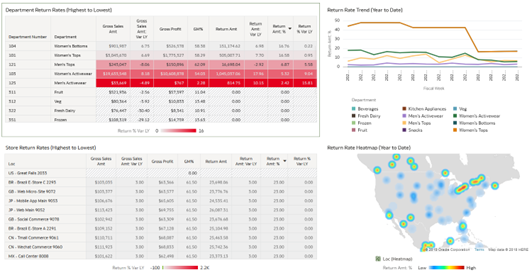
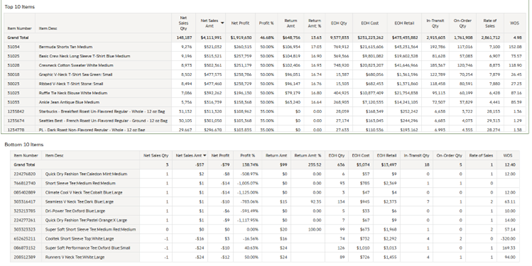
Figure 3-6 Top Bottom 10 Dashboard
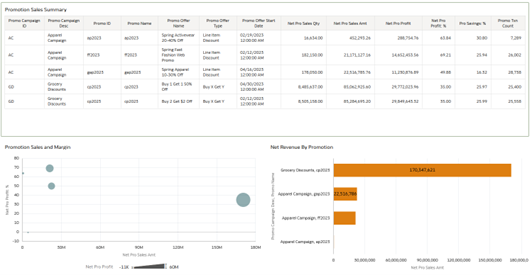
The Active Promotions dashboard shows all of your ongoing promotions and the associated sales transactions that had the promotions applied to them.
Figure 3-7 Active Promotions Dashboard
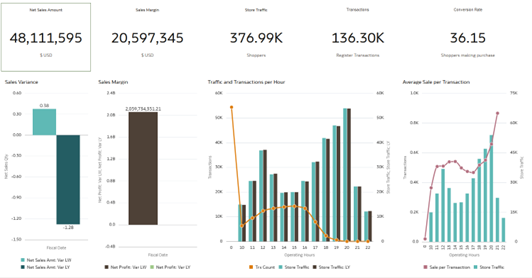
The Stores Overview dashboard provides store-level performance indicators such as store traffic and transaction counts and can be filtered to a specific location to see how that store is performing over a period of time. Additional tabs in the dashboard provide views into a location’s sales and inventory data.
Figure 3-8 Stores Overview Dashboard
Loyalty Manager Dashboard
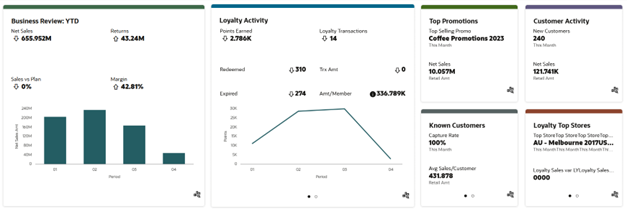
This dashboard provides a customer-centric view of data in Retail Insights for a user group that is interested in customer activity like loyalty point usage and promotion redemption. KPIs like New Customer counts and Capture Rate may be an important part of the retailer’s strategy when it comes to attracting and retaining customers. Like the other dashboards, this view also includes the sales performance tile so all user groups have a common frame of reference for how the business is performing.
Figure 3-9 Loyalty Manager Dashboard
This dashboard includes links to the following DV workbooks which allows users to drill into more details on their business data:
-
Category Performance
-
Loyalty Points Analysis
-
Active Promotions
-
New Customers
-
Top 100 Customers
-
Loyalty Top Stores
-
Weekly Trends Online
-
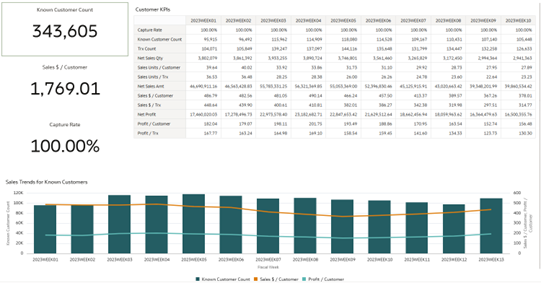
Customer KPIs
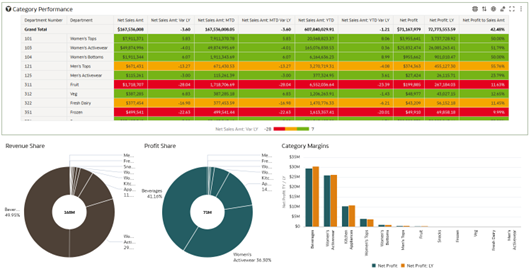
The Category Performance dashboard shows high-level sales metrics to help you understand which departments are performing well compared to last year across standard measures such as revenue and profit margin.
Figure 3-10 Category Performance Dashboard
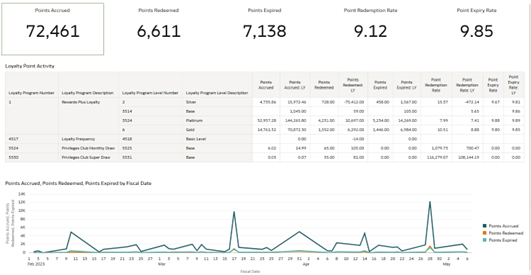
The Loyalty Points Analysis dashboard shows return transaction metrics to identify which locations and categories are getting the most returned items from customers.
Figure 3-11 Loyalty Points Dashboard
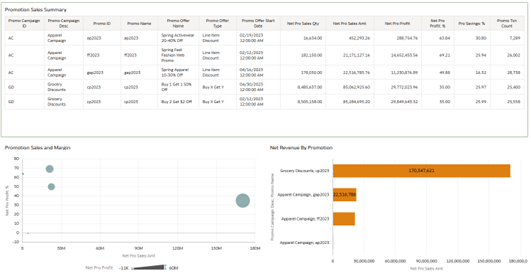
The Active Promotions dashboard shows all of your ongoing promotions and the associated sales transactions that had the promotions applied to them.
Figure 3-12 Active Promotions Dashboard
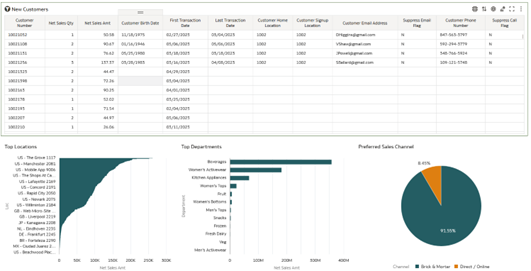
The New Customers dashboard shows customers that purchased from you for the first time along with any information you have on those customer transactions such as what they are buying and where they are shopping.
Figure 3-13 New Customers Dashboard
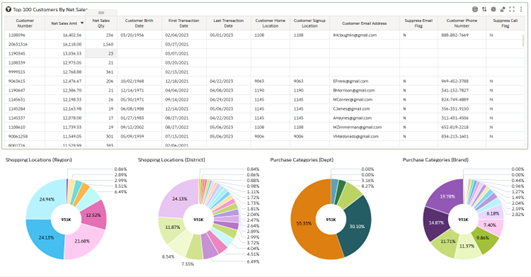
The Top 100 Customers dashboard shows your best customers based on total sales along with metrics to identify their preferred products and locations.
Figure 3-14 Top 100 Customers Dashboard
The Loyalty Top Stores dashboard shows how your stores are performing based on loyalty point program activity such as points accrued by customers at those stores.
Figure 3-15 Loyalty Top Stores Dashboard
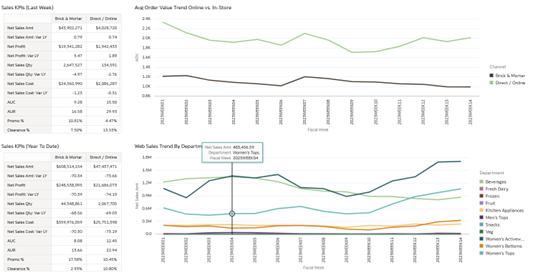
The Weekly Trends Online dashboard shows a comparison of sales metrics between channels with a focus on web stores versus brick & mortar stores.
Figure 3-16 Weekly Trends Online Dashboard
Pricing Analyst Dashboard
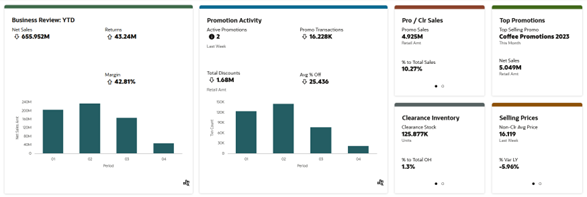
This dashboard includes metrics on the retail price of goods across different price points, which is important for pricing analysts to understand as they plan for future pricing strategies and set price points for promotional and clearance activities. Analysts may want to see promotional pricing KPIs such as the average discount percent customers are getting, or the ratio of promotional sales to total sales, when determining future promotion pricing. They can see how much clearance inventory they currently have on hand, which is useful for deciding when to apply deeper markdowns to clear out more stock.
Figure 3-17 Pricing Analyst Dashboard
This dashboard includes links to the following DV workbooks which allows users to drill into more details on their business data:
-
Category Performance
-
Active Promotions
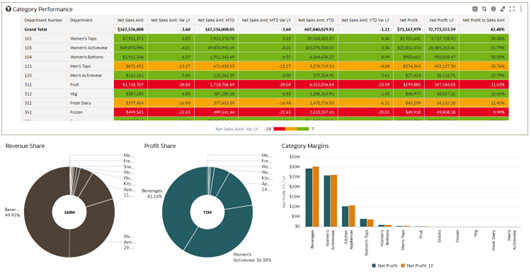
The Category Performance dashboard shows high-level sales metrics to help you understand which departments are performing well compared to last year across standard measures such as revenue and profit margin.
Figure 3-18 Category Performance Dashboard
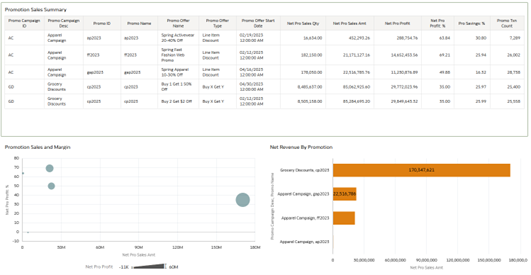
The Active Promotions dashboard shows all of your ongoing promotions and the associated sales transactions that had the promotions applied to them.
Figure 3-19 Active Promotions Dashboard
Retail Home Templates
RI includes several catalog objects intended to support integration with Retail Home. These objects can be located in the Shared Folders > Retail Home folder in the catalog. Only full RI subscribers may use the dashboard tile templates and filter objects as they require use of Analytics Classic. All customers of any RAP solution may use the DV workbooks for any purpose, if the workbook includes metrics available to your RAP solution (for example, the Category Performance DV workbook uses sales and inventory measures which are available to all RAP customers).
The sample objects include:
-
Dashboard Tiles – these analyses are provided to demonstrate the various BI tile formats used in Retail Home, and they also feed into the sample dashboard layouts.
-
Filters – these pre-defined filter objects can be added to RI analyses that are going to be linked to Retail Home tiles. Setting up filters for RH tiles requires that the RI analysis have an associated filter on it, otherwise the analysis will not refresh when filter values are changed.
-
LOVs – these pre-defined filter datasources are provided to enable Retail Home filtering on many different dimensions in RI. You have to specify a datasource in Retail Home filters for it to populate the list-of-values. The LOV in RH and the filter on the RI analysis must have matching values.
-
Projects – these DV workbooks are used in the sample Retail Home dashboards, but you are free to copy and repurpose them for your own dashboards and reporting, both in Retail Home and elsewhere.
For more information on creating RI analyses for Retail Home, refer to the Custom Tile State Reports Configuration chapter of the Oracle Retail Home Administration Guide.