Forecast Overview
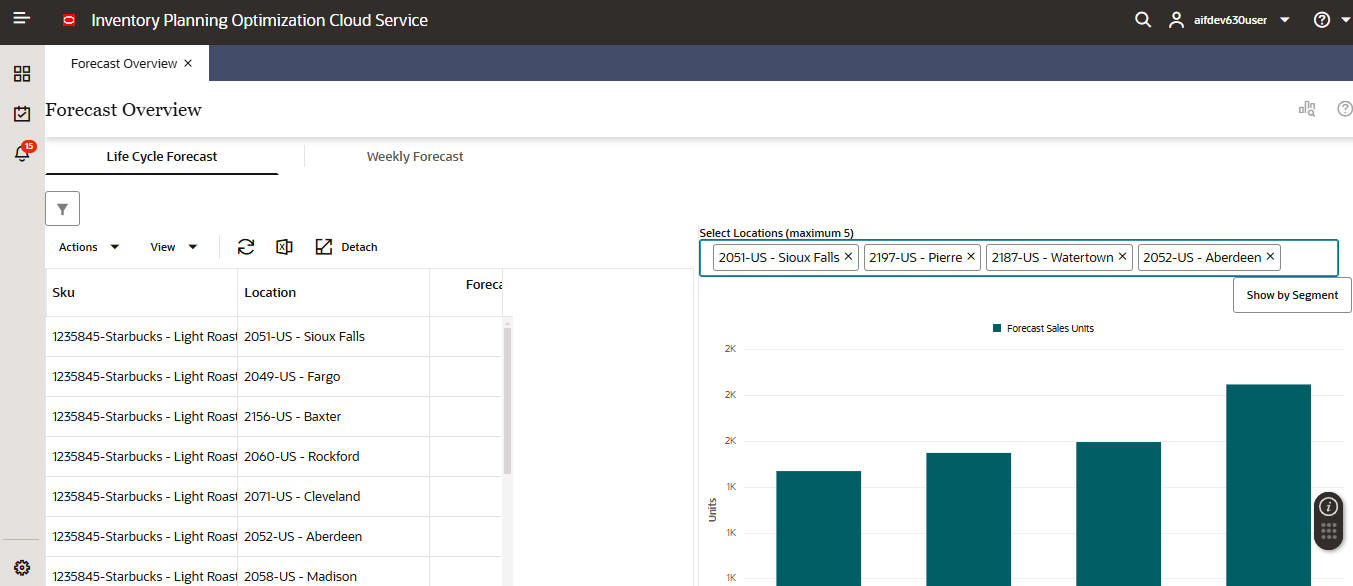
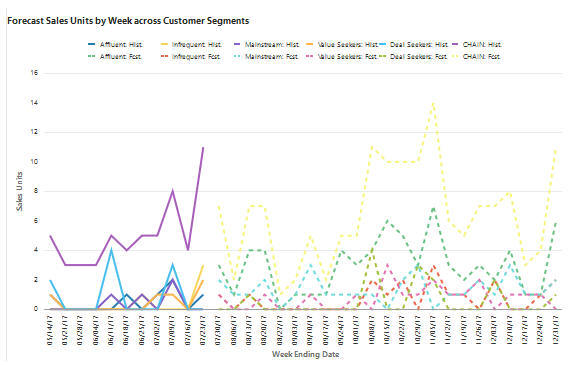
Users can see forecast and historical sales at the sku-store-customer segment level and historical and forecast rate of returns at sku-store level. These metrics can be viewed at the week level or for the life cycle, which are represented by separate tabs.
LifeCycle Forecast Tab
The following columns are displayed in the Life Cycle Forecast tab. For a description of many of these columns, see Glossary of Inventory Optimization Terms
-
SKU
-
Location
-
Forecast Sales Units
-
Forecast Sales Amount
Weekly Forecast Tab
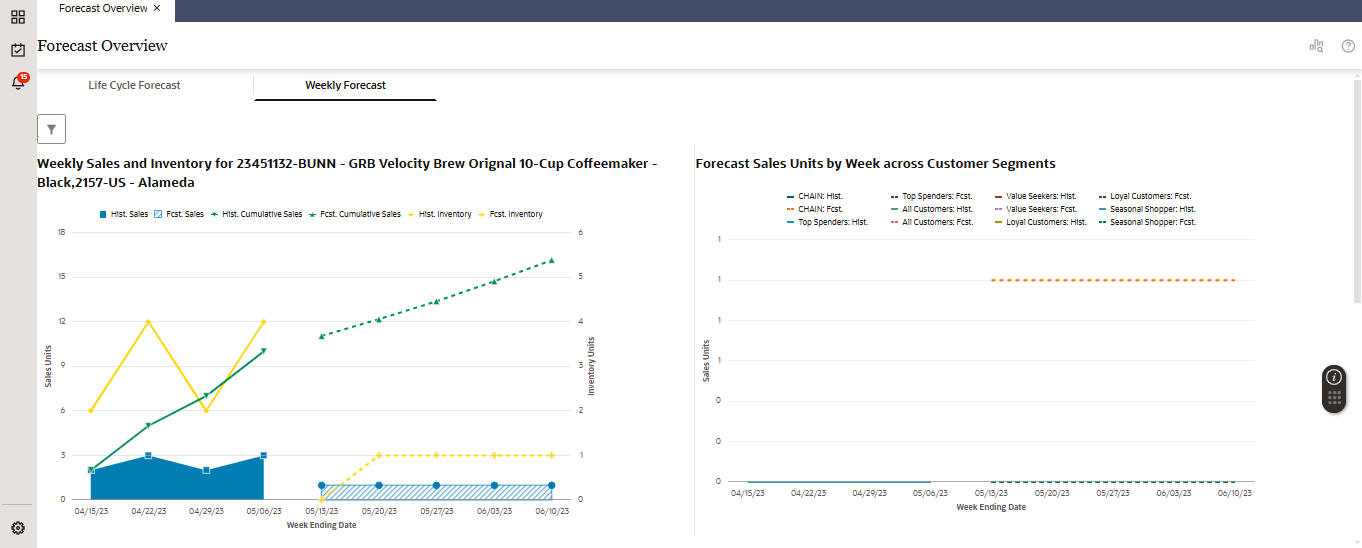
Figure 1-33 Weekly Sales and Inventory Chart

Description of "Figure 1-33 Weekly Sales and Inventory Chart"
The following columns are displayed in the Weekly Sales and Inventory tab. For a description of many of these columns, see Glossary of Inventory Optimization Terms
-
Weekly Sales Data
-
Historic Sales
-
Historic Inventory
-
Forecast Inventory


