5 Markdown/Promotion
This chapter describes the Markdown/Promotion functionality.
What-If Run - Introduction
A what-if run allows the user to simulate and analyze the impact of different pricing strategies or business rule changes without affecting the live production data. It is used to evaluate potential outcomes and make informed decisions before finalizing the actual optimization run.
To create a what-if run for markdown/promotion, the pricing analyst must first ensure the Markdown/Promotion tab is selected from the Run Overview page. On clicking the Create icon from the Run Overview table, the system opens the Run Overview tab, where the user can define the scope, select the applicable strategy, and configure business rules tailored to the scenario being tested. Before creating the run, it is essential to complete any required forecast configuration steps to ensure accurate demand estimation and enable valid optimization outcomes.
Prerequisite - Forecast Configuration
The Forecast Configuration is the prerequisite step before setting up a Lifecycle Price Optimization run, as the forecasting analyzes and mines historical data (along with other data sources) using machine learning algorithms for developing a predictive model to provide the forecasting inputs to the LPO’s Optimization Algorithm.
Later, the Optimization Algorithm obtains inputs such as scope, objectives, budgets, and business rules from the LPO Run in the UI, along with optimization parameters from AIF and the data warehouse. The algorithm analyzes the feasible price paths efficiently and generates price recommendations. These recommendations can be viewed in the LPO Manage Recommendation screen and can be exported to the price execution systems such as Oracle Retail Price Management (ORPM) or Customer Engagement (CE).
Figure 5-1 AIF - Forecast Configuration

For further details, see the Lifecycle Processing Optimization chapter and Control and Tactical Center chapter in the Oracle Retail AI Foundation Cloud Service Implementation Guide.
Markdown/Promotion - Scope
The Scope stage is used to define the scope of the optimization where the pricing analyst can select a season, merchandise (for example, Department), location (for example, Region), or prize zone effective week and strategy for the run. This stage is divided into three key sections: Scope, Objectives and Budget, and Review Information. Click the Save button to apply updates to the Name, Description, and any changes made within the Objectives and Budget section. Upon saving, the Review Information panel is populated, offering insights into inventory and item count contributions, based on the defined product processing level.
Figure 5-2 Markdown/Promotion Optimization - Run Scope

Table 5-1 Markdown/Promotion - Run Scope
| Field | Description |
|---|---|
|
Run Name |
The name identifying the run. The name must be 80 characters or less and use alphanumeric characters only. It is case sensitive. |
|
Run Description |
A brief description of the run. The value must be 200 characters or less and use alphanumeric characters only. |
|
Season |
You can choose from the drop-down list of seasons available for the run. |
|
Product Hierarchy (Merchandise) |
You can choose from the drop-down list of merchandise available for the run. |
|
Location Hierarchy (Region) |
You can choose from the drop-down list of locations available for the run, based on PRO_LOC_HIER_PROCESSING_LVL. |
|
Effective Week |
You can choose from the drop-down list of effective weeks available for the run. Effective weeks in the past compared to the last pull of sales data (whenever the batch process was successfully executed) are not displayed. |
| Price Zone | You can choose from the drop-down list of available price zones for the run. Available set of price zones will be decided based on the forecast run type mapped to the Lifecycle Pricing - Promotion/Markdown application or Lifecycle Pricing - Regular application, respectively. |
|
Strategy |
You can choose from the drop-down list of strategies available. You can define the set of business rules and associate the set with a strategy (for example, Christmas Specials). By default, there is always a strategy named DEFAULT_SET. In case of regular pricing optimization runs, you have the option to create a new strategy by clicking the + icon. |
Scope - Multi-Run Request
Multiple what-if runs can be submitted to test new strategies or explore different business rule scenarios. This is done by selecting a configuration above the run setup level, which generates multiple runs that appear in the Multi-Run Request screen. These runs are queued for execution in the daily batch and will later be listed in the Run Overview table. You can review or delete any pending requests from this screen before they are processed. The Multi-Run Request screen also includes filter tiles that help narrow down the Request Summary table based on request status.
Figure 5-3 Multi-Run Request Defining the Scope (For Example, Women’s Clothing Group)
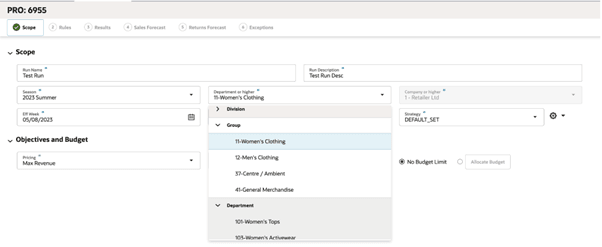
Figure 5-4 Multi-Run Request Confirmation Message

Figure 5-5 Multi-Run Request for Four Departments Under Women’s Clothing Group

Scope - Objectives and Budget
Figure 5-6 Markdown/Promotion - Optimization Run - Objectives and Budget

Table 5-2 Markdown/Promotion - Optimization Run - Objectives and Budget
| Field | Description |
|---|---|
|
Pricing Objective |
You can choose between Max Revenue, Max GM Amount, Max Revenue with Salvage, and Max GM Amount with Salvage from the drop-down list of values. You can set the default pricing objective using the strategy interface. |
|
Targeted Offers Objective |
Supports only Maximize Redemption Rate. |
|
No Budget Limit |
Indicates no budget limit for promotions and markdowns for the run. |
|
Allocate Budget |
Use the radio button before this button to toggle to put a limit on the budget for the run. When you click this button, it brings up a pop-up that you can use to specify allocation mechanism and budget limit for promotions and markdowns. |
From the above figure, you can select and click Allocate Budget to access the utility that you can use to allocate the run's product setup level (for example, department-level) budget to the run's product processing level (for example, classes). The run's product setup and processing level are configured using these two flags, PRO_PROD_HIER_RUN_SETUP_LVL and PRO_PROD_HIER_PROCESSING_LVL, respectively. You can choose to enter the budget available either through the UI or send, using the budget interface regularly.
Figure 5-7 Markdown/Promotion Optimization Run - Objectives and Budget - Budget Allocation
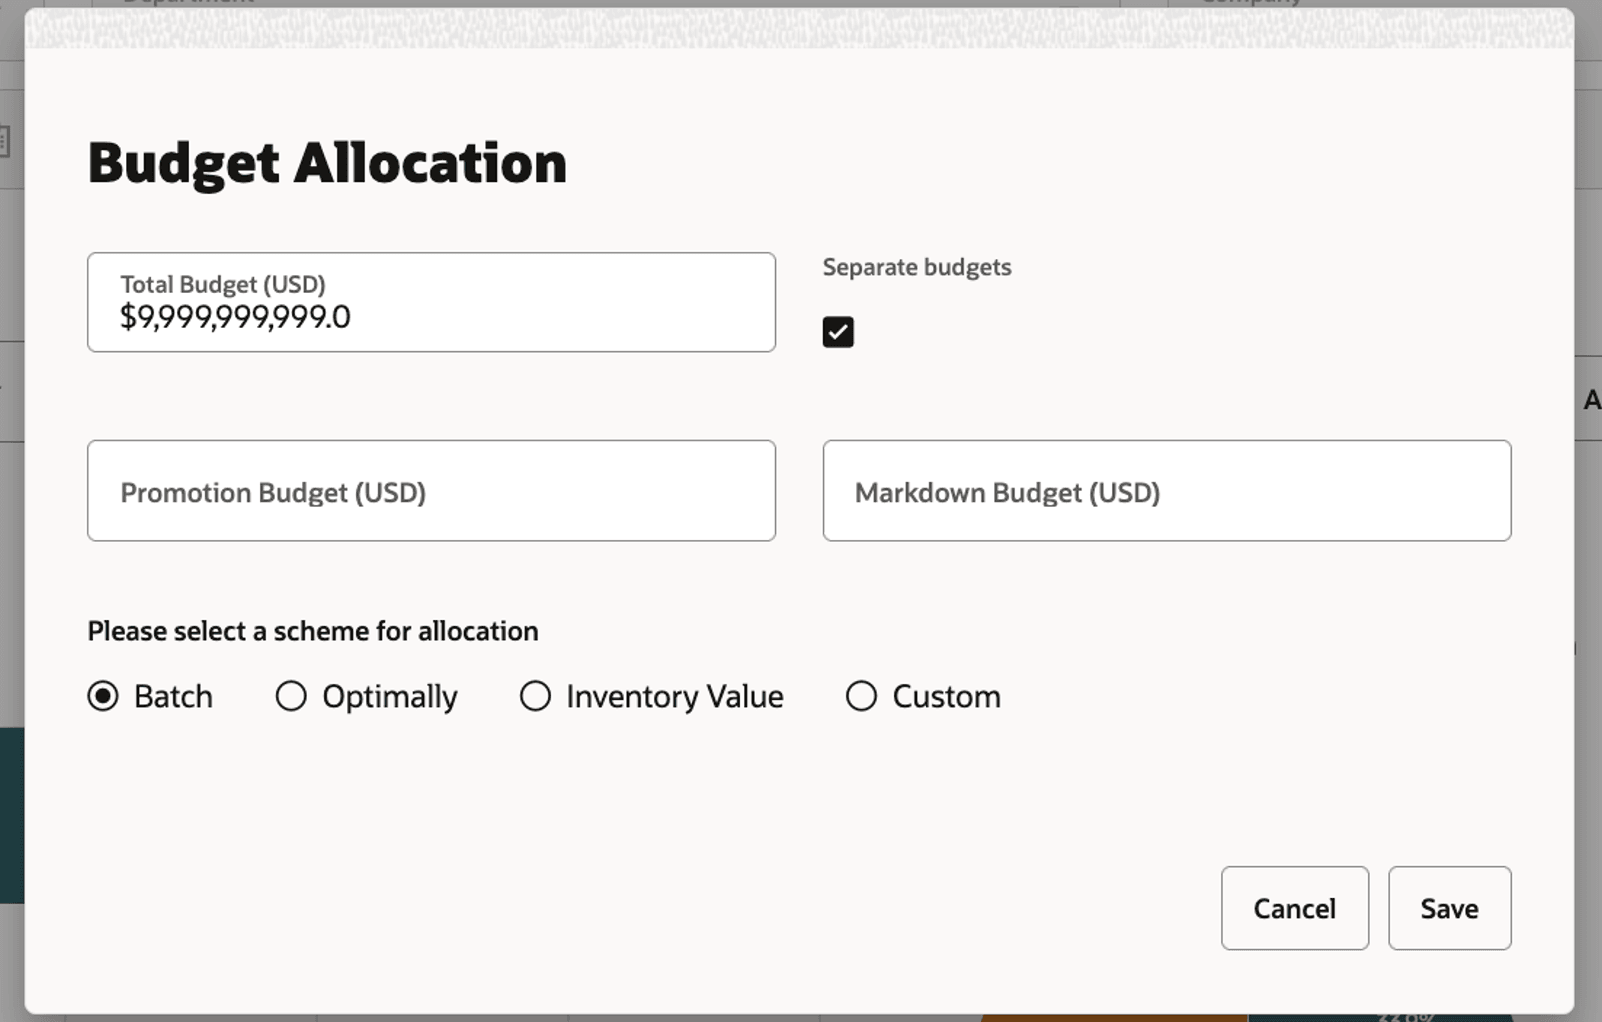
- Total Budget: Represents the budget available over the entire of the life of the item and across all items in the run for both promotions and markdowns.
- Promotion and Markdown Budgets: You can check this option to use separate budgets for promotions and markdowns.
- Allocation Scheme:
- Batch: When you send in the budget through the interface and send the budget values at the run's product processing level (for example, Class), the default option selected is Batch. This option is not available when the budget is not sent through the interface at the run's product processing level.
- Optimally: When you send in the budget through the interface at the run's product setup level, (for example, Department) then the default option selected is Optimally.
- Inventory Value: This option allocates the budget in proportion to the inventory value (current price * unsold inventory) of the run's product processing level (for example, Class).
- Custom: You can choose to specify the allocation percentage. Allocation percentages must add up to 100% as shown in the figure.
Figure 5-8 Markdown/Promotion Optimization Run - Objectives and Budget - Budget Allocation Custom
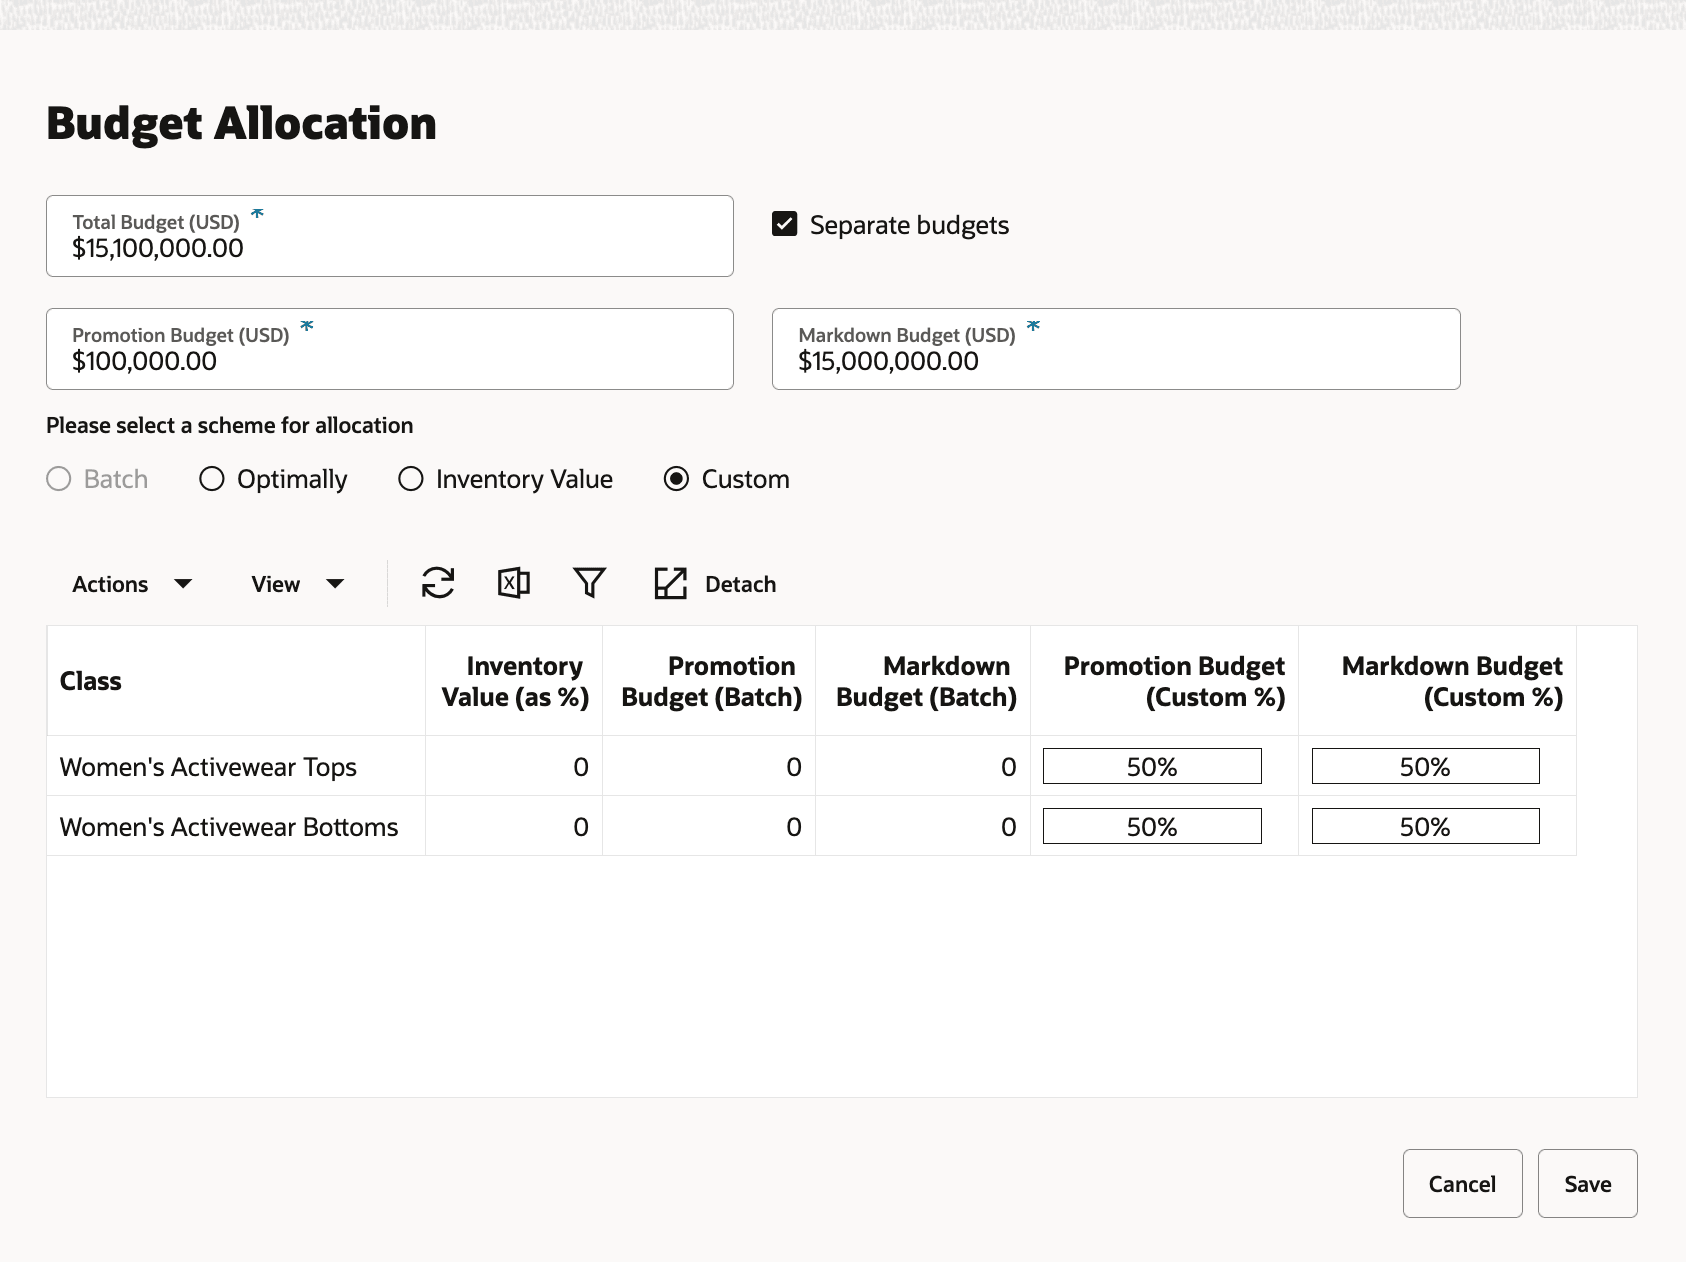
Description of "Figure 5-8 Markdown/Promotion Optimization Run - Objectives and Budget - Budget Allocation Custom"
Scope - Review Information
-
Start and end date of the run's product processing level (configured by PRO_PROD_HIER_PROCESSING_LVL, for example, class) for a season's start and end date.
-
Pie-charts of item counts and unsold inventory units by the PRO_PROD_HIER_PROCESSING_LVL (for example, class).
You can toggle between the Item contribution pie chart and the Inventory Contribution pie chart. For example, if the run's processing level is Class, then Item contribution shows how many items are present by each class, and inventory contribution shows the unsold inventory units by each class. Unsold inventory is the sum of all configured inventory components (for example, on order, allocated warehouse in transit, and so on.)
Figure 5-9 Markdown/Promotion Optimization Run - Review Information

Description of "Figure 5-9 Markdown/Promotion Optimization Run - Review Information"
When you hover over a component in the chart, the corresponding legend item is highlighted. Similarly, hovering over a legend item highlights the respective component in the chart. For example, in the figure below, the Women’s Activewear Bottoms segment is highlighted.
Figure 5-10 Markdown/Promotion Optimization Run - Review Information Highlight Chart Component
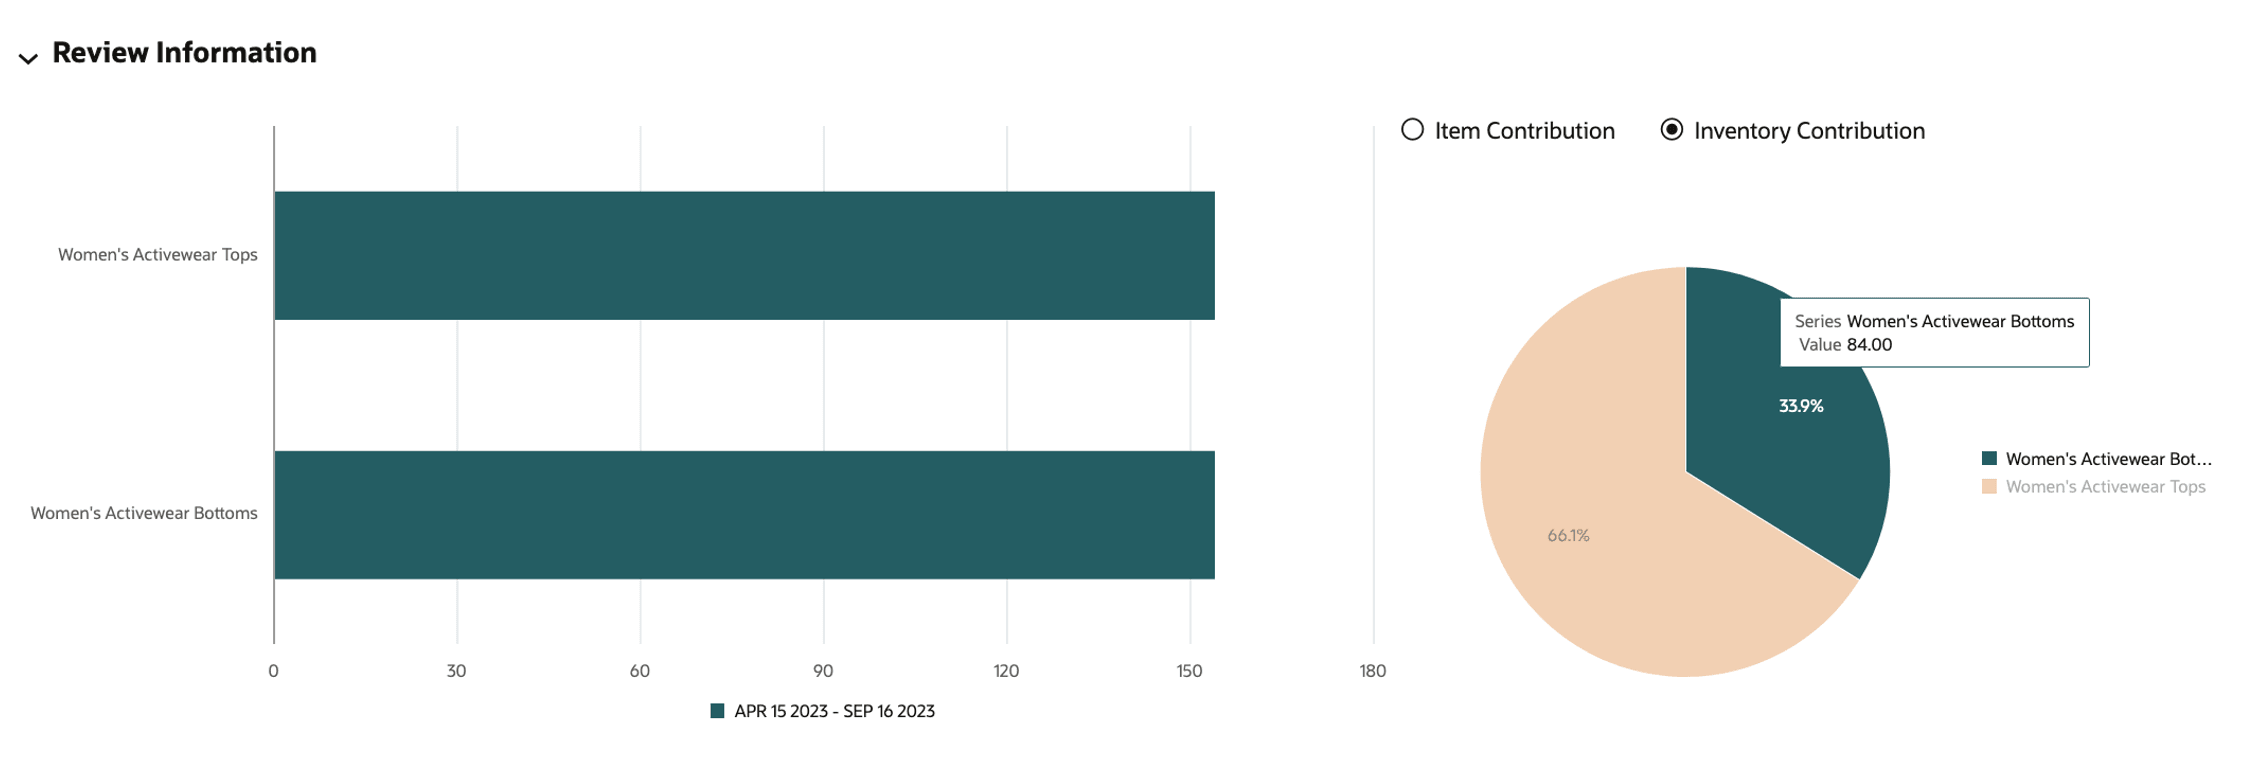
Description of "Figure 5-10 Markdown/Promotion Optimization Run - Review Information Highlight Chart Component"
Markdown/Promotion - Rules
Business Rules correspond to the different constraints that are imposed on a pricing optimization problem. Business rules can be delivered through the interfaces and associated with a strategy (for example, Christmas Strategy). By default, there is always a DEFAULT_SET strategy, which is used to populate Strategy screens. The Strategy stage is divided into seven different tabs: Temporal, Planned Events, Promotion, Markdown, Sell-Through Target, Price Ladder, and Pricing Groups.
-
Summary to the left, with a General Strategy button.
-
The Summary panel displays the summary of all rules specified at different merchandise levels. When the run is saved (or optimized), the default values are used to populate at the run's product processing level (for example, Class). This panel is read-only and not editable.
-
Using the General Strategy button, you can open the General Strategy pop-up window where you can specify the constraint at the run-level, which means that the rule is applied to all locations and all product processing levels (for example, all classes) in the run. All product processing levels (for example, all classes) obtain the same values mentioned in the General Strategy section.
-
When the rules are sent to optimization, the rules are applied based on the concept that lower merchandise-level rules override higher merchandise-level rules. Consider the following example. Suppose the department-level rule says that the first min discount% cannot be lower than 10%. This means that all items in all classes are assigned this 10% criterion. If you decide to add a style-level rule, say, 20%, then all the items in all classes are assigned the 10% rule and the items in this style are assigned the 20% rule.
-
- Contextual Area that expands on the right when clicked on the icon. The contextual area displays a pie chart that shows the percentage of rules specified at different merchandise levels.
Markdown/Promotion - Rules - Temporal
The following figures illustrate specifying the business rules associated with the temporal aspects of the pricing problem.
Promotion and markdown eligibility for periods is defined in the PRO_SEASON_PERIOD_STG interface, and the run is populated as follows:
-
Default values at the run merchandise processing level (for example, class) are populated based on the interface.
-
The interface allows you to specify the general promotion, markdown, and ineligible periods at the run's product processing level or higher. That is, for each period, the type of pricing change that is allowed is specified through this interface. When sending period eligibility to optimization, the no-touches are applied on top of the period eligibility specified by the interface.
-
You can modify no-touch at the beginning and at the end of life for all classes in the UI by clicking the General Strategy button from table toolbar, as shown in the second figure below.
Figure 5-11 Temporal Strategy - Summary and Contextual Area
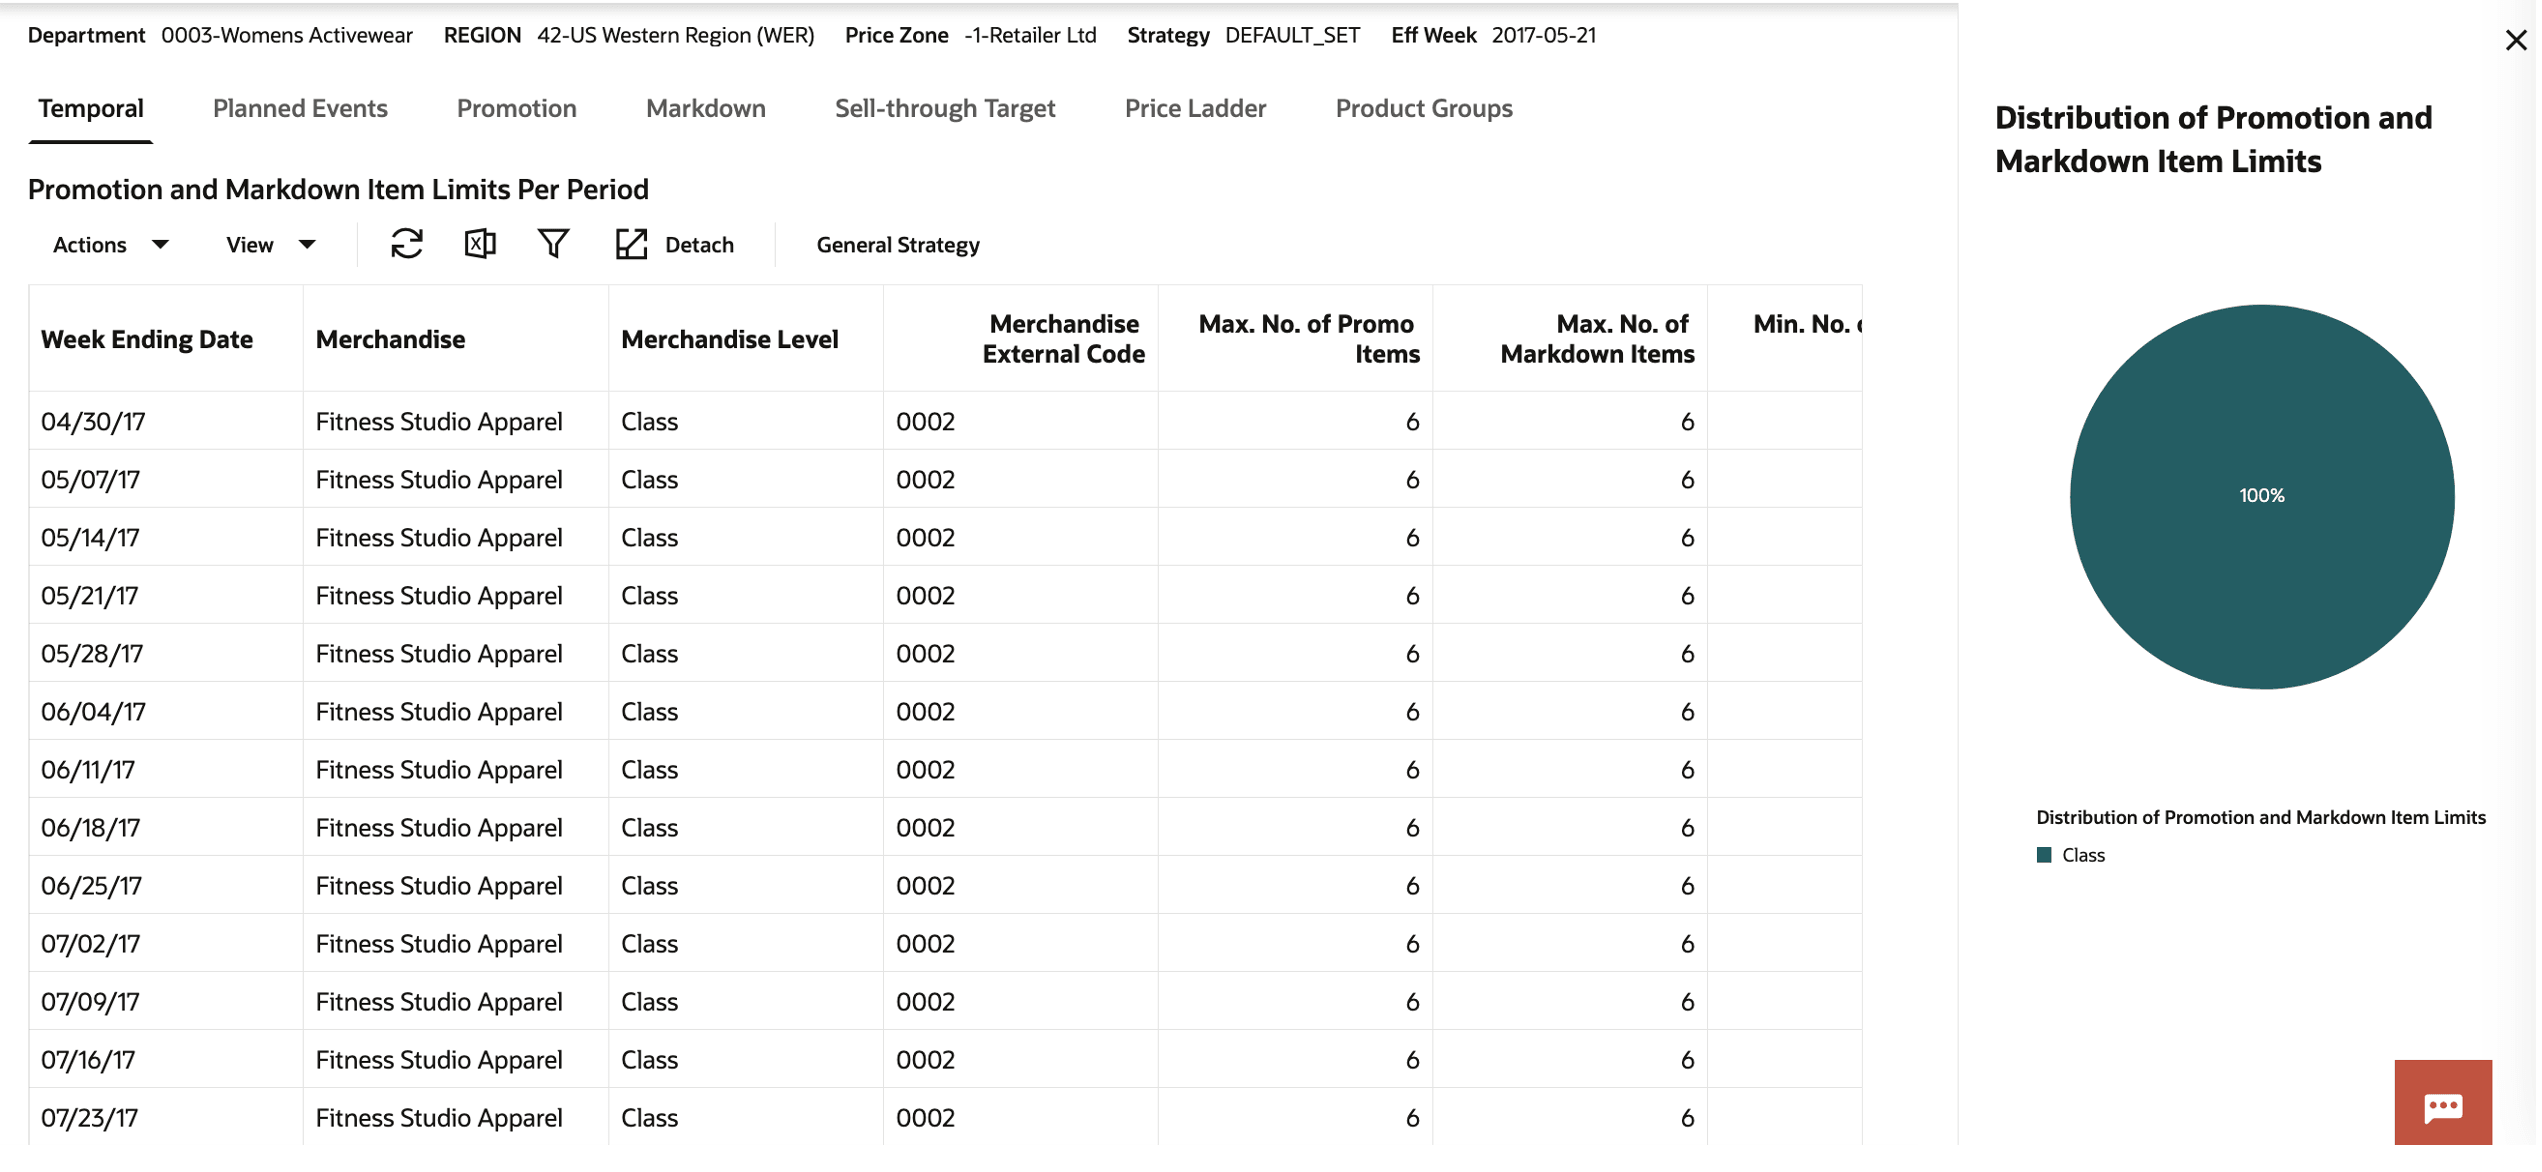
Description of "Figure 5-11 Temporal Strategy - Summary and Contextual Area"
Table 5-3 Temporal Rules
| Field | Description |
|---|---|
| Week Ending Date | The week ending date for the period. Non-editable field. |
| Merchandise | Description of the merchandise. |
| Merchandise Level |
Merchandise level of the rule. This can be from PRO_PROD_HIER_PROCESSING_LVL (for example, class) to subclass or style/color. |
| Max No. of Promo Items |
This feature is not editable and provides the ability to limit how many items can be promoted for that period. The default value is the number of items at that merchandise level and name. When a period is marked as Promotion Allowed, then the Max No. of Markdown Items is disabled and set to 0. When a period is marked as ineligible, then this field is disabled and set to 0. |
| Max No. of Markdown Items |
This feature is not editable and provides the ability to limit how many items can be marked down for that period. The default value is the number of items at that merchandise level and name. When a period is marked as Markdown Allowed, then the Max No. of Promotion Items is disabled and set to 0. When a period is marked as ineligible, then this field is disabled and set to 0. |
| Min No. of Promotion Items | This feature is editable and provides the ability to specify the minimum number of items to be promoted for that period. The default value is 0. When a period is marked as Markdown Allowed, then the Min No. of Promotion Items is disabled and set to 0. When a period is marked as ineligible, then this field is disabled and set to 0 |
| Min No. of Markdown Items |
This feature is editable and provides the ability to specify the minimum number of items to be marked down for that period. The default value is 0. When a period is marked as Promotion Allowed, then the Min No. of Markdown Items is disabled and set to 0. When a period is marked as ineligible, then this field is disabled and set to 0. |
Figure 5-12 Temporal General Strategy
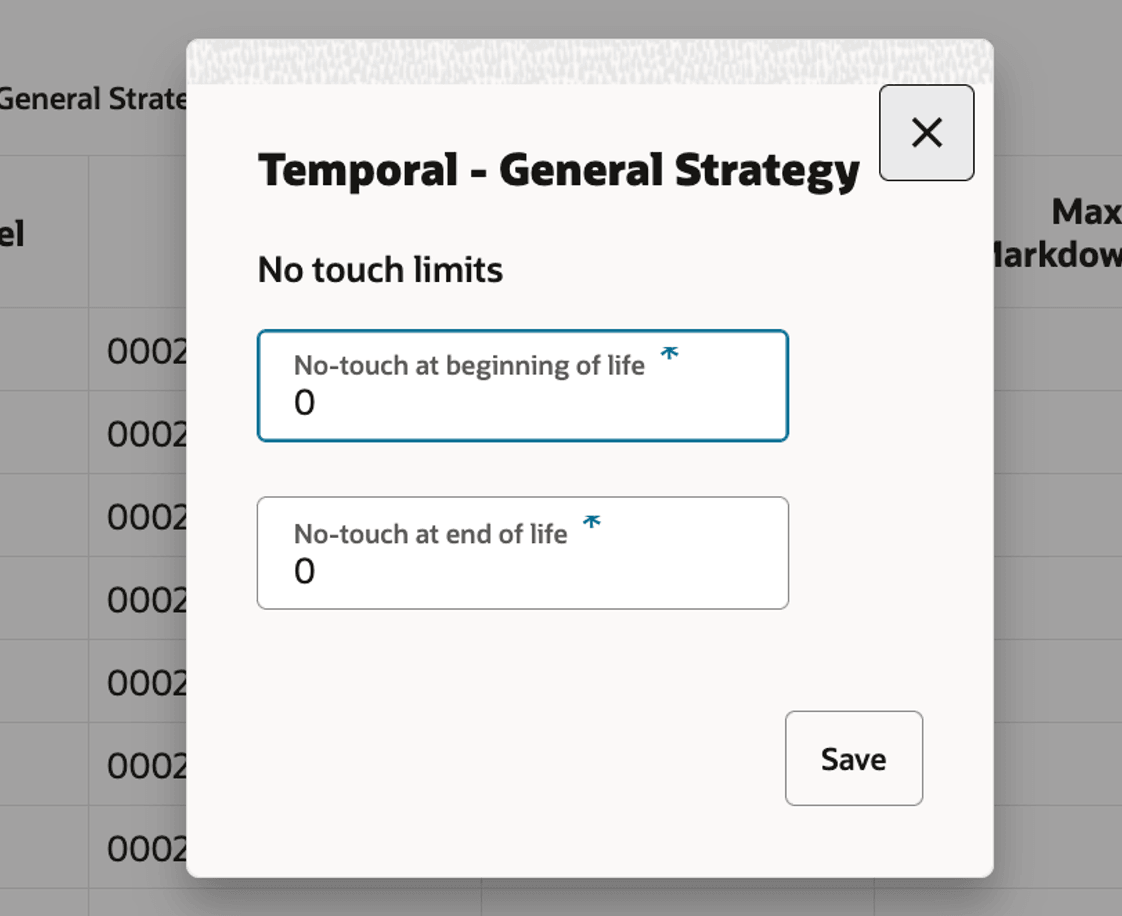
Table 5-4 Temporal Rules
| Field | Description |
|---|---|
|
No Touch After Landing |
The default value is 0 weeks and is applied at the item level (and for all the locations). It indicates that price of an item cannot be changed from the initial full price until 0 weeks have been completed after the item start selling (also referred to as model start date). |
|
No Touch at End of Life |
The default value is 0 weeks and is applied at the item level (and for all the locations). It indicates that the price of an item cannot be changed in the last 0 weeks before the exit date. |
Markdown/Promotion - Rules - Planned Events
The screen shown in the following figure provides a detailed view of promotional activities, including their start and end dates, discount percentages, and event types. It also outlines the merchandise and location details, along with pricing zone information, ensuring effective organization and tracking of promotional strategies.
Figure 5-13 Planned Events
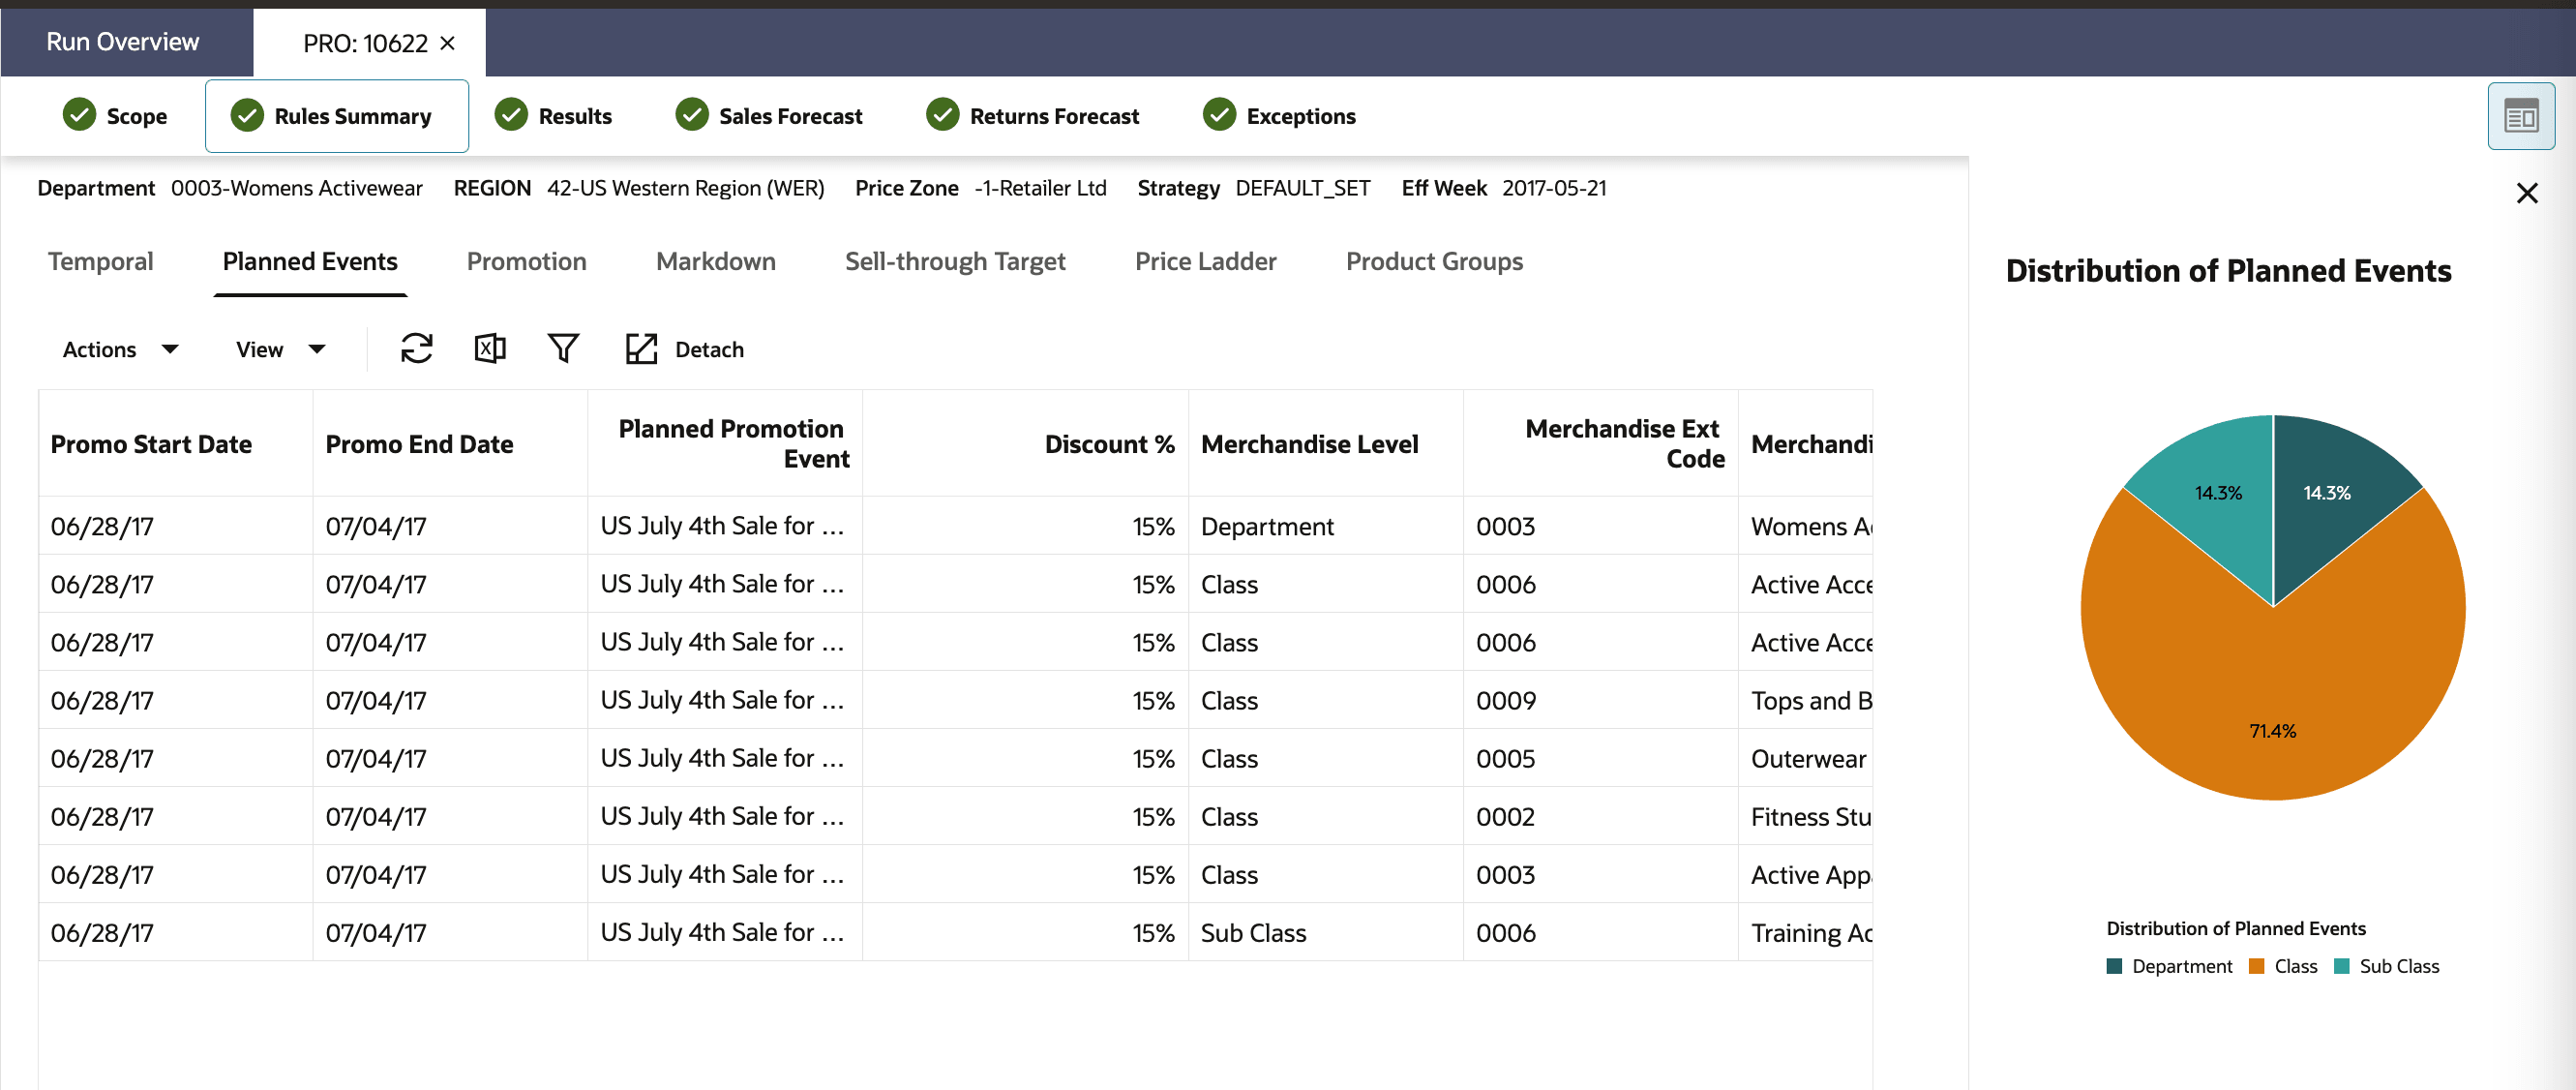
The fields available are described in the following table.
Table 5-5 Planned Events
| Field | Description |
|---|---|
| Promo Start Date | Indicates the start date of the promotional event. |
| Promo End Date | Specifies the end date of the promotional event. |
| Planned Promotion Event | Describes the name of the planned promotional activity. |
| Discount % | Represents the percentage of discount applied during the event. |
| Merchandise Level | Defines the hierarchical level of merchandise included in the promotion. |
| Merchandise Ext Code | A unique code identifying specific merchandise associated with the event. |
| Merchandise | Displays the name of the merchandise involved. |
| Location Level | Indicates the hierarchical level of the location (for example, region, area). |
| Location Ext Code | A unique code for identifying locations. |
| Location | Specifies the detailed name or description of the location. |
| Price Zone Ext Code | A unique code for the pricing zone involved in the promotional event. |
| Price Zone Name | Provides the name of the pricing zone. |
| Apply Planned Promotions? | Yes/No to decide if the planned promotions have to be applied. |
| Year Independent ID | Promotional event ID independent of the year. |
Markdown/Promotion - Rules - Promotion
In this screen, shown in the following figures, you can specify the rules associated with promotions, specifically the reactive promotions (and not the planned promotions) that do not exceed more than one week.
The default values that are populated for this run, such as General Strategy, are based on the DEFAULT_SET strategy or selected strategy in the Scope stage.
The contextual area shows the percentage of rules specified by the merchandise-level, that is, percentage specified at Class-level versus Subclass versus Style/Color level.
Figure 5-14 Promotion Strategy - Summary Contextual Area
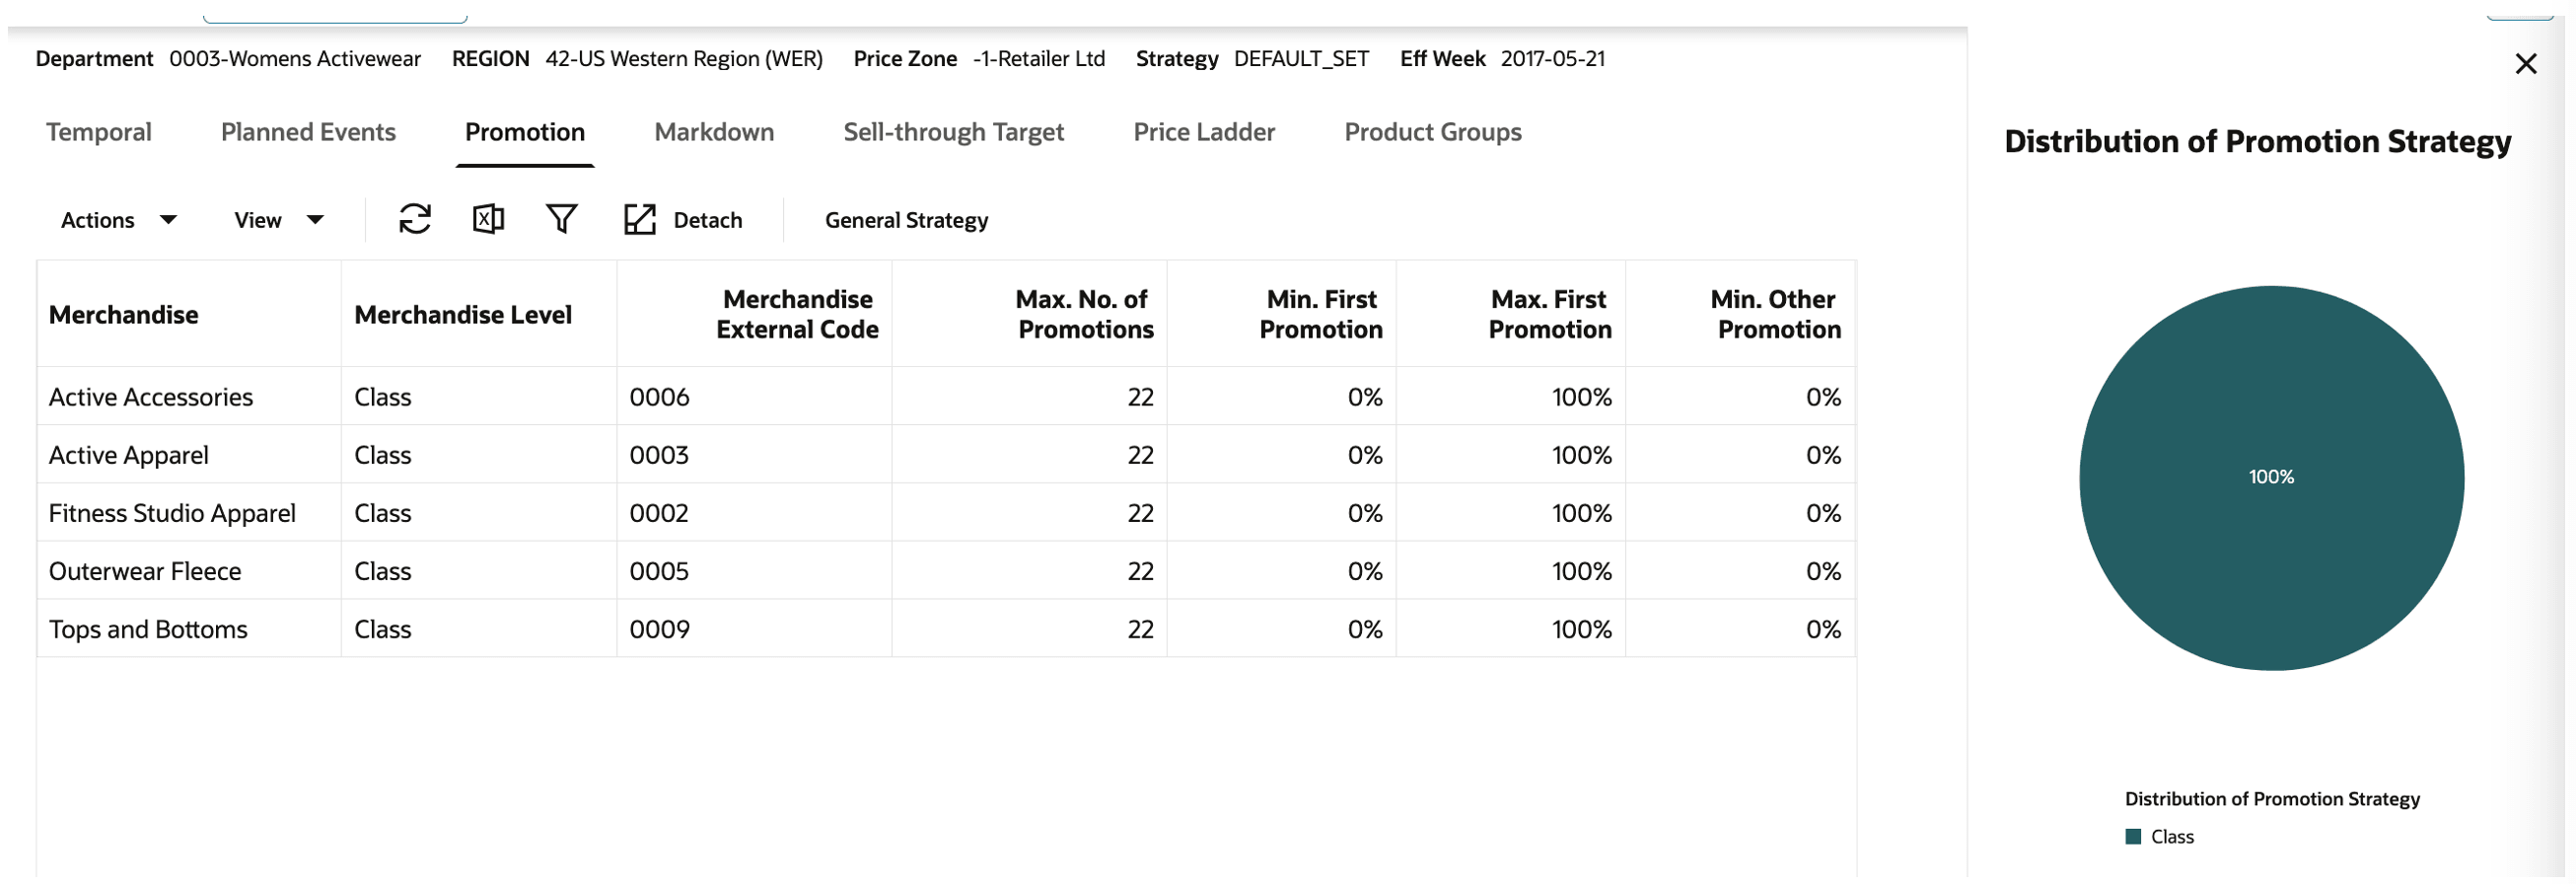
Description of "Figure 5-14 Promotion Strategy - Summary Contextual Area"
Table 5-6 Promotion Strategy
| Field | Description |
|---|---|
|
Merchandise |
Description of the merchandise. |
|
Merchandise External Code |
The merchandise's external code that can be identified by the retailer. |
|
Merchandise Level |
Merchandise level of the rule. This can be from PRO_PROD_HIER_PROCESSING_LVL (for example, Class) to Subclass, or Style/Color. |
|
Min First Promotion Discount |
The minimum discount that is allowed for the first promotion in the season. The default value (for example, 0%) is based on a parameter specified in the DEFAULT_SET strategy or the selected strategy in the Scope stage. |
|
Min Other Promotion Discount |
The minimum discount that is allowed for the subsequent promotions (except the first) in the season. The default value (for example, 0%) is based on a parameter specified in the DEFAULT_SET strategy or the selected strategy in the Scope stage. |
|
Min Time Between Promotions |
The minimum time (in periods or weeks) between consecutive promotions in the season. If there are four months in the promotion season, and the min time is four weeks, then roughly one promotion week is available per month. The default value (for example, one week) is based on a parameter specified in the DEFAULT_SET strategy or the selected strategy in the Scope stage. |
Figure 5-15 Promotion - General Strategy
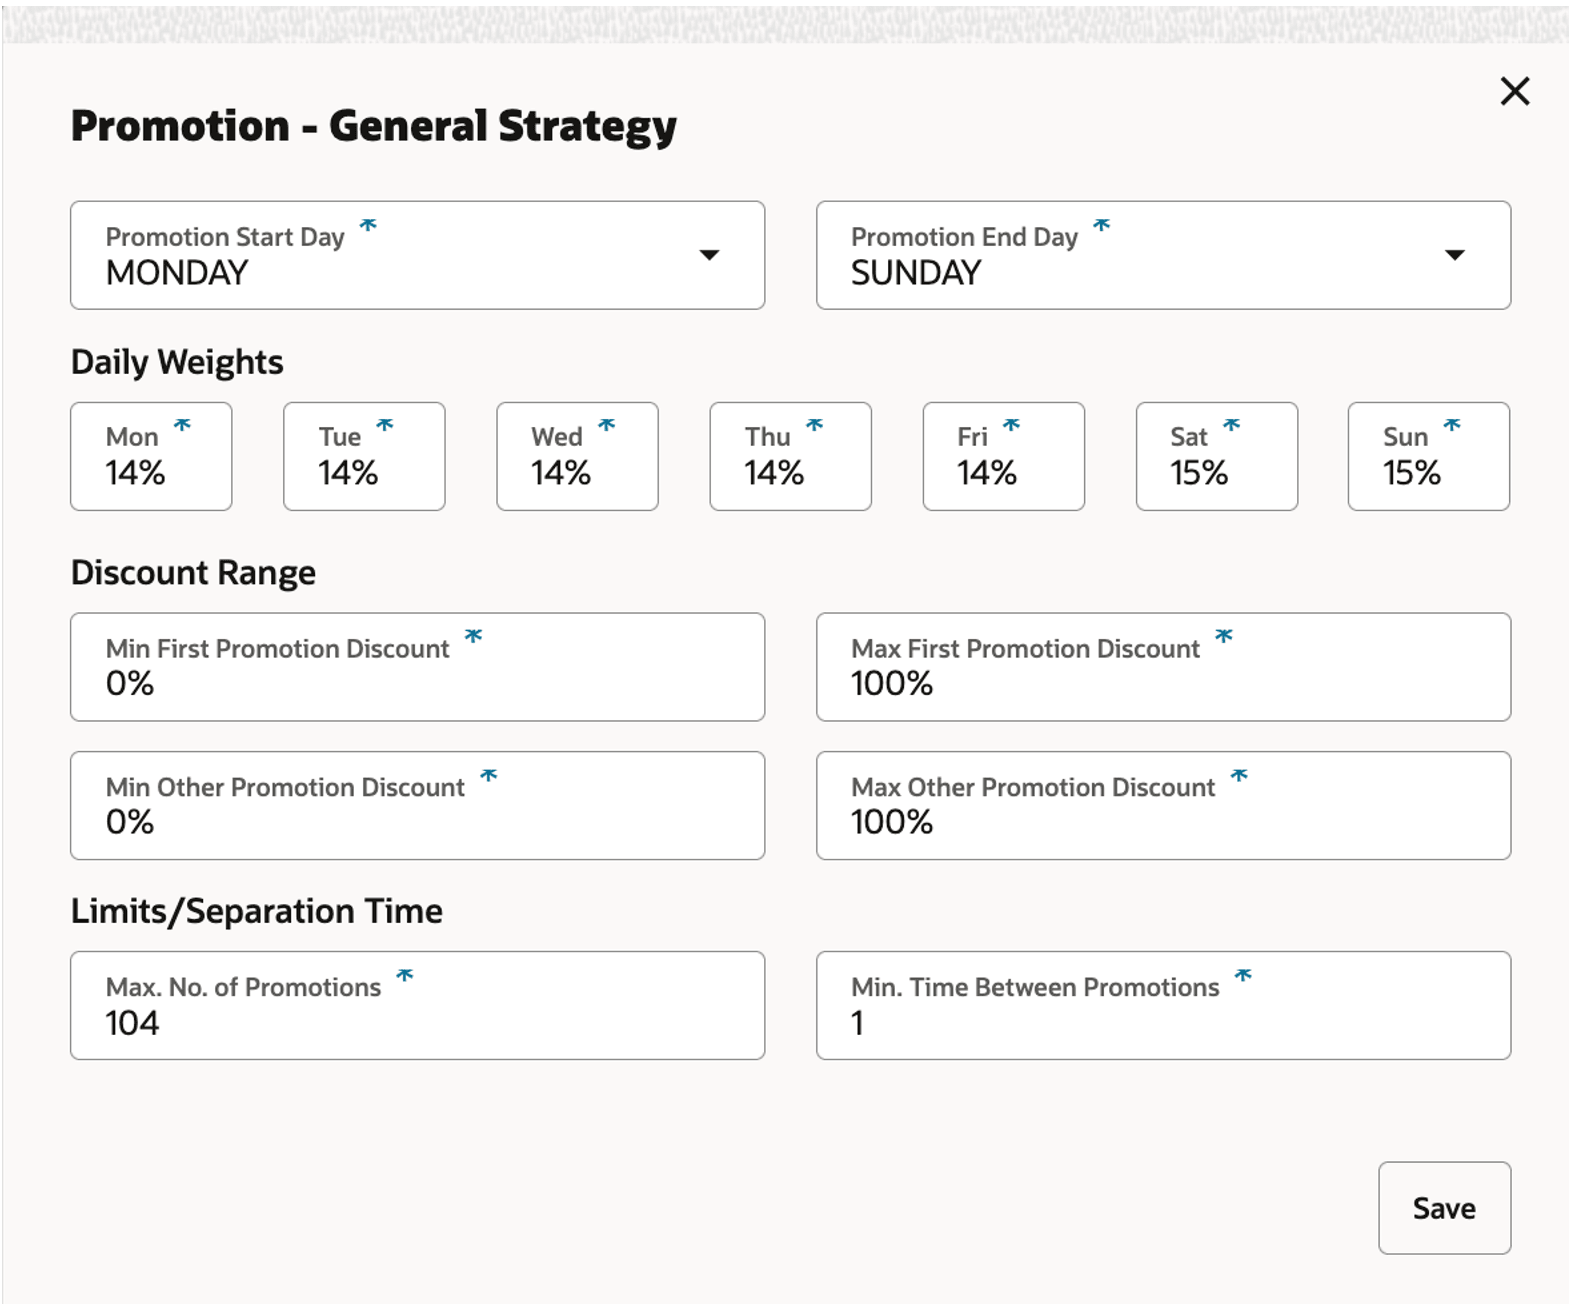
The fields available are described in the following table.
Table 5-7 Promotion Strategy
| Field | Description |
|---|---|
| Merchandise | Description of the merchandise. |
| Merchandise External Code | The merchandise's external code that can be identified by the retailer. |
| Merchandise Level |
Merchandise level of the rule. This can be from PRO_PROD_HIER_PROCESSING_LVL (for example, Class) to Subclass, or Style/Color. |
| Max No. of Promotions | Maximum number of promotions allowed for an item in the life or season. |
| Min First Promotion |
The minimum discount that is allowed for the first promotion in the season. The default value (for example) is 0%. |
| Max First Promotion |
The maximum discount that is allowed for the first promotion in the season. The default value (for example) is 100%. |
| Min Other Promotion |
The minimum discount that is allowed for the subsequent promotions (except the first) in the season. The default value (for example) is 0%. |
| Max Other Promotion |
The maximum discount that is allowed for the subsequent promotions (except the first) in the season. The default value (for example) is 100%. |
| Min Time Between Promotions |
The minimum time (in periods or weeks) between consecutive promotions in the season. If there are four months in the promotion season, and the min time is four weeks, then roughly one promotion. |
Markdown/Promotion - Rules - Markdown
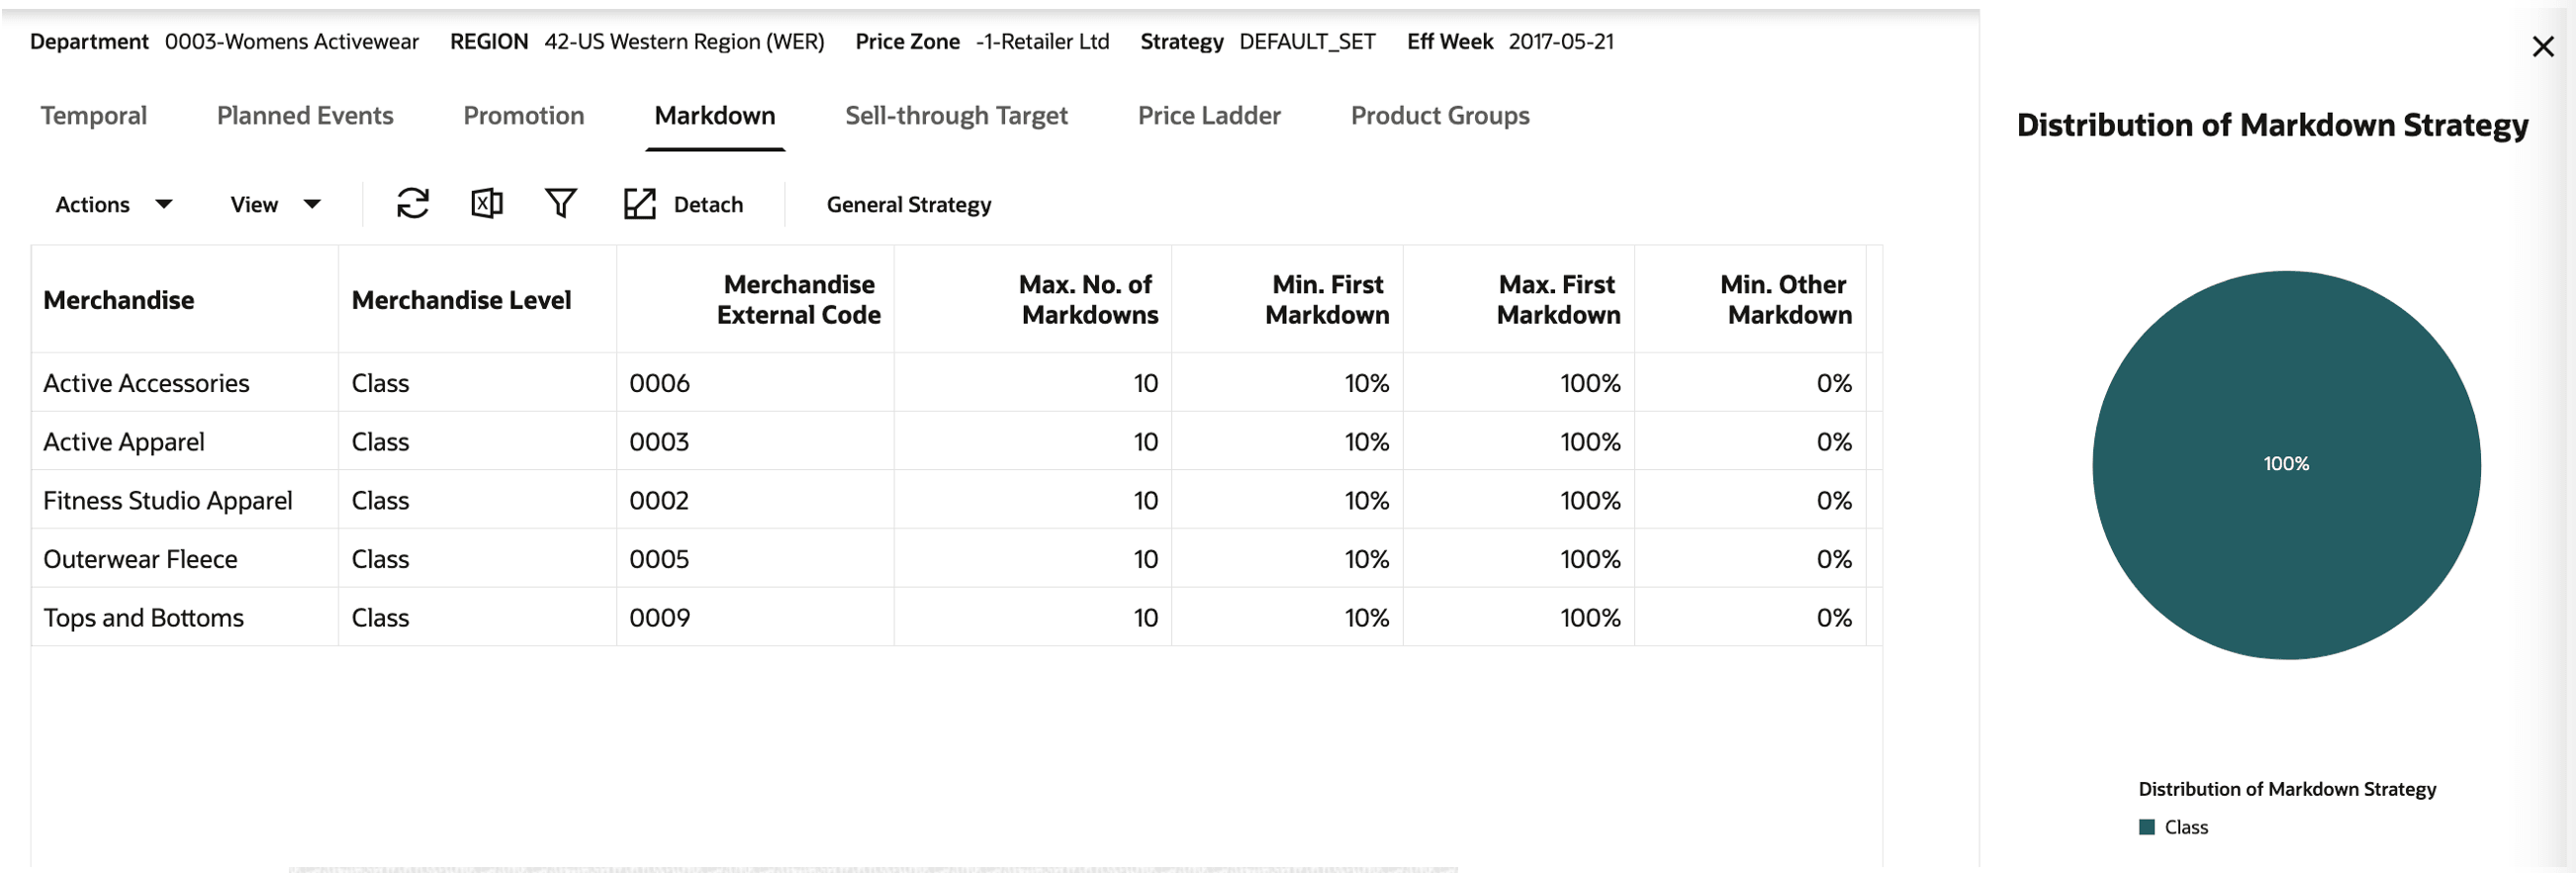
In this screen, shown in the following figures, you can specify the rules associated with markdowns.
The default values that are populated for this run, such as General Strategy, are based on the DEFAULT_SET strategy or selected strategy in the Scope stage. The retailer can choose to modify the values during implementation.
The contextual area shows the percentage of rules specified by the merchandise level (for example, the percentage specified at Class versus Subclass versus Style/Color level).
Figure 5-17 Markdown - General Strategy
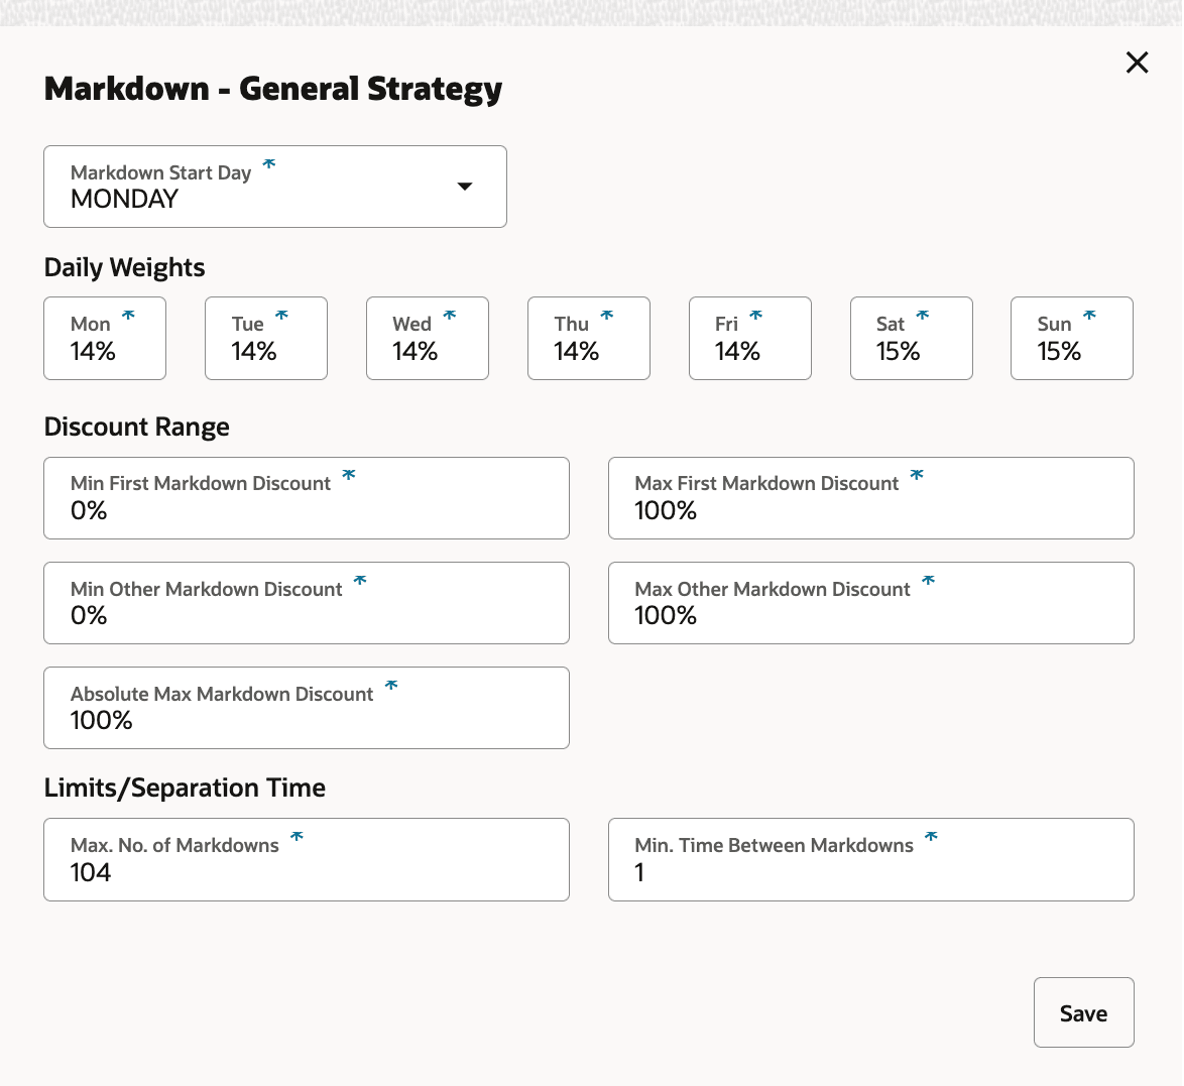
The fields available are described in the following table
Table 5-8 Markdown Strategy
| Field | Description |
|---|---|
|
Daily Weights |
These values represent the proportion of weekly demand for each day of the week. This helps spread the weekly forecast into daily forecasts, depending on when the promotion is applicable (for example, Thu-Sun) for that week. These are generated internally by LPO forecasting or can be supplied through an interface. |
|
Markdown Start Day |
Indicates when the markdown can start within a week. The default value (for example, Thursday) is based on a parameter specified in the DEFAULT_SET strategy or the selected strategy in the Scope stage. |
|
Max Absolute Markdown Discount |
The maximum discount (of full price) that is allowed for any markdown in the season. The default value (for example, 100%) is based on a parameter specified in the DEFAULT_SET strategy or the selected strategy in the Scope stage. |
|
Max First Markdown Discount |
The maximum discount that is allowed for the first markdown in the season. The default value (for example, 100%) is based on a parameter specified in the DEFAULT_SET strategy or the selected strategy in the Scope stage. |
|
Max No. of Markdown Weeks |
The default is the total number of weeks in the season. This allows the user to limit how many weeks are available for markdowns for a particular merchandise. |
|
Max Other Markdown Discount |
The maximum discount that is allowed for the subsequent markdowns (except the first) in the season. The default value (for example, 100%) is based on a parameter specified in the DEFAULT_SET strategy or the selected strategy in the Scope stage. |
|
Merchandise |
A description of the merchandise. |
|
Merchandise Level |
The merchandise level of the rule. This can be from PRO_PROD_HIER_PROCESSING_LVL (for example, Class) to Subclass, or Style/Color. |
|
Merchandise External Code |
The merchandise's external code that can be identified by the retailer. |
|
Min First Markdown Discount |
The minimum discount that is allowed for the first promotion in the season. The default value (for example, 0%) is based on a parameter specified in the DEFAULT_SET strategy or the selected strategy in the Scope stage. |
|
Min Other Markdown Discount |
The minimum discount that is allowed for the subsequent markdowns (except the first) in the season. The default value (for example, 0%) is based on a parameter specified in the DEFAULT_SET strategy or the selected strategy in the Scope stage. |
|
Min Time Between Markdowns |
The minimum time (in periods or weeks) between consecutive markdowns in the season. If there are four months in the markdowns season, and the min time is four weeks, then roughly one markdown week is available per month. Default value (for example, one week) is based on a parameter specified in the DEFAULT_SET strategy or the selected strategy in the Scope stage. |
Here is a description of Min Other Markdown and Max Other Markdown Discount. Consider the following example:
Suppose the user sets these values to 25% and 50%, respectively, for an item with a full price of $100. If the first markdown was 20%, then the item's ticket price drops to $80. Because of the Min Other and Max Other Markdown Discount, the second markdown will be limited to a value between $80 *(1-0.25) = $60 (or 40% off) and $80 * (1-0.50) = $40 (or 60% off). If there was a Max Absolute Markdown Discount of 50%, then the second markdown would be further constrained to be between $60 and $50.
Markdown/Promotion - Rules - Sell-Through Target
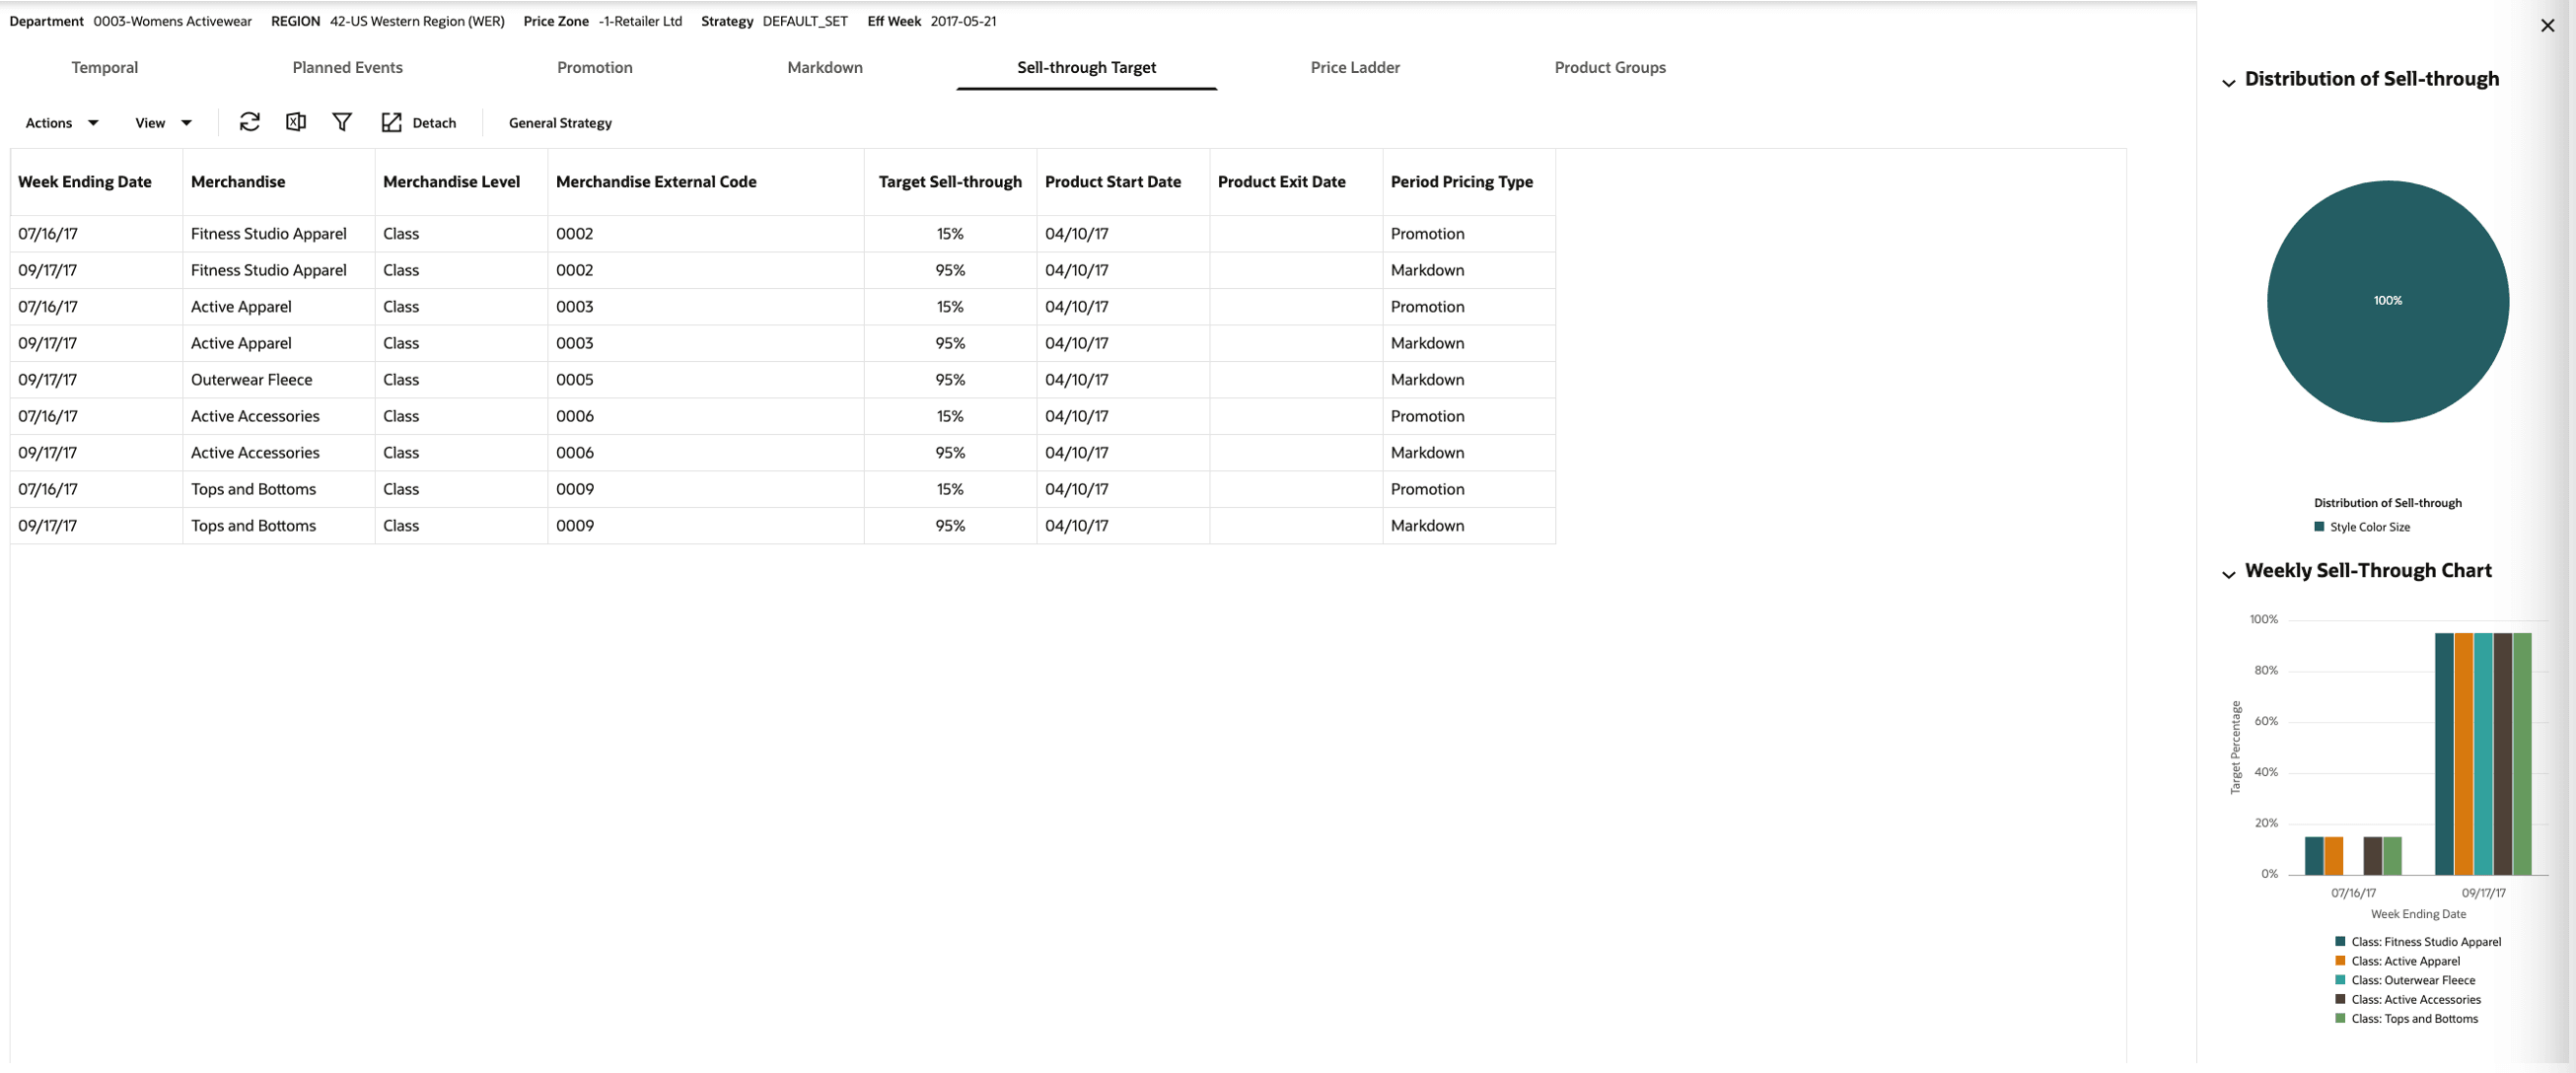
In this screen, as shown in the following figures, you can specify the sell-through targets by week and by merchandise. The default values that are populated for this run, such as General Strategy, are based on the DEFAULT_SET strategy or selected strategy in the Scope stage. The retailer can choose to modify the values during implementation.
The contextual area shows the percentage of rules specified by the merchandise-level (for example, the percentage specified at Class vs. Subclass vs. Style/Color level).
Figure 5-19 Sell-Through Target-General Strategy
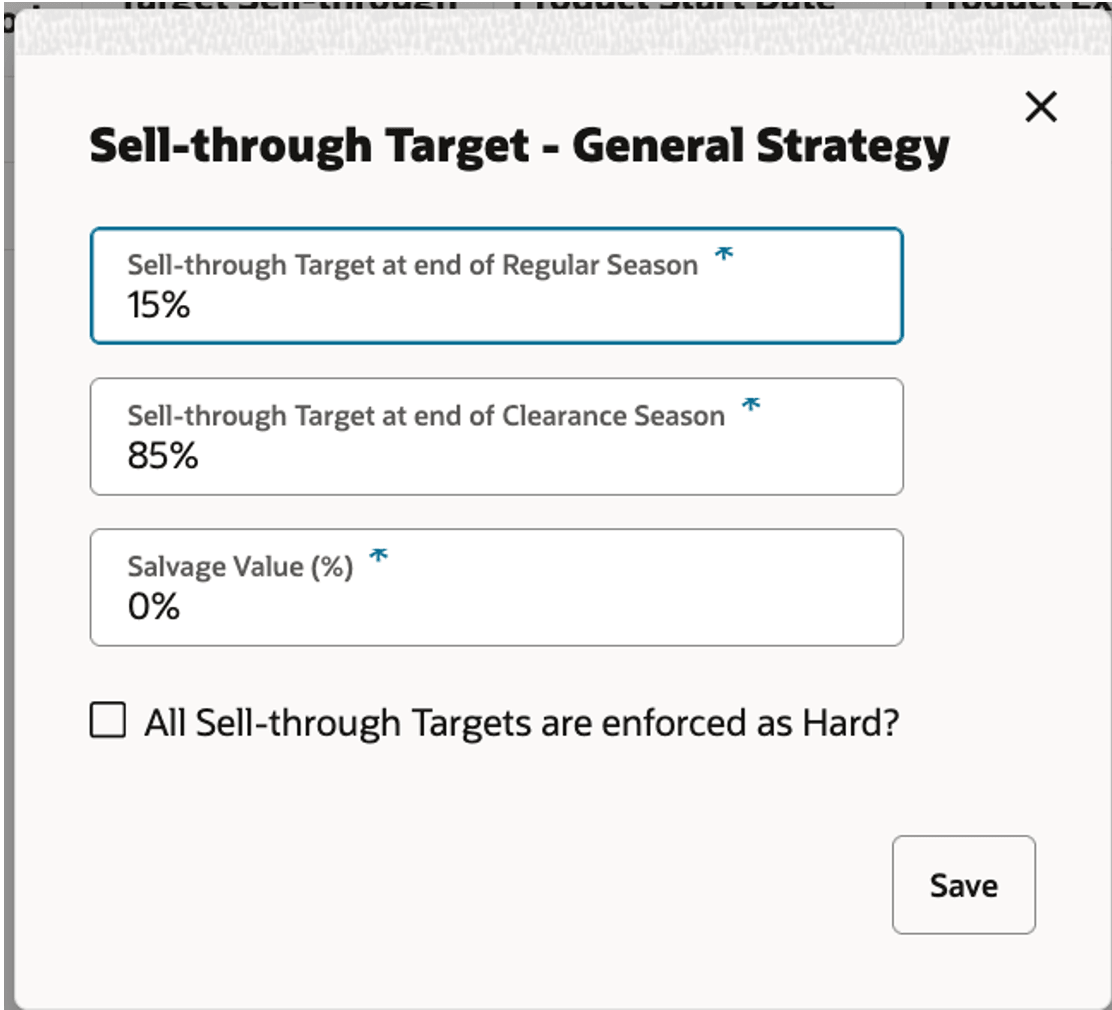
The fields available are described in the following table.
Table 5-9 Sell-Through Target
| Field | Description |
|---|---|
|
All Sell-through Targets are enforced as Hard? |
If enforced as Hard (checked), then all the sell-through targets must be met; otherwise, the optimization will not return any solution. The default value (for example, not hard) is based on a parameter specified in the DEFAULT_SET strategy or the selected strategy in the Scope stage. |
|
Merchandise |
A description of the merchandise. |
|
Merchandise External Code |
The merchandise's external code that can be identified by the retailer. |
|
Merchandise Level |
The merchandise level of the rule. This can be from PRO_PROD_HIER_PROCESSING_LVL (for example, Class) to Subclass, or Style/Color. |
|
Period Pricing Type |
Indicates whether the period is marked as Promotion Allowed or Markdown Allowed or Ineligible. |
|
Product Exit Date |
This represents the date by which an item is expected to stop selling. |
|
Product Start Date |
This represents the calculated start date for an item based on the logic used for the model start date. |
|
Salvage Value (%) |
The salvage value for an item is calculated using this percentage: Salvage value percentage multiplied by the full price of the item. The default value (for example, 0%) is based on a parameter specified in the DEFAULT_SET strategy or the selected strategy in the Scope stage. This is a non-editable field. |
|
Sell-through target at end of Clearance Season |
The sell-through target that must be achieved by the end of the clearance season (defined as the last markdown eligible period). The default value (for example, 85%) is based on a parameter specified in the DEFAULT_SET strategy or the selected strategy in the Scope stage. |
|
Sell-through target at end of Regular Season |
The sell-through target that must be achieved by the end of the regular season (defined as the last Promotion eligible period). The default value (for example, 0%) is based on a parameter specified in the DEFAULT_SET strategy or the selected strategy in the Scope stage. |
|
Target Sell-through |
The sell-through target at the end of the specified period for the merchandise as percentage (0% - 100%). If enforced as Hard, then this sell-through target must be met; otherwise, the optimization will not return any solution. |
|
Week Ending Date |
The week ending date for the period. This field is not editable. |
|
Weeks From Start |
This field is non-editable and it runs from Week 1 to the maximum number of weeks available for the selected merchandise level. Available only with the Relative Calendar option. |
Markdown/Promotion - Rules - Price Ladder
In this screen, shown in the following figure, you can assign price ladders that have been loaded and are available for the selection location and merchandise levels from (PRO_PROD_HIER_PROCESSING_LVL (for example, Class). You can load as many price ladders as possible at different merchandise levels (Class and above). By default, the system assigns one price ladder for promotion and one for markdown at the PRO_PROD_HIER_PROCESSING_LVL (for example, Class level) that is closest to PRO_PROD_HIER_PROCESSING_LVL.
The contextual area shows the percentage of rules specified by the merchandise level (for example, the percentage specified at Class level versus Subclass versus Style/Color level).
The fields available are described in the following table.
Table 5-10 Price Ladder
| Field | Description |
|---|---|
|
Merchandise |
A description of the merchandise. |
|
Merchandise Level |
The merchandise level of the rule. This can be from PRO_PROD_HIER_PROCESSING_LVL (for example, Class) to Subclass, or Style/Color. |
|
Merchandise External Code |
The merchandise external code that can be identified by the retailer. |
|
Price Ladder Name |
The name for the price ladder. |
|
Price Ladder Type |
The type indicates whether price ladder is for Promotions (P) or Markdowns (M). |
|
Price Ladder Values |
The values available for this price ladder. The price ladder can be a percentage ladder (off full price or current ticket price) or a price-point ladder. The currency for the run shown depends on the locale loaded during the implementation. |
Markdown/Promotion - Rules - Pricing Groups
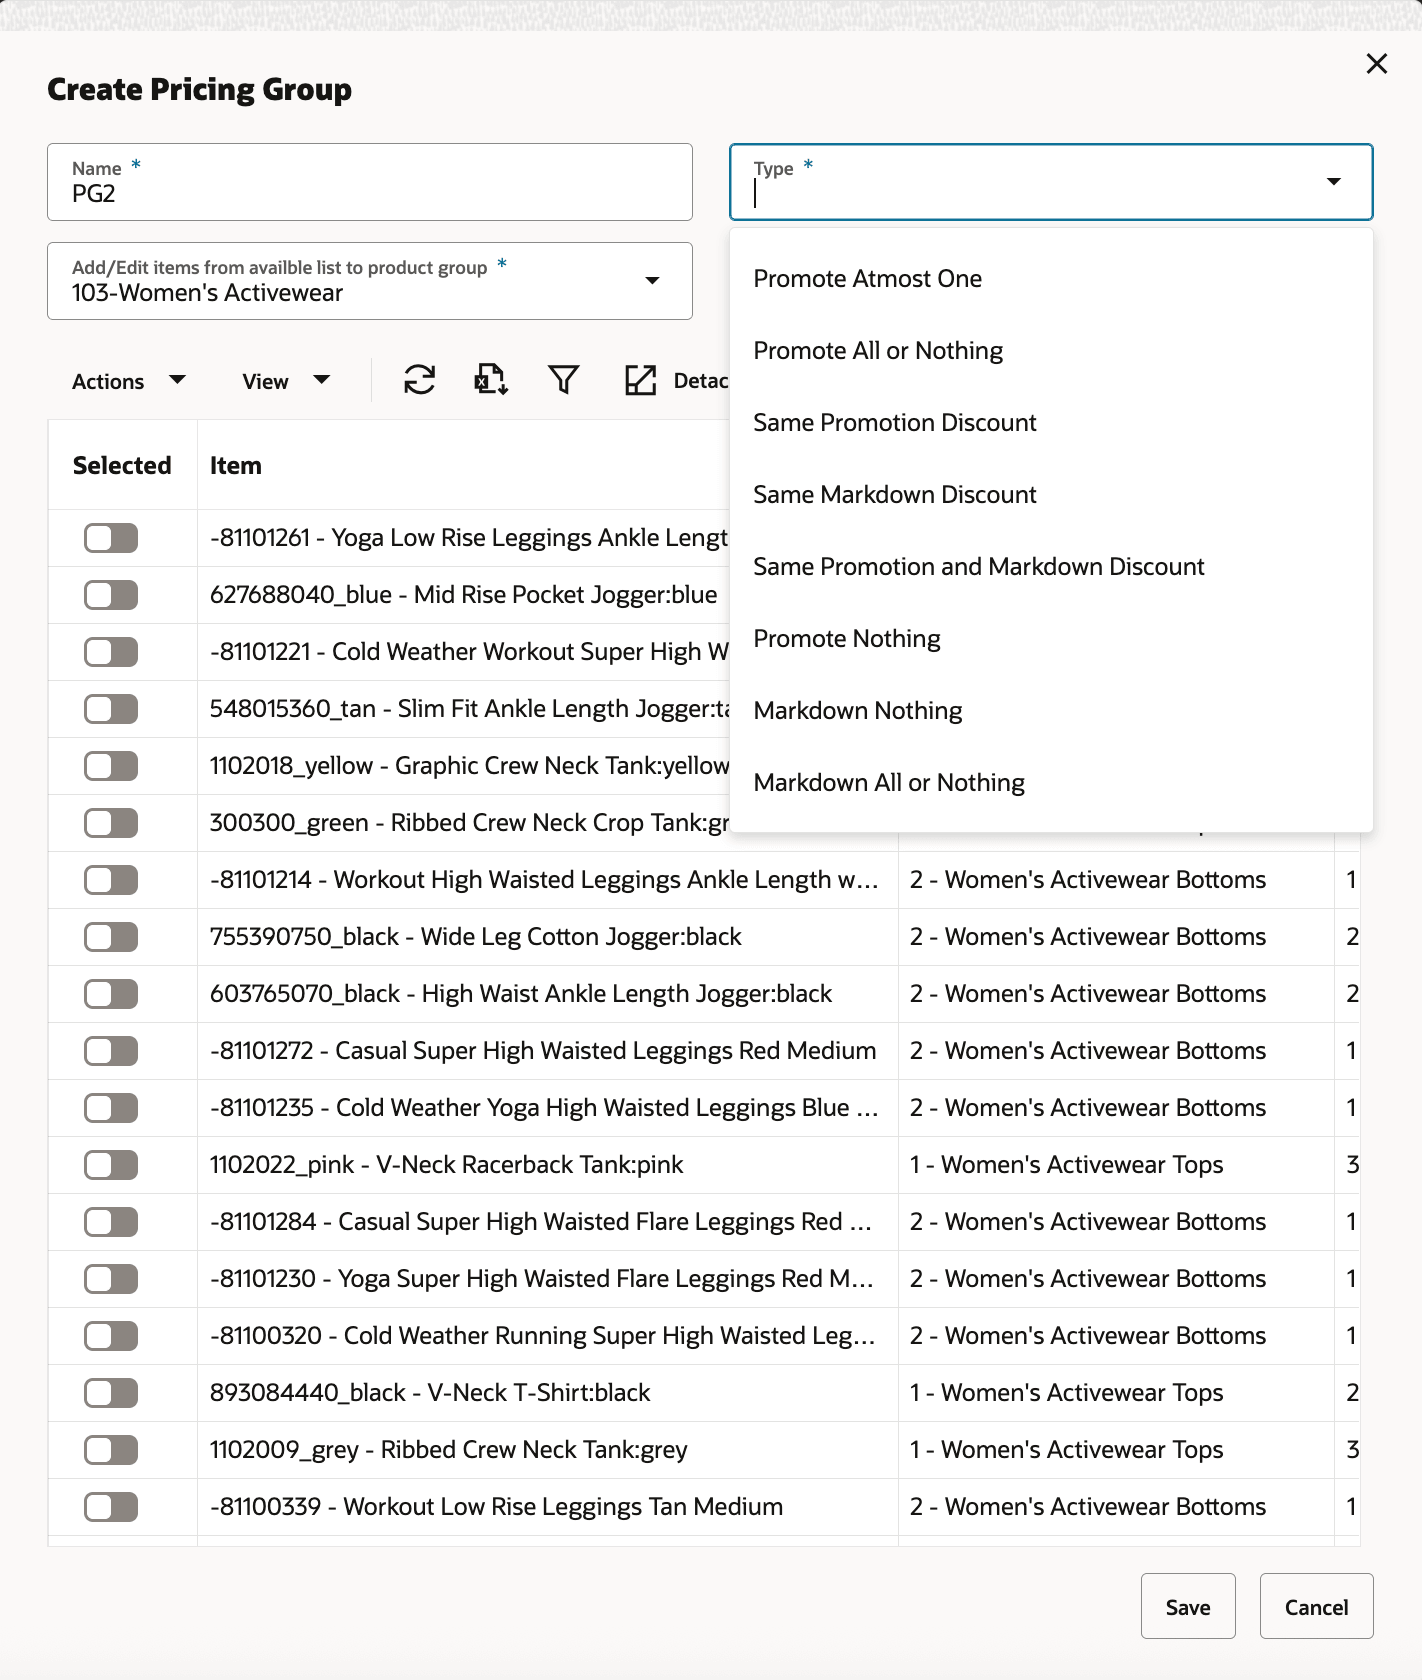
In this screen, shown in the following figure, you can group products within a run's product processing level (for example, class) and categorize them as one of the following eight types:
-
Promote At most One. In this group, at most one product of the group can be promoted in a given week or period. For example, competing brands such as jeans-L versus jeans-K cannot be promoted in the same week or time period.
-
Promote All or Nothing. In this group, all the items must be promoted if any one item of the group is promoted in a given week or time period; otherwise, no item from the group is promoted in a given week or time period. All items in this group when promoted, need not necessarily have the same discount.
-
Markdown All or Nothing. In this group, all the items must be marked down if any one item of the group is marked down in a given week or time period; otherwise, no item from the group is marked down in a given week or time period. Items in this group when marked down, need not necessarily end up with the same discount.
-
Same Promotion Discount. In this group, all the items are not only promoted together in a given week or time period (if promoted), but they also must get the same discount. Note that the recommended prices can be different for each item in this group.
-
Same Markdown Discount. In this group, all the items are not only marked down together in a given week or time period (if marked down), but they also must get the same discount. Note that the recommended prices can be different for each item in this group.
-
Same Promotion and Markdown Discount. All the items receive the same percentage off recommendations over the life of the item. Note that the recommended price can be different for items within this group. For example, items with a full price of $100 and $150 can receive a recommended price of $80 and $120. (Note that both get same discount of 20% off.)
-
Promote Nothing. None of the items in this group receive any promotions.
-
Markdown Nothing. None of the items in this group receive any markdowns.
You can click Create New and access the Create Pricing Group screen. You must enter a group name and the group type from the drop-down list. You can select each product, one at a time, and add it to the group. Alternatively, you can filter the products using Query by Example. Use Select All to add the products to the group, and then click Save. There is limited conflict checking or validation in place, so you must be careful when adding products in two conflicting groups (for example, Promote At most one and Promote All or Nothing).
Alternatively, the group definitions (that is, what items constitute a group) can be loaded using the interfaces: PROD_ATTR.csv and ATTR.csv (formerly, W_RTL_ITEM_GRP1_DS). How these groups must be treated for pricing for a particular product/location or price zone, can be specified using the PRO_OPTIMIZATION_RULES_STG interface or Rules Engine. When the runs are created, these groups will appear in the corresponding run with the intersecting set of items. You can choose to modify the items in the pricing group or pricing group type.
All the groups created are shown in the Pricing Groups Summary. You can select any group, and the set of products within that group are displayed. You can edit or delete any group shown in the Summary panel. The contextual area shows the percentage of groups specified by the group type.
Markdown/Promotion - Run Optimization
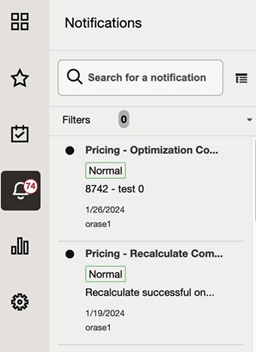
After providing the scope and reviewing or updating the rules, you can click the Optimize button in the footer. This action creates a new row in the Run Overview table, and the run moves to a Running status. Once optimization is complete, the run transitions to either Ready for Review or Failed status. A notification is also pushed to the user that contains the status of the optimization, depending on the outcome.
Figure 5-23 Optimization Complete Notification
Markdown/Promotion - Results
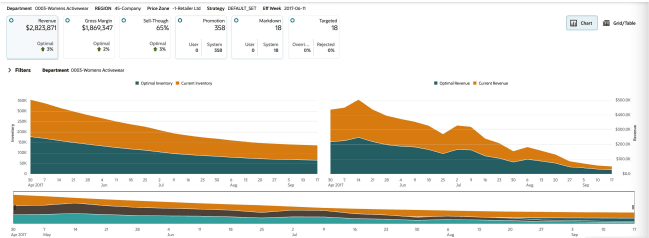
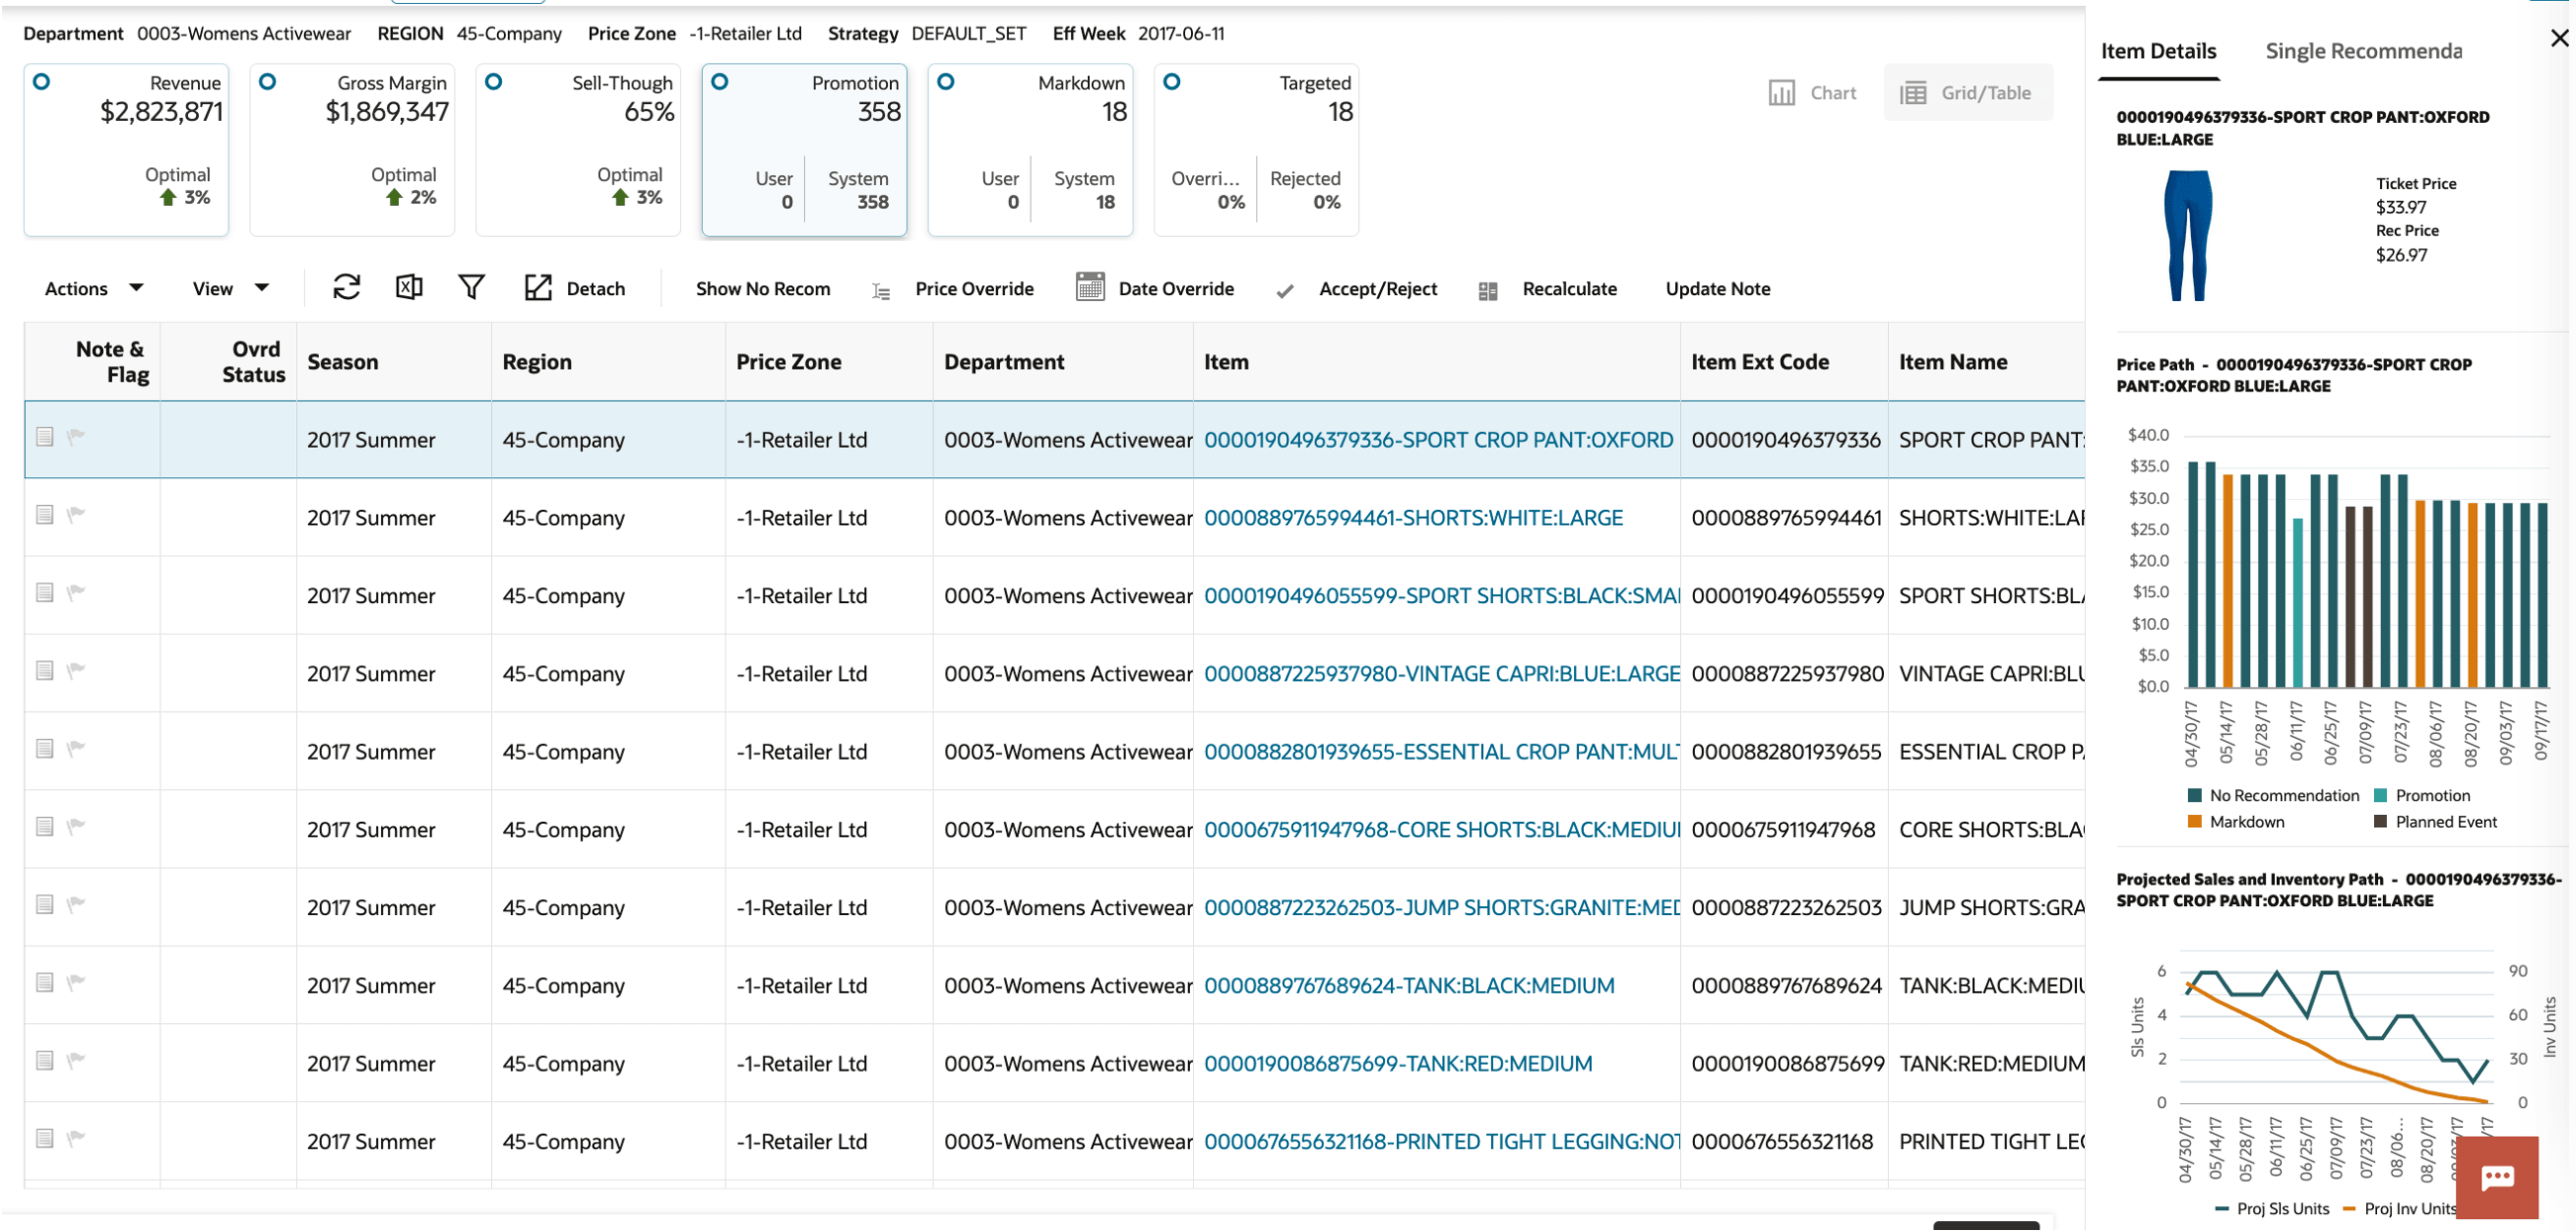
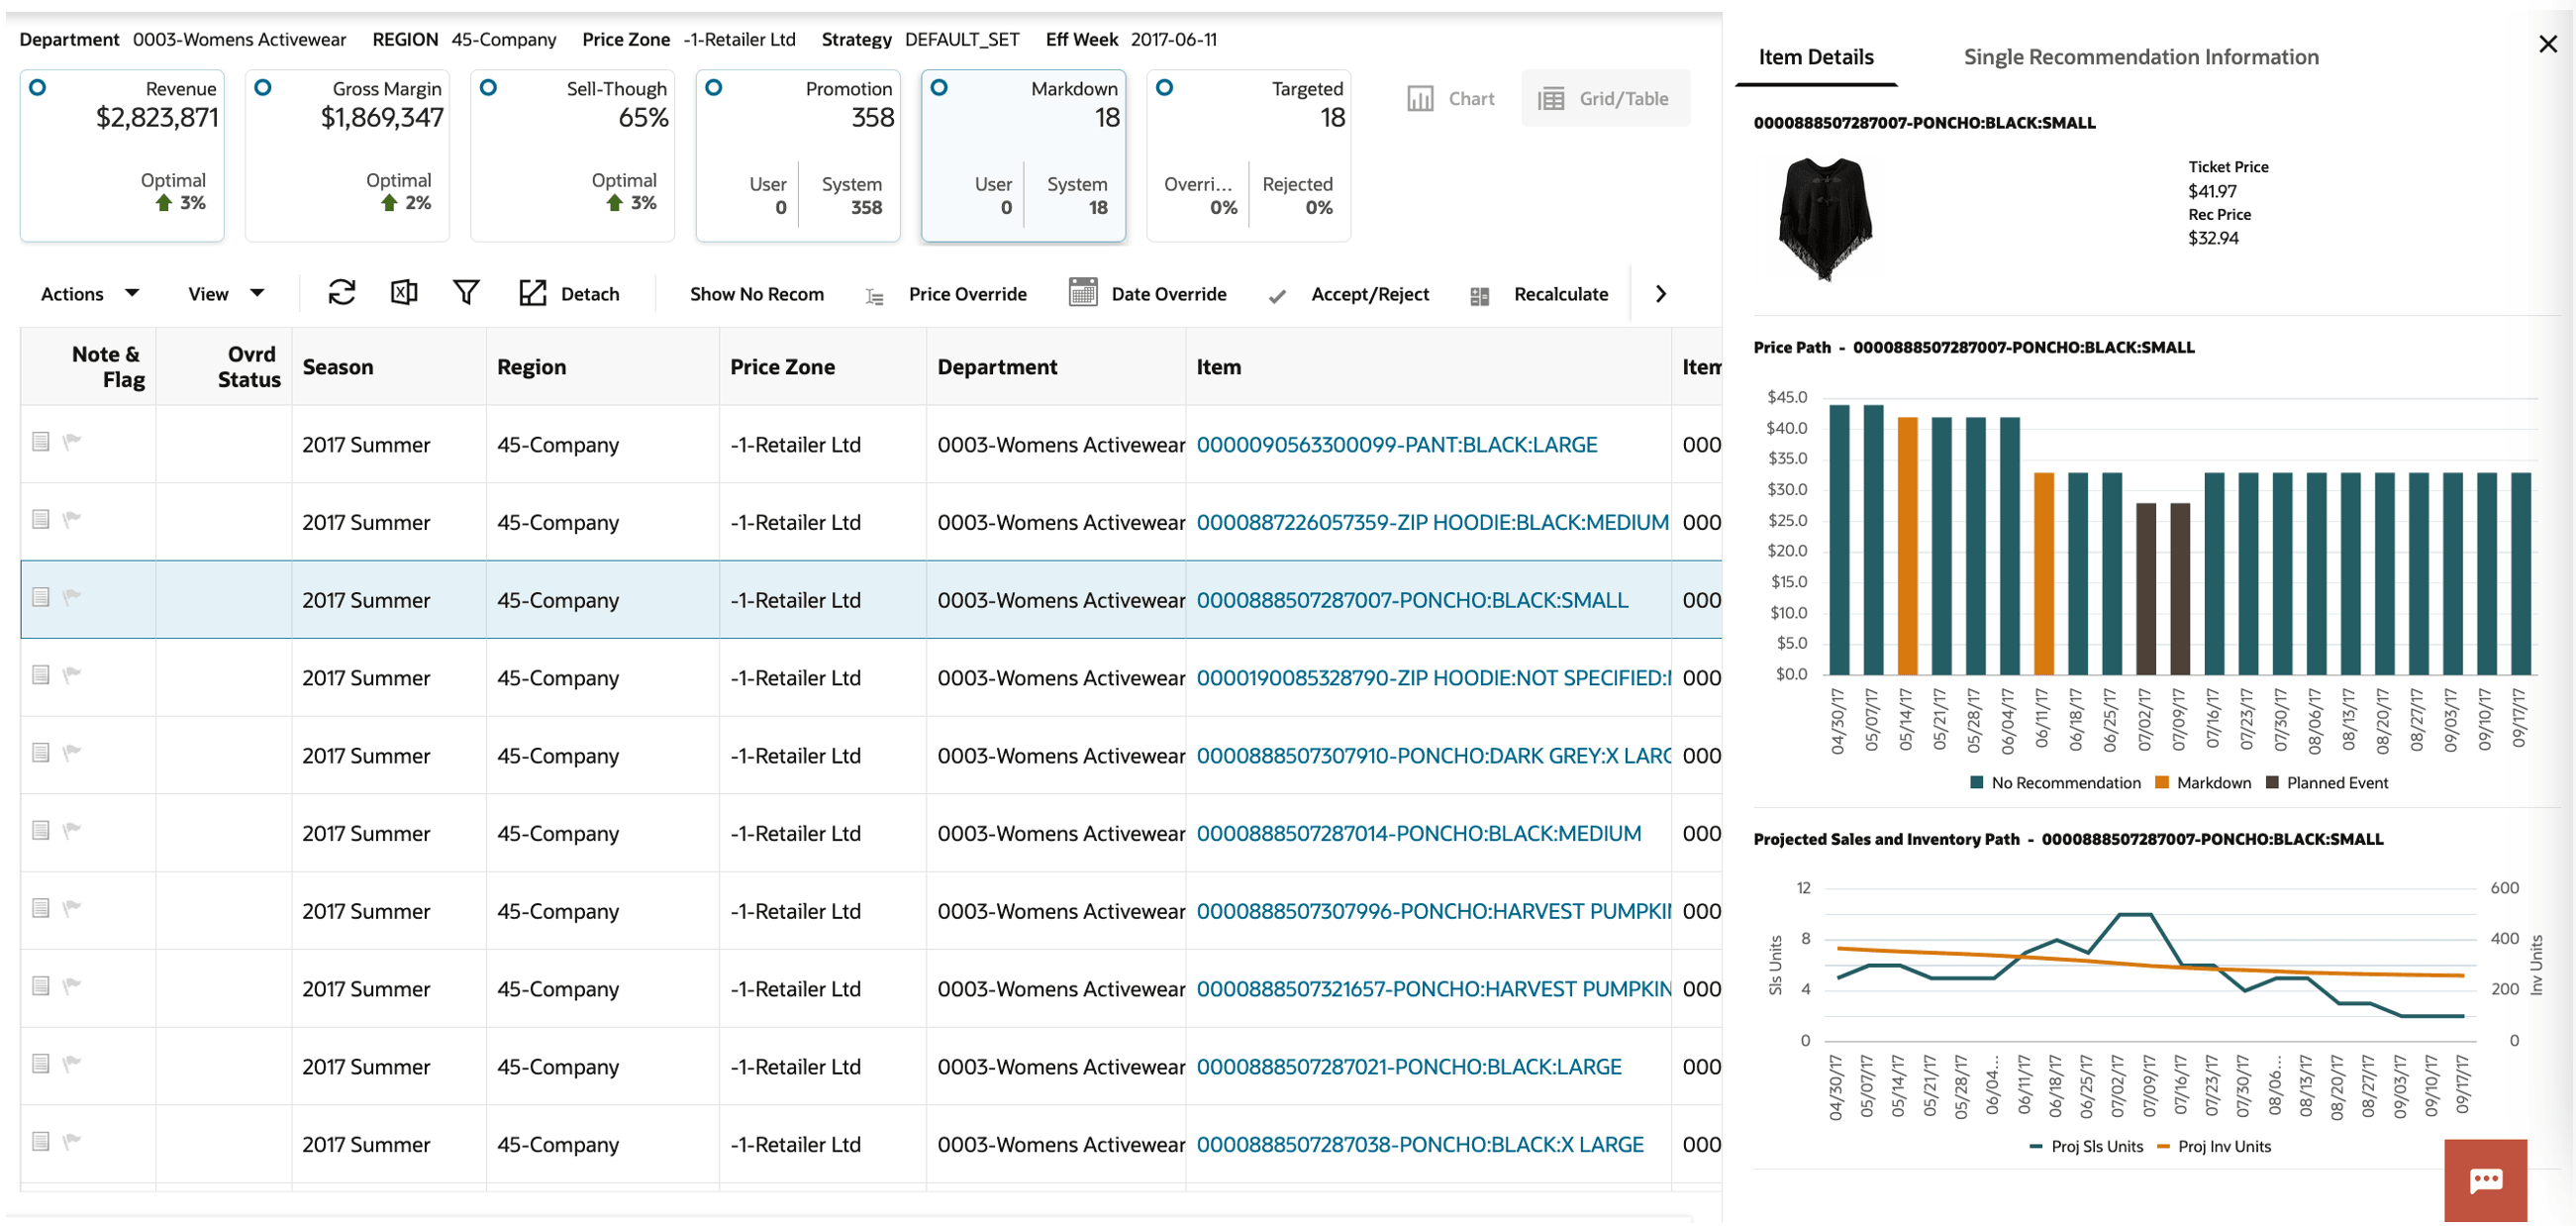
After the optimization run is complete and the run is in Ready for Review status, the results are displayed in the Results stage. In this stage, you can accept, reject, override any price recommendation, or add a promotion or markdown for non-recommended items. After you make substantive changes, you can recalculate all the projected metrics. The results are displayed in six tiles: Revenue Tile, Gross Margin Tile, Sell-Through Tile, Promotion Tile, Markdown Tile, and Targeted Tile.
Results - Chart, Grid, and Contextual Panel
Figure 5-24 Markdown/Promotion Results Chart (Revenue Tile)
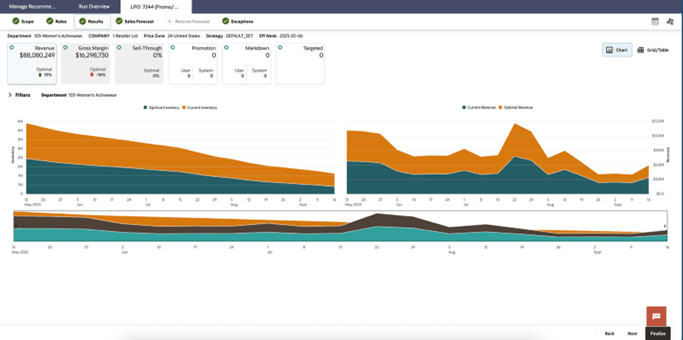
Figure 5-25 Results Grid and Table (Revenue Tile)
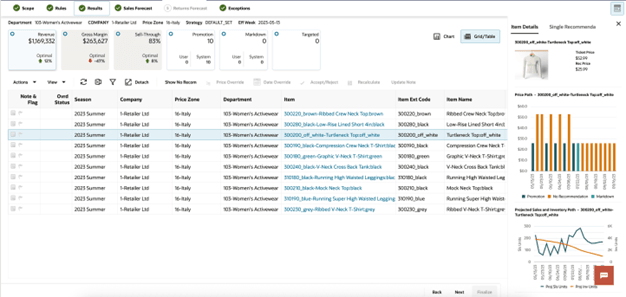
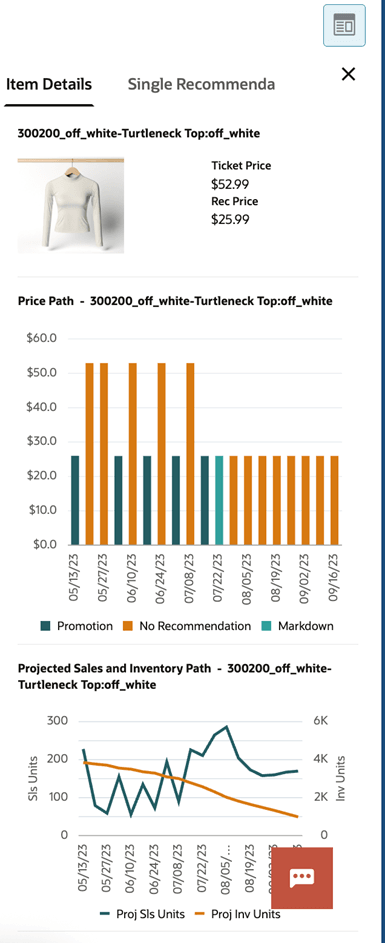
Figure 5-26 Results Contextual Panel
Results - Possible Actions
From the Results stage, you can:
-
Recalculate the projected metrics after making price overrides.
Revisit earlier stages in order to make changes to various settings and then re-optimize the run.
-
Leave the run in the optimization list without taking any actions. You cannot delete the run; you must be in Run Overview in order to delete a run.
-
Accept, reject, or override the price recommendation for the effective week for the recommendations that are in Ready for Review status.
Results - Revenue, Gross Margin, and Sell-Through Tiles
As shown in the following figure, the Revenue, Gross Margin, and Sell-Through tile displays the overall summary of the run in the form of tiles as well as in BI charts. Information displayed in this tile is non-editable.
-
Revenue. This is the projected revenue over the life of the items, assuming that you accept all recommendations. This is displayed in the local currency defined for the location of the run.
-
Revenue Optimal. This is the percentage gain or loss in revenue compared to staying at the current price for all items over a certain period.
-
Gross Margin. This is the projected gross margin over the life of the items, assuming that you accept all recommendations. This is shown in the local currency defined for the location of the run.
-
Gross Margin Optimal. This is the percentage gain or loss in gross margin, compared to staying at the current price for all items over a certain period.
-
Sell Through. This is the projected sell through at the end of the life, assuming that you accept all recommendations. This is shown as a percentage of initial inventory (or inventory at the beginning of the season).
-
Sell Through Optimal. This is the percentage gain or loss in end of life sell-through, compared to staying at the current price for all items over a certain period.
Figure 5-27 Revenue, Gross Margin, and Sell-Through Tiles

Results - Promotion Tile
This tile displays the promotion recommendations for the effective week selected. The tile shows the total number of system-recommended promotion recommendations (items) and the total number of user-added promotions (items).
Results - Markdown Tile
The Markdown Tile displays the markdown recommendations for the effective week selected. In the tile, it shows the total number of system markdown recommendations (items) and the total number of user-added markdowns (items).
Results - Targeted Tile
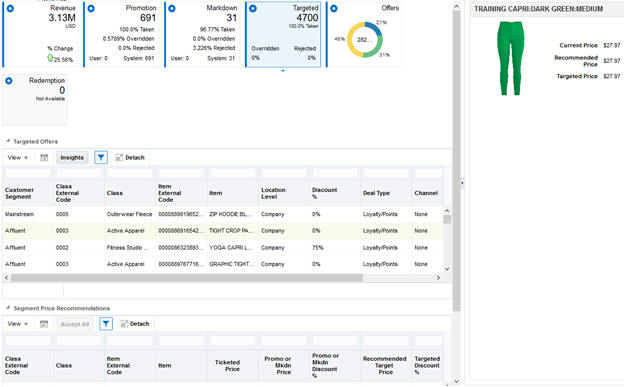
The Targeted Tile displays the targeted recommendations for the effective week selected. In the tile, it shows the total number of targeted recommendations (items), percentage of recommendations taken or accepted, percentage of recommendations overridden, and percentage of recommendations rejected.
Table 5-11 Targeted Tile Top Panel
| Field | Description |
|---|---|
| Channel | Channel (for example, Email, Mobile) associated with this item that result in a high redemption rate for this segment. |
| Class | Name of the class. |
| Customer Segment | Name of the customer segment. |
| Deal Type | Deal type (for example, Z% Off, Loyalty Points) associated with this item that result in a high redemption rate for this segment. |
| Discount % | Recommended discount percentage for the item. |
| Location | Name of the selected location. |
| Redemption Rate | Predicted redemption rate for this offer. |
You can select a class segment in the top targeted offers panel. The bottom Segment price recommendations panel is then populated with all the item level price recommendations for this effective week at the customer segment level. You can override the targeted price recommendations in this panel.
Table 5-12 Targeted Tile Bottom Panel
| Field | Description |
|---|---|
| Accepted | You can uncheck or check the box to denote whether to accept or reject the targeted recommendation. When the recommendation is rejected, it reverts to location-level price recommendation or override. |
| Class | Name of the class. |
| Item | Description of the item. |
| Price Type | Denotes whether the price recommendation is regular, markdown, promotion, or targeted. |
| Promo or Markdown Discount % | Price recommended by the optimization. |
| Promo or Markdown Price | |
| Recommended Target Price | |
| Targeted Amount | This is calculated as the amount spent due to the discount offered multiplied by the projected sales units at the item-level. This is the amount given towards targeted offers. |
| Targeted Discount % | You can click the box, and it displays a price ladder assigned for that item. You can select a price from the price ladder. |
| Targeted Price Override | |
| Ticket Price | Current ticket price of the item. |
Markdown/Promotion - Sales Forecast
The Sales Forecast tile displays the following information across all LPO runs for the next effective date.
-
The pie chart displays the various price changes recommended by the LPO system for the effective date.
-
The center content of the pie chart displays the percentage of items/products receiving a forecast.
The notification bar on the right displays the same information as the Sales Forecast tile for the most recent successful runs. For each run in the notification bar, the top left corner displays the run ID, and the bottom left corner displays the Location and Department for the run.
The sales forecast overview table displays the run information corresponding to the run ID from LPO, along with additional metrics such as item count, forecast sales units, returns units, total buy, and projected end of life sell thru.
From the sales forecast run overview table, you can select an individual run by clicking the run name. This opens a new tab, Sales Forecast Details - Run id < ID#>, with three sub-tabs: Summary, Review Forecast, and Customer Segment.
Sales Forecast - Summary
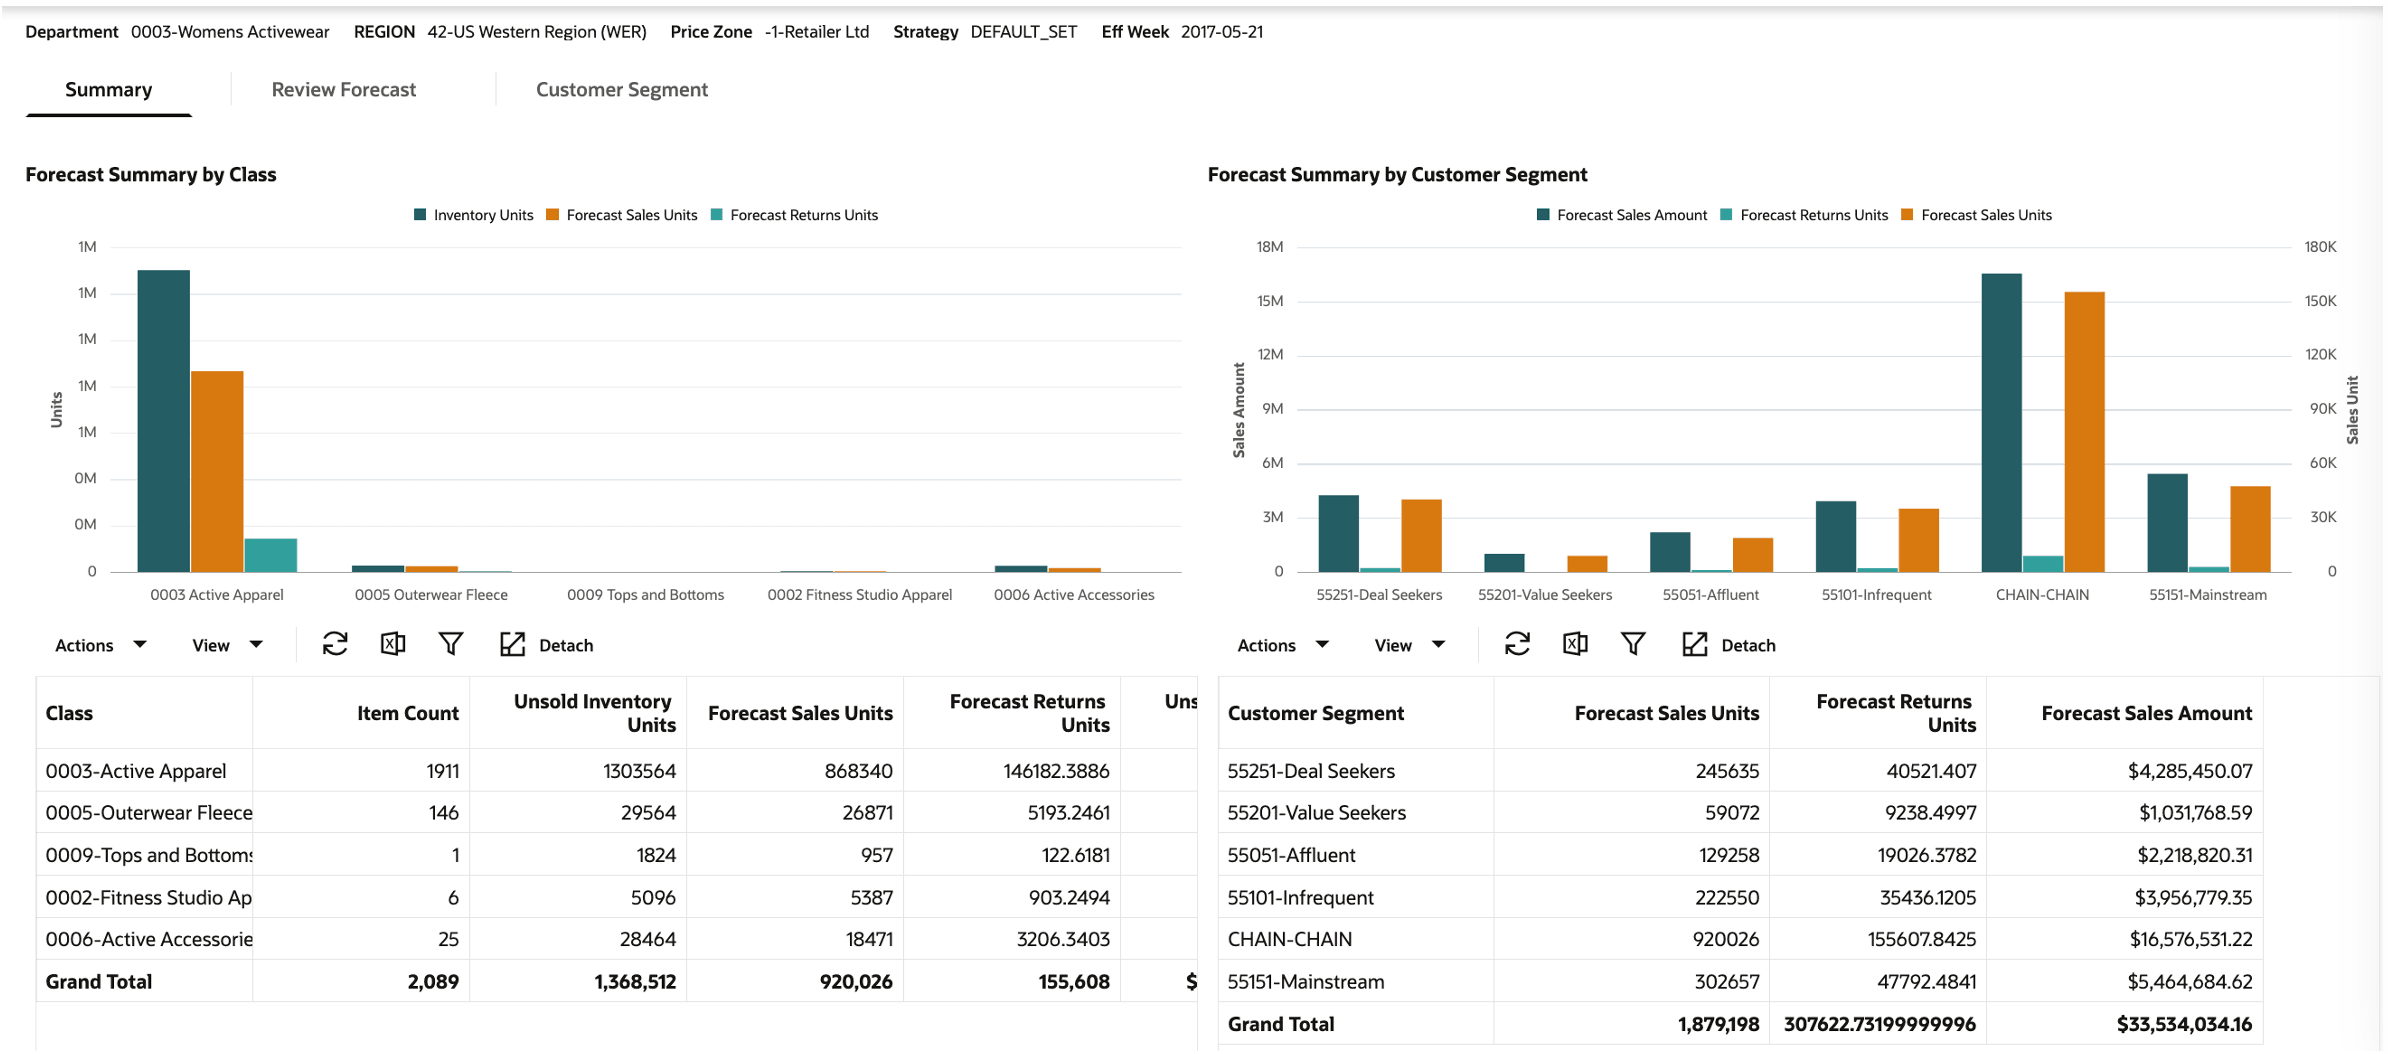
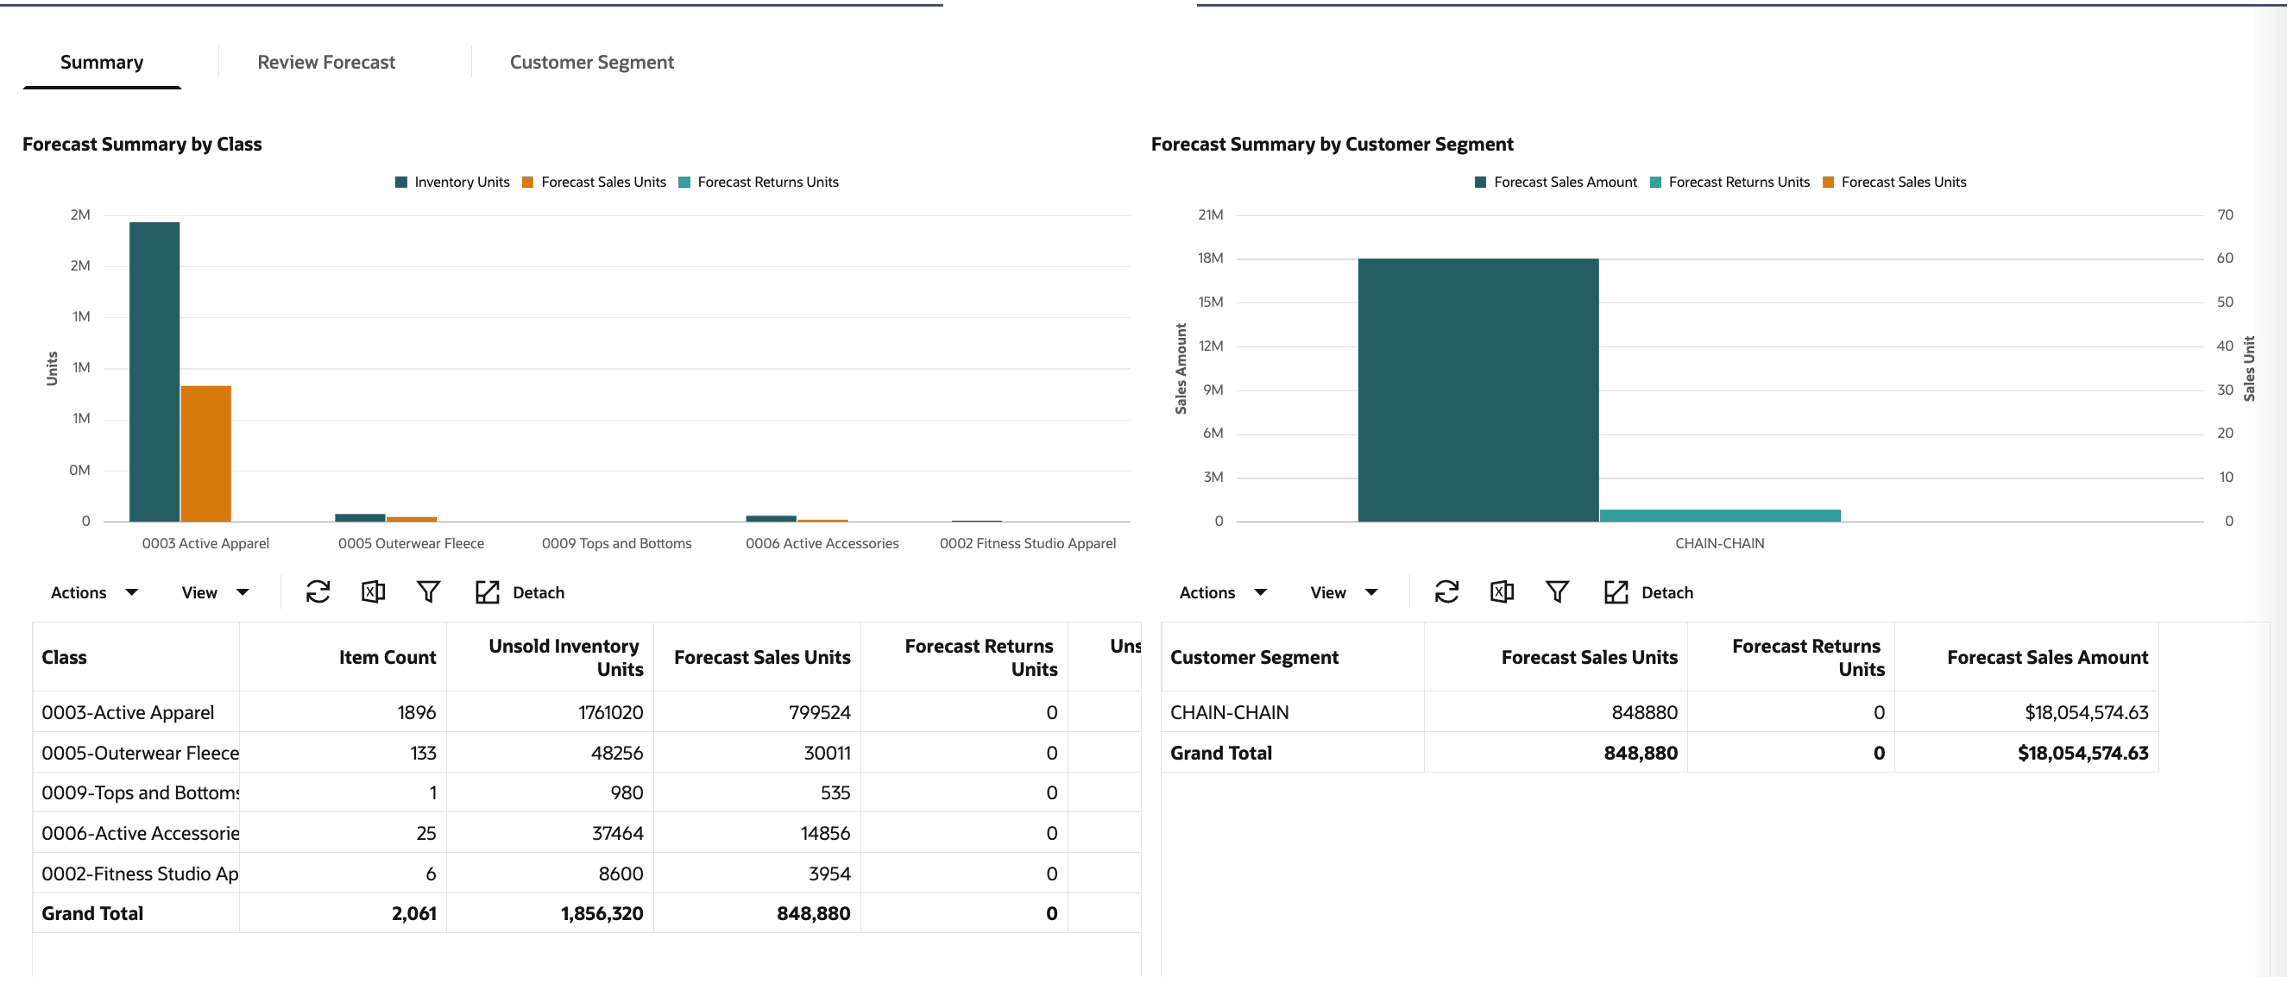
The Summary tab, shown in the following figure, displays additional details at the class level and customer segment level for the selected run ID. It provides aggregate metrics by class and customer segment.
The Summary tab has the following three components:
-
Chart for forecast summary by class. This displays the following metrics by class: Inventory units, Forecast sales units, and Forecast return units. The forecast horizon represents all weeks in the future until the exit date for a product.
-
Inventory units represent the total number of unsold inventory units the optimization system is trying to clear, based on the latest sales and inventory information for the run.
-
Forecast sales units is the sum of the forecast sales units over the entire forecast horizon.
-
Forecast return units is the sum of all future expected returns over the entire forecast horizon.
-
-
Table for forecast summary by class. In addition to the metrics displayed in the chart, the following metrics are displayed in the table: item count, unsold inventory value, and forecast sales amount.
-
Item count is the number of products in the class.
-
Inventory value is the total value of unsold inventory units that the optimization system is trying to clear, based on the latest sales and inventory information for the run.
-
Forecast sales amount is the sum of the forecast sales amount over the entire forecast horizon.
-
-
Table for forecast summary by customer segment. This displays the forecast sales units, forecast sales amount, and forecast returns unit by customer segment.
Sales Forecast - Review Forecast
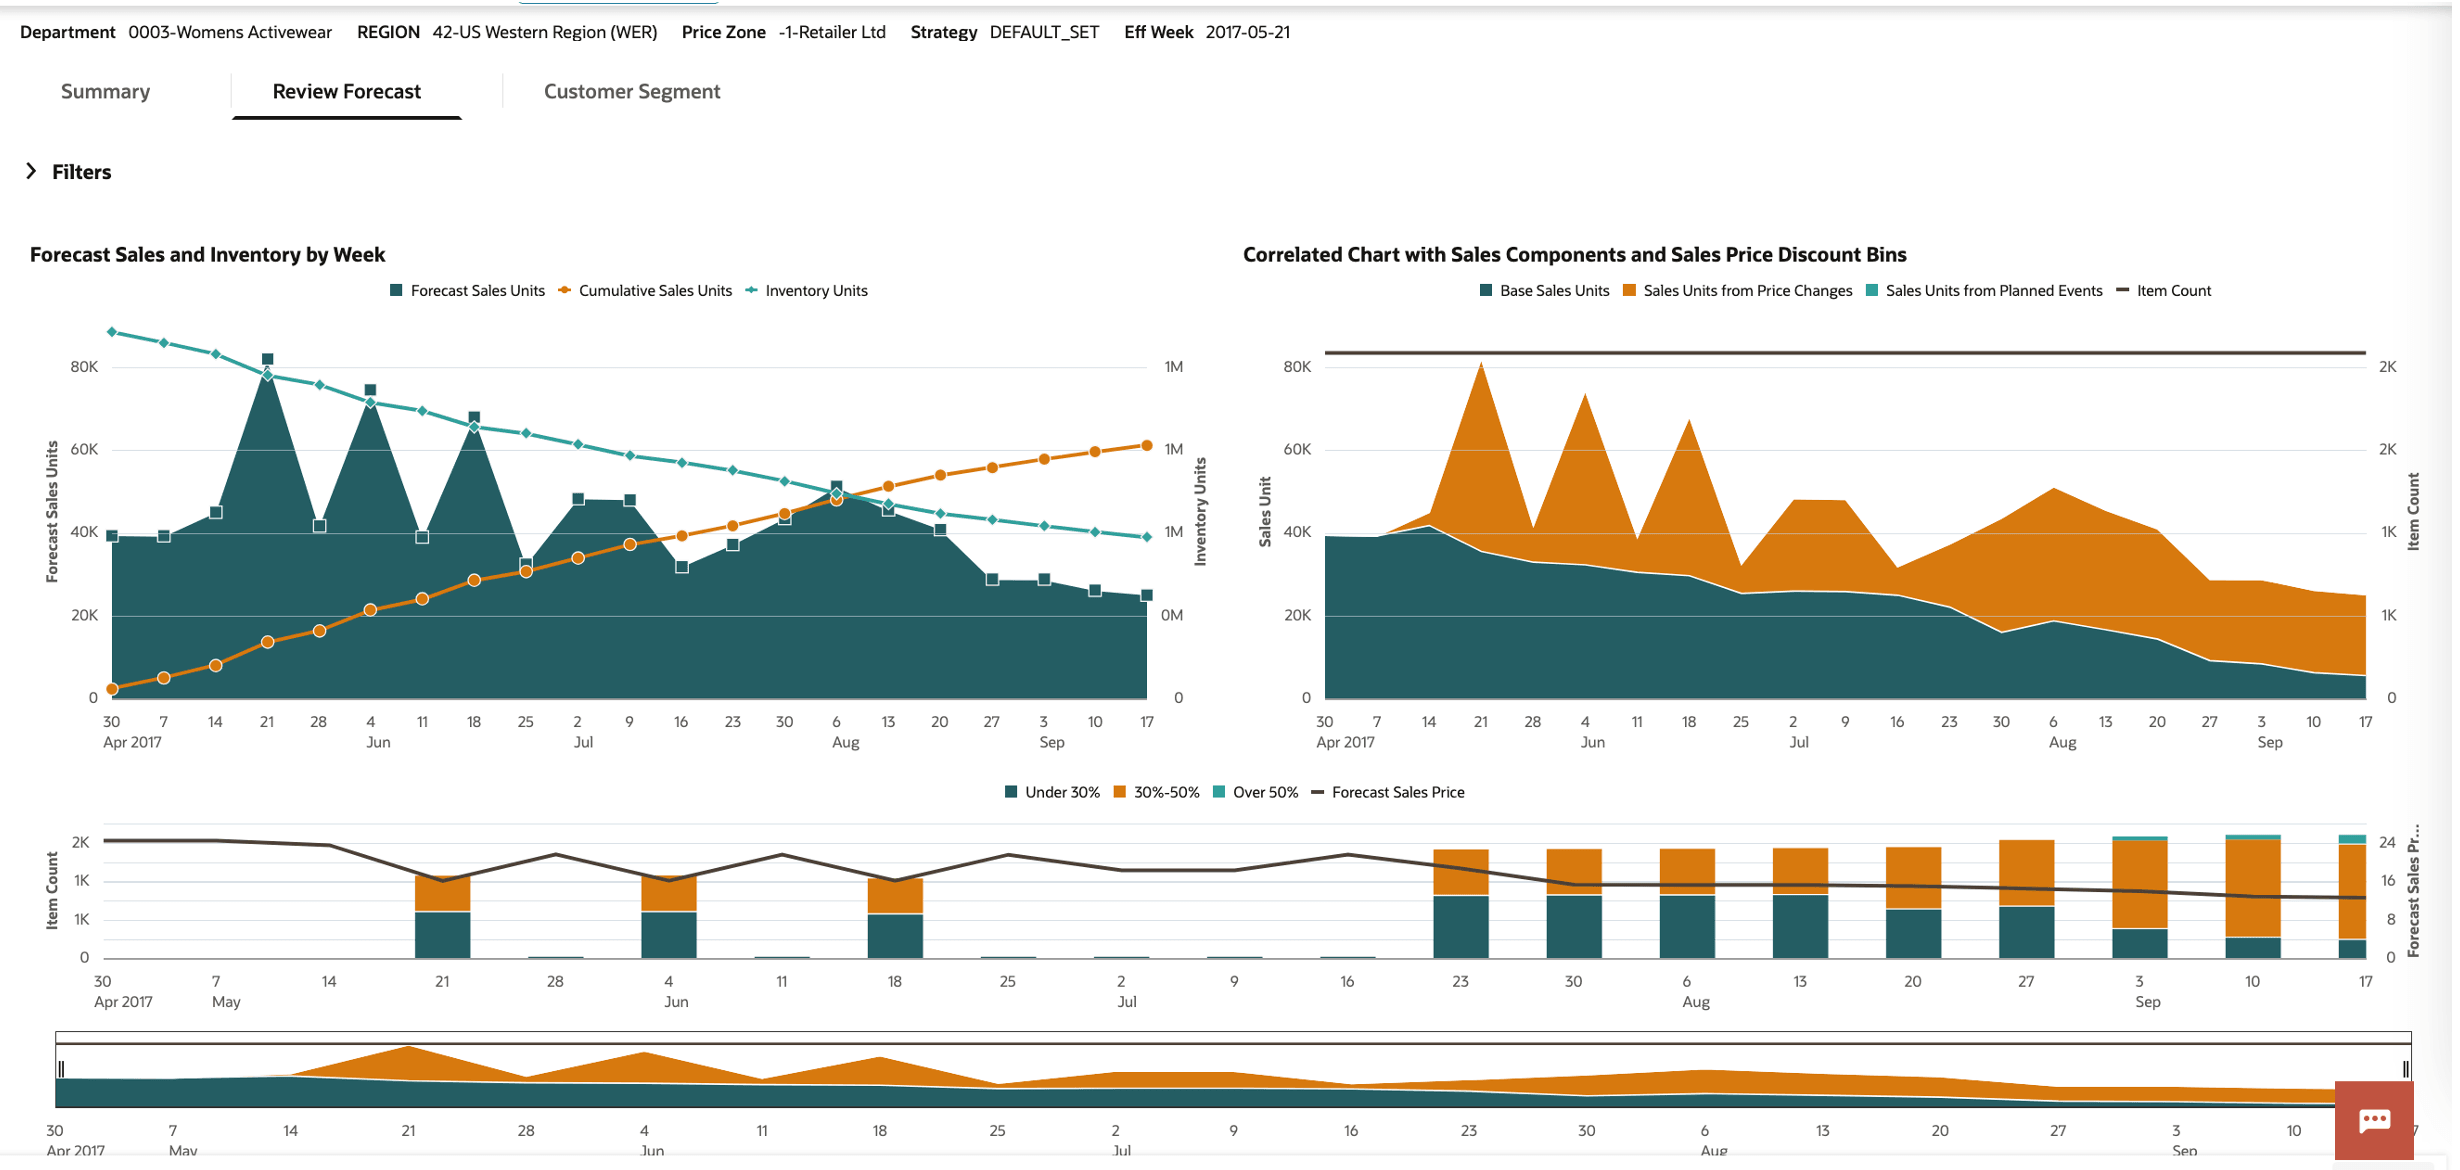
The Review Forecast tab, shown in the following figure, is used to view the forecast information at the week level. It displays a breakdown of the sales forecast into multiple components such as base sales units, sales units from price cuts and sales units from promotion events, and the count of products at various discount levels. This tab displays information for the selected merchandise and customer segment.
Figure 5-33 Sales Forecast - Review Forecast Tab
Description of "Figure 5-33 Sales Forecast - Review Forecast Tab"
You can review the forecast information for the selected merchandise and customer segment combination. By default, this chart shows the information at the department level for the merchandise hierarchy and across all customer segments. Use the Filters to display and select a specific merchandise and customer segment.
All the merchandise levels below the Lifecycle Pricing Optimization run level can be selected. In this example, you see Class, Subclass, Style, Color, and Size. The selection of merchandise using the filters follows a hierarchical path. First, select a specific class. Then, click Apply to review the information for this class or choose a specific subclass within the class and click Apply. After selecting a specific subclass, you can choose the styles within the subclass, and so on.
The Review Forecast tab has the following three components:
-
Chart for forecast sales and inventory by week, as shown in the above figure.
-
Forecast sales units, Inventory units, and Cumulative sales units by week for the merchandise and customer segment selection made in the filters.
-
-
Correlated chart with sales components and discount bins, as shown in the above figure.
-
It breaks down the forecasted sales units into the following components:
-
Base sales units: future sales at the current ticket price.
-
Sales units from price changes: additional sales units driven by recommended price changes (that is, promotions and markdowns).
-
Sales units from planned events: additional sales units driven by traffic associated with planned promotion/holiday event.
-
-
It shows the breakdown of items into various discount bins for each week. Discount bins are calculated using the forecast sales price and full price.
-
The bottom window of the chart is used to select the time frame used for displaying the top two charts. Use this to focus on the relevant weeks when the forecast horizon is long.
-
-
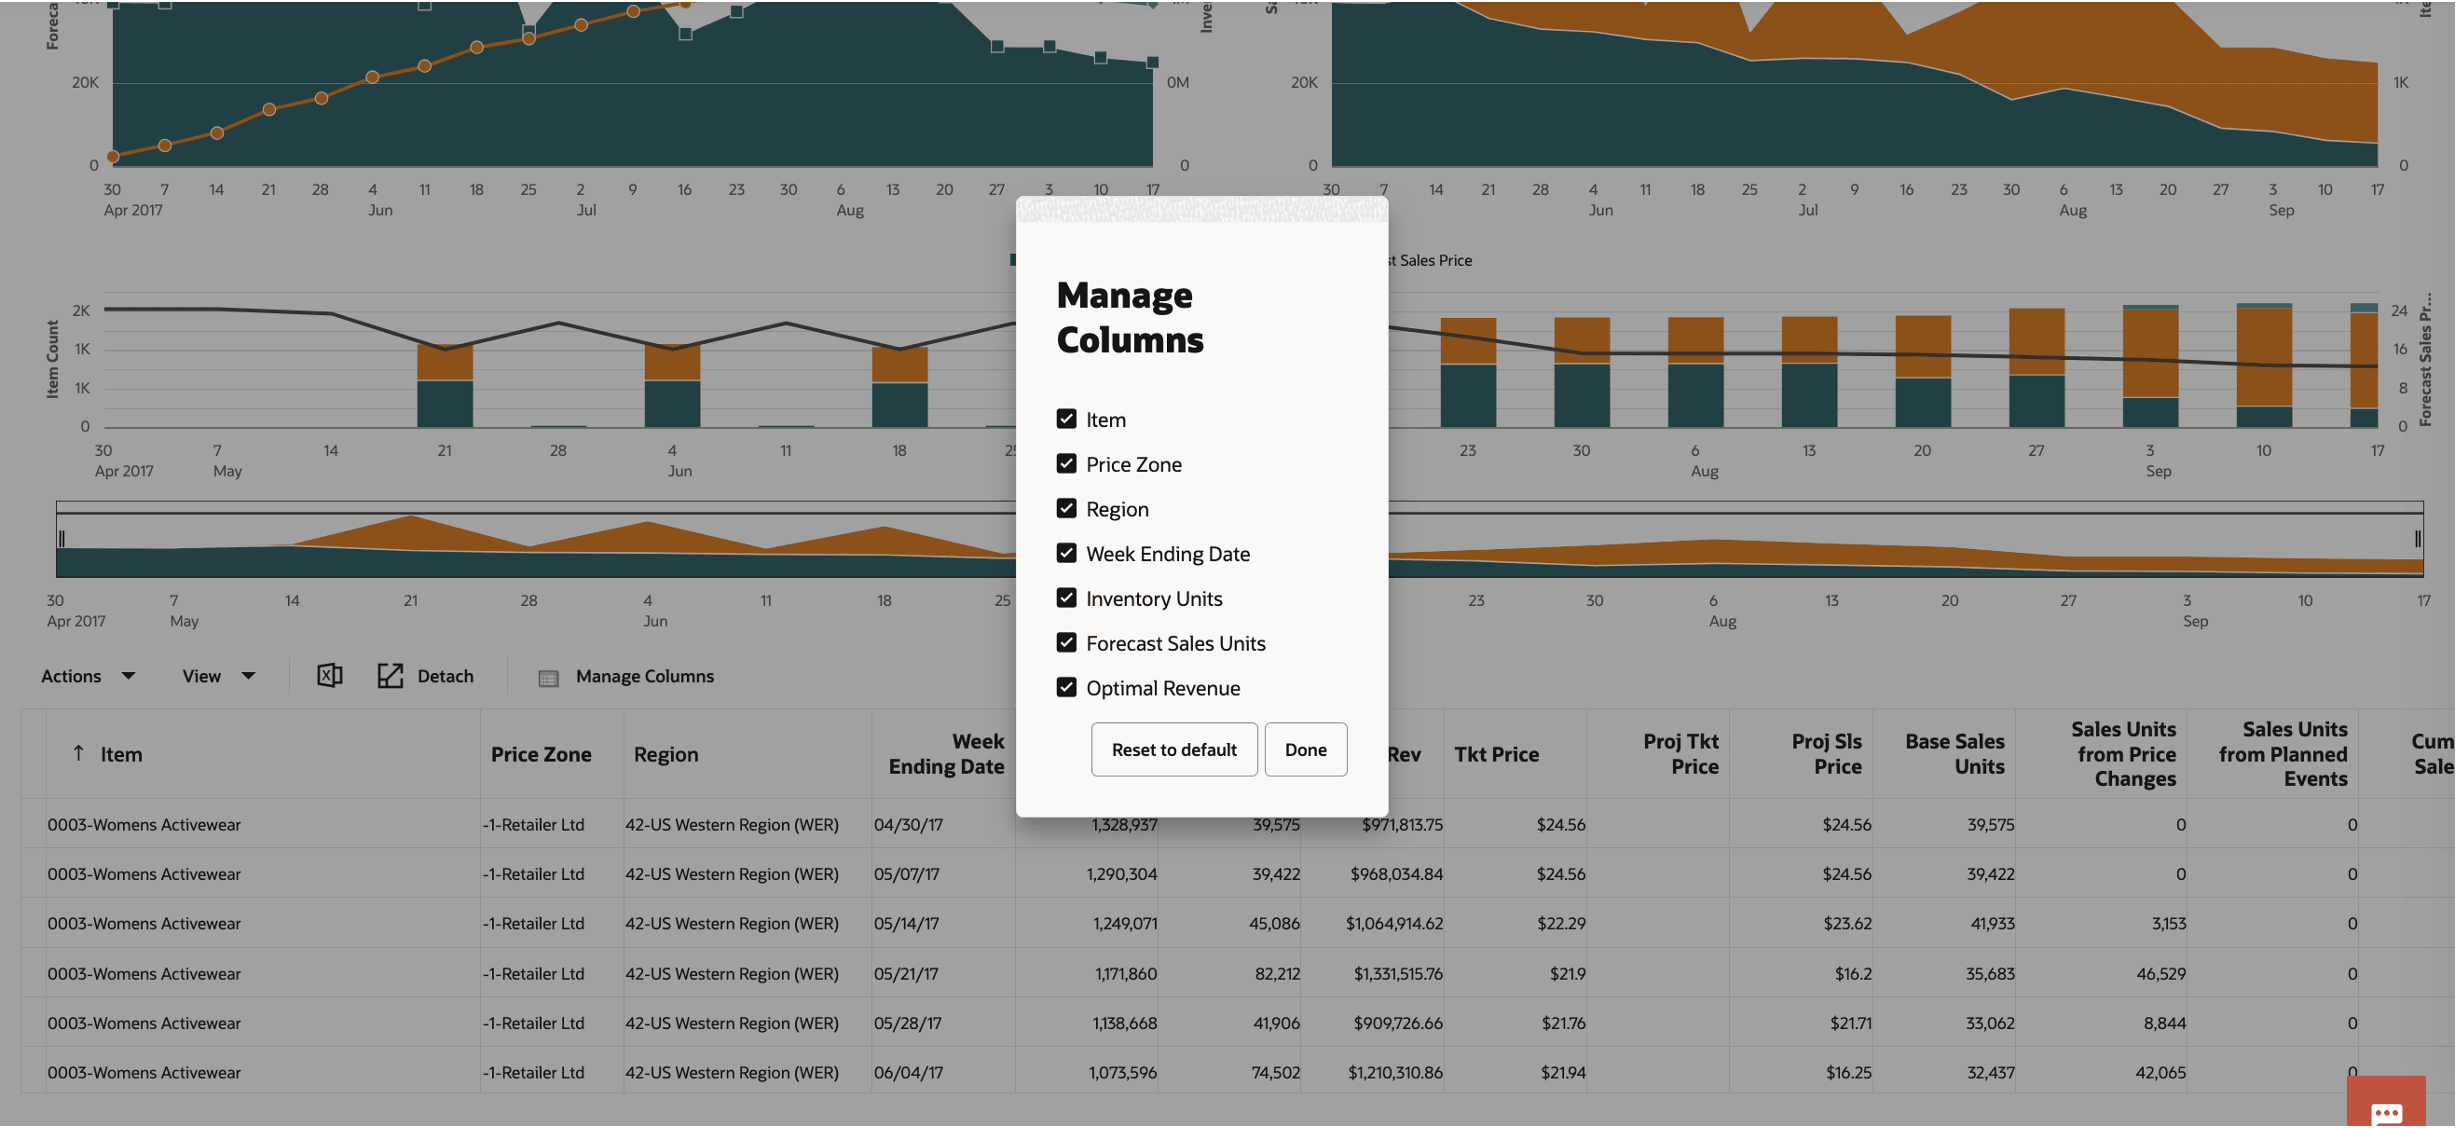
Table with weekly sales inventory and revenue metrics, as shown in the following figure, can be used to:
-
Examine the weekly metrics displayed in the charts, as shown in the following two figures.
-
Use Manage columns, shown in the second of the following two figures, to select the metrics displayed in the table.
-
Use the Detach button to expand the table into a pop-up window for ease of use.
-
Figure 5-34 Sales Forecast - Review Forecast Table

Description of "Figure 5-34 Sales Forecast - Review Forecast Table"
For details on calculations, see Appendix: Promotion and Markdown Review Forecast.
Figure 5-35 Sales Forecast - Review Forecast Table - Manage Columns
Description of "Figure 5-35 Sales Forecast - Review Forecast Table - Manage Columns"
Sales Forecast - Customer Segment
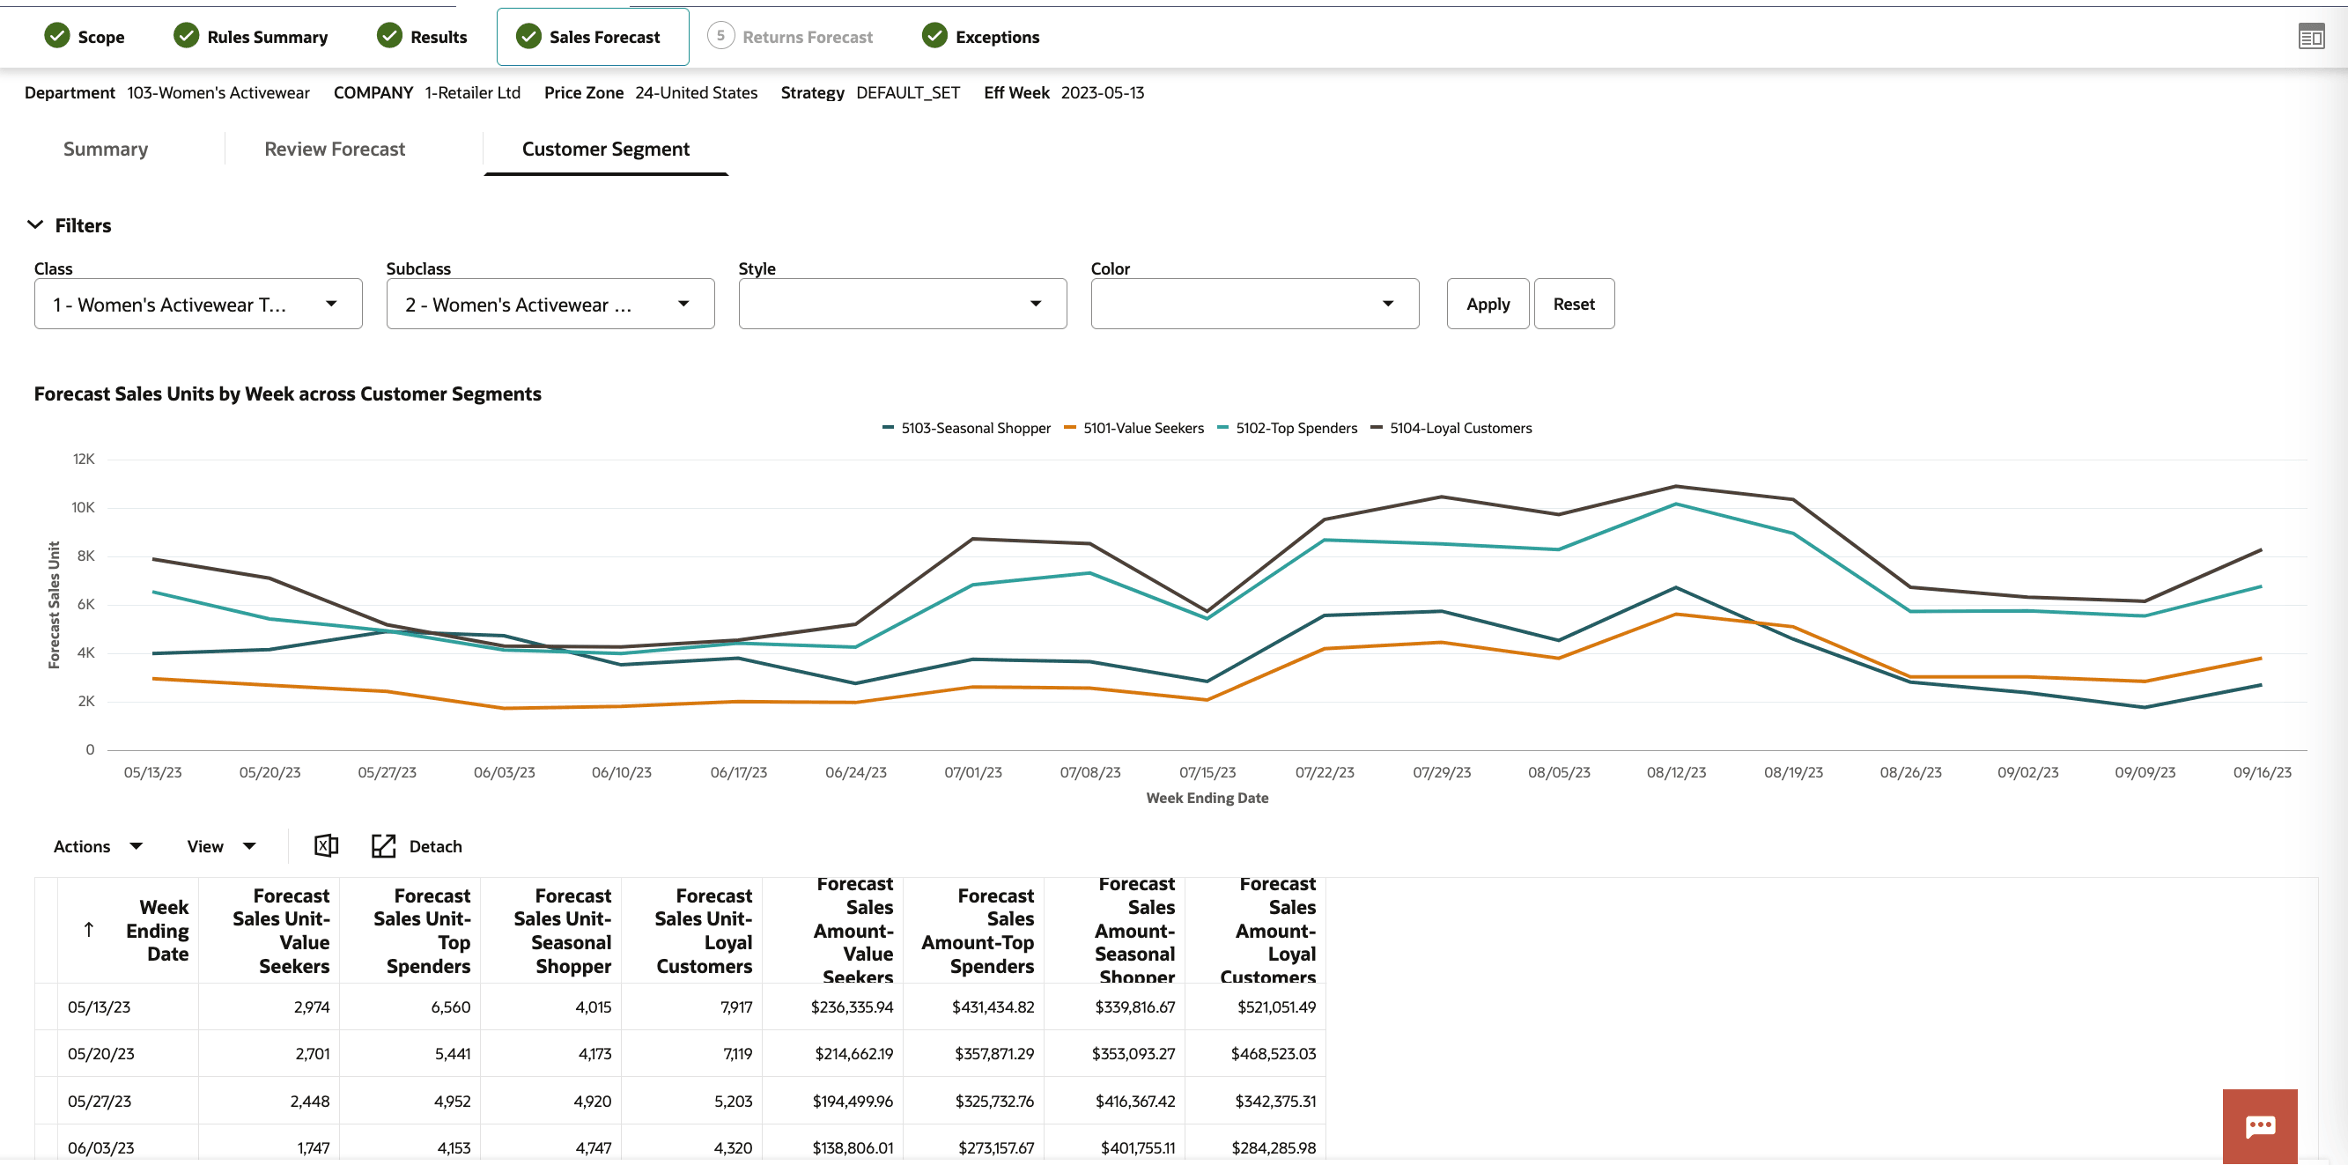
The Customer Segment tab, shown in the following figure, is used to compare the sales trends across the various segments.
Figure 5-36 Sales Forecast - Customer Segment Tab
Description of "Figure 5-36 Sales Forecast - Customer Segment Tab"
Use this tab to compare the sales trends across various customer segments. Similar to the Forecast review tab, you can view the customer segment comparison for selected merchandise. The filtering functionality for merchandise works in the same way as in the Forecast review. In the chart, individual customer segments can be selected and un-selected by clicking on the legend. The chart is rescaled automatically based on the new selection, as shown in the following figure. Rescaling is useful for reviewing patterns for customer segments with low sales volume.
Figure 5-37 Sales Forecast - Customer Segment Rescaling Based on New Selection
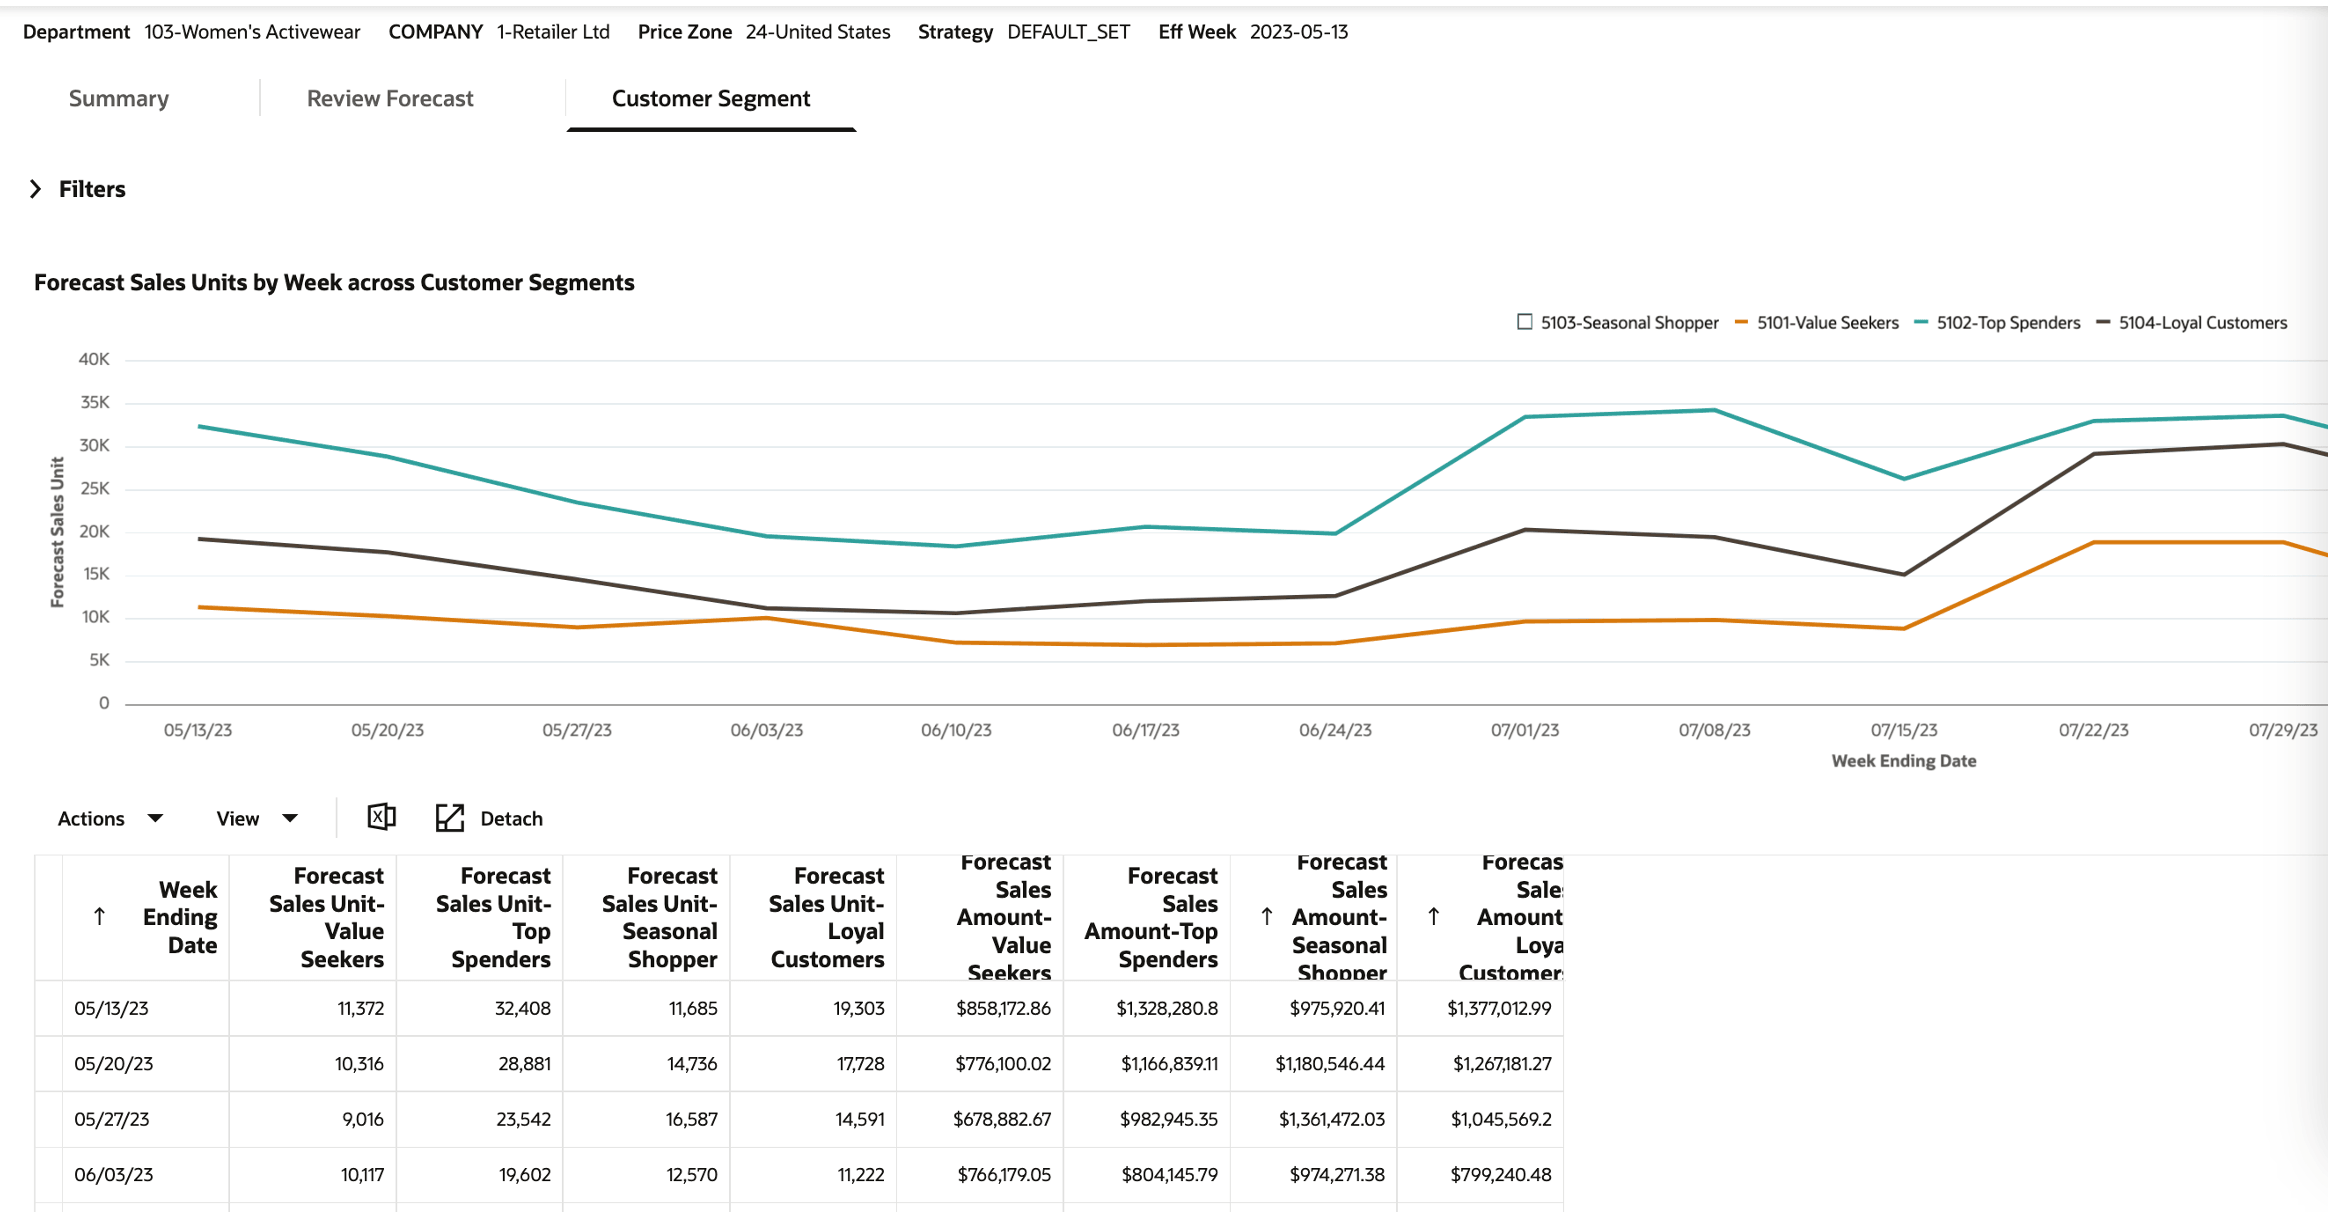
Description of "Figure 5-37 Sales Forecast - Customer Segment Rescaling Based on New Selection"
Markdown/Promotion - Returns Forecast
The Returns Forecast tab is used to view the return forecast information at the week level.
Returns Forecast - Summary
The Summary tab, shown in the following figure, displays additional details at the class level and customer segment level for the selected run ID. It provides aggregate metrics by class and customer segment.
Figure 5-38 Returns Forecast - Summary Tab
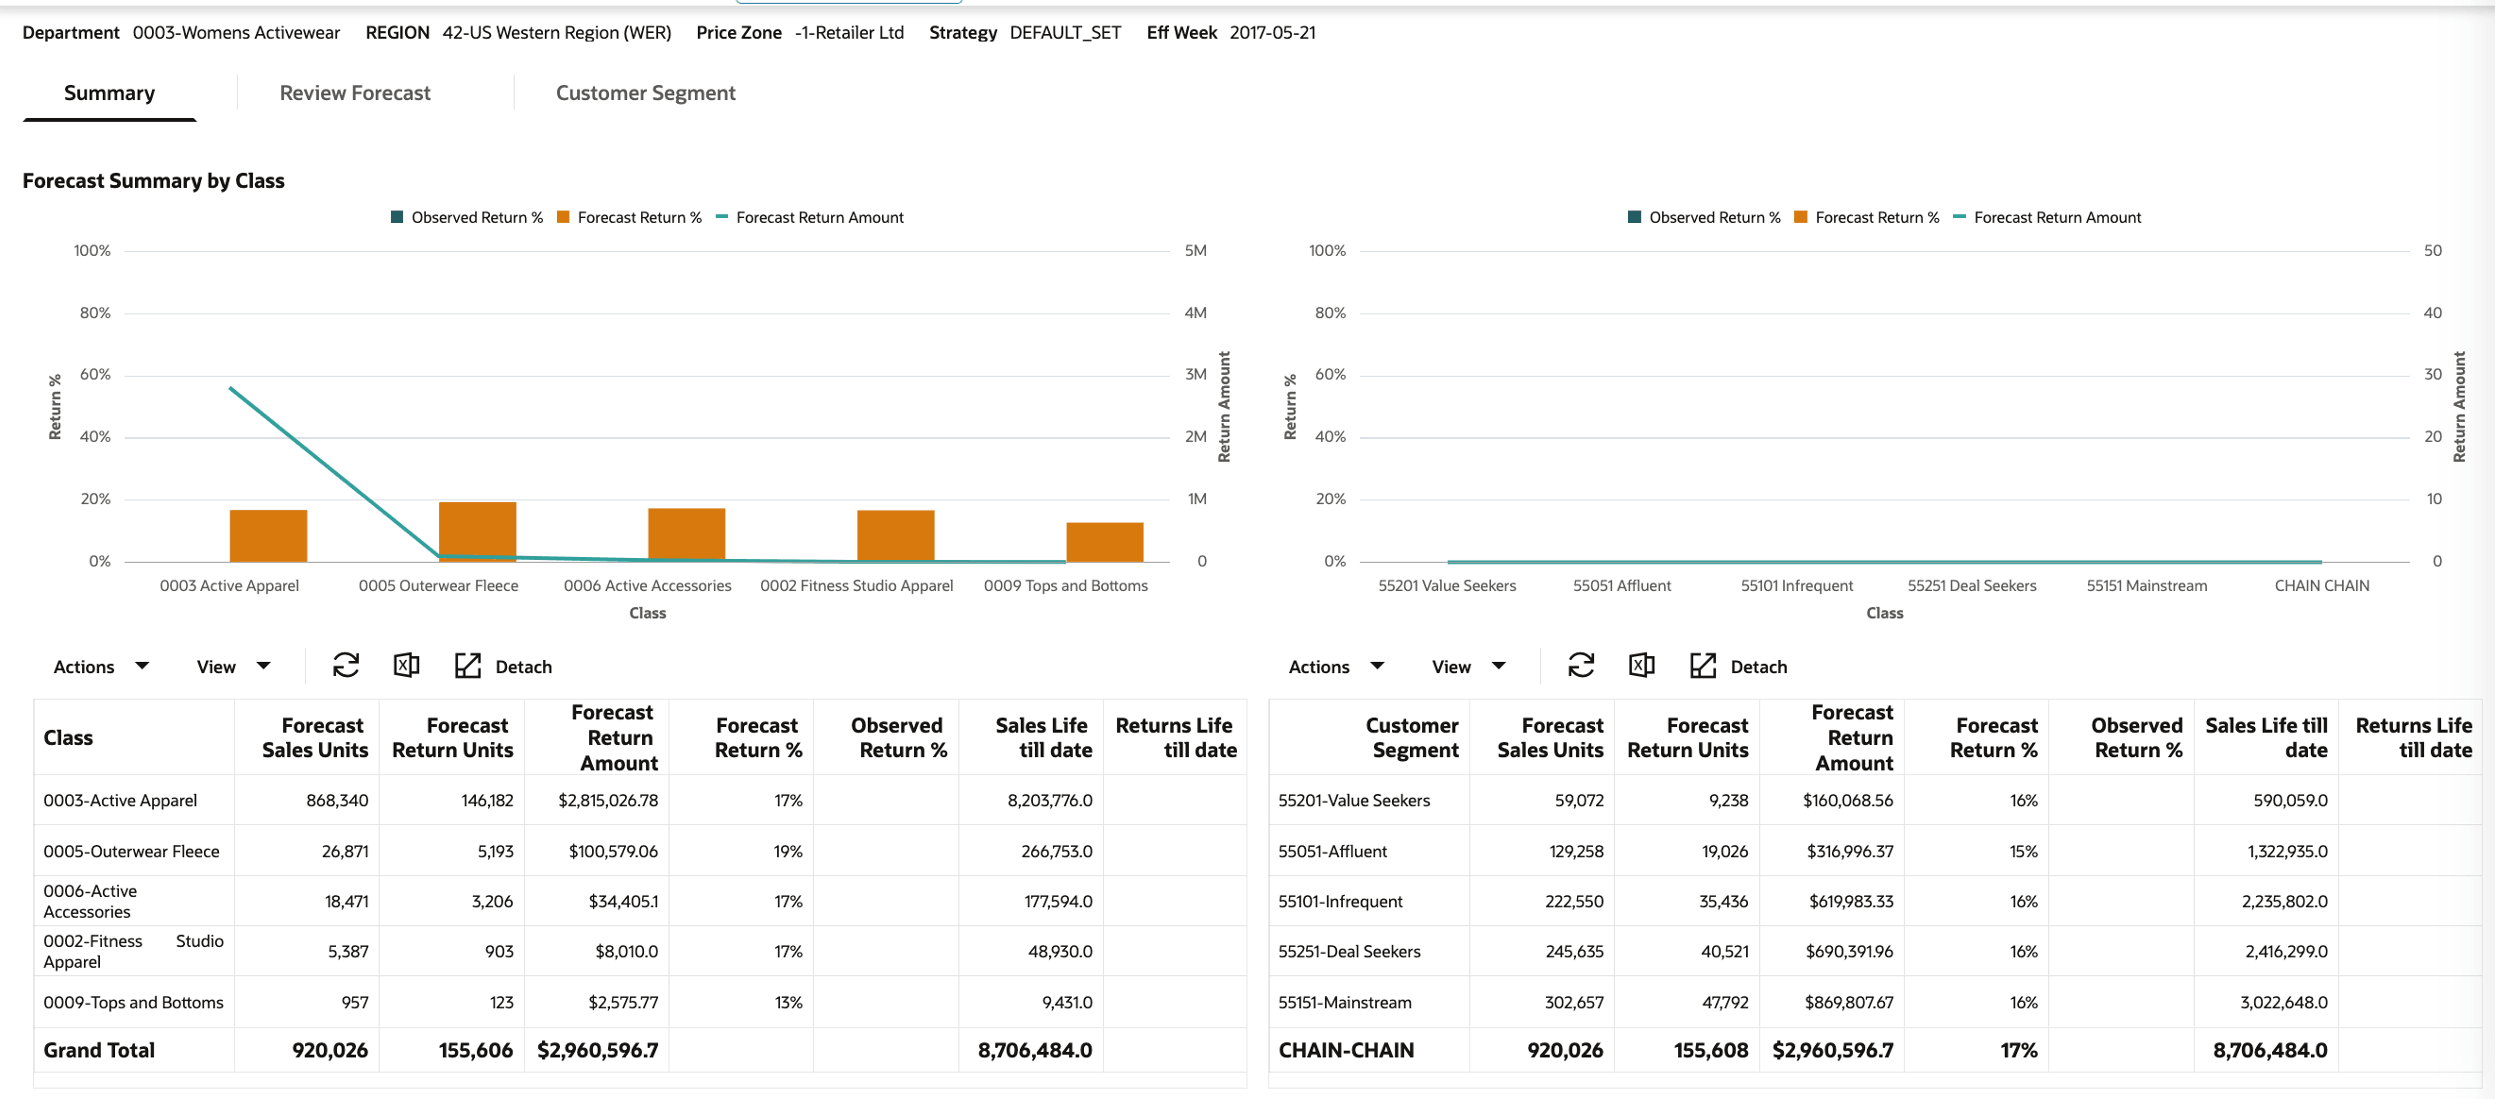
Description of "Figure 5-38 Returns Forecast - Summary Tab"
The Summary tab has the following three components
-
Chart for returns summary by class. This displays the following metrics by class across the entire forecast horizon: forecast return % and forecast return amount. The forecast horizon represents all weeks in the future until the exit date for a product.
-
Forecast return % represents the ratio of sum of forecast returns units over the entire forecast horizon across all products to sum of forecast sales units over the entire forecast horizon across all products in the class.
-
Forecast return amount represents the total value of the returned merchandise over the entire forecast horizon across all products in the class.
-
-
Table for returns summary by class. In addition to the metrics displayed in the chart, the following metrics are displayed in the table for every class: forecast sales units, forecast return units, sales units' life till date, returns life till date, and observed return %.
-
Forecast sales units is the sum of forecast sales units over the entire forecast horizon across all products.
-
Forecast return units is the sum of forecast return units over the entire forecast horizon across all products.
-
Sales units life till date is the sum of actual sales units from the first sale date until the most recent week with sales data across all products.
-
Returns life till date is sum of actual return units from the first sale date until the most recent week with sales data across all products.
-
Observed return % is the ratio of returns life till date to Sales units life till date.
-
-
Table for returns summary by customer segment. This displays the following metrics by customer segment: forecast sales units, forecast return units, forecast return amount, forecast return %, sales units' life till date, returns life till date, and observed return %.
Returns Forecast - Review Returns
The Review Returns tab is used to view the returns information for the selected merchandise and customer segment.
You can review the returns information for the selected merchandise and customer segment combination. By default, this chart shows the information at the department level for the merchandise hierarchy and across all customer segments. Use the Filters to display the available options to select a specific merchandise and customer segment. Filtering works in the way that it does in the Review forecast tab, where the merchandise selection is made in the order of the merchandise hierarchy.
The Review Forecast tab has the following four components:
-
Chart for forecast sales and returns by week.
Figure 5-39 Returns Forecast - Review Returns Tab
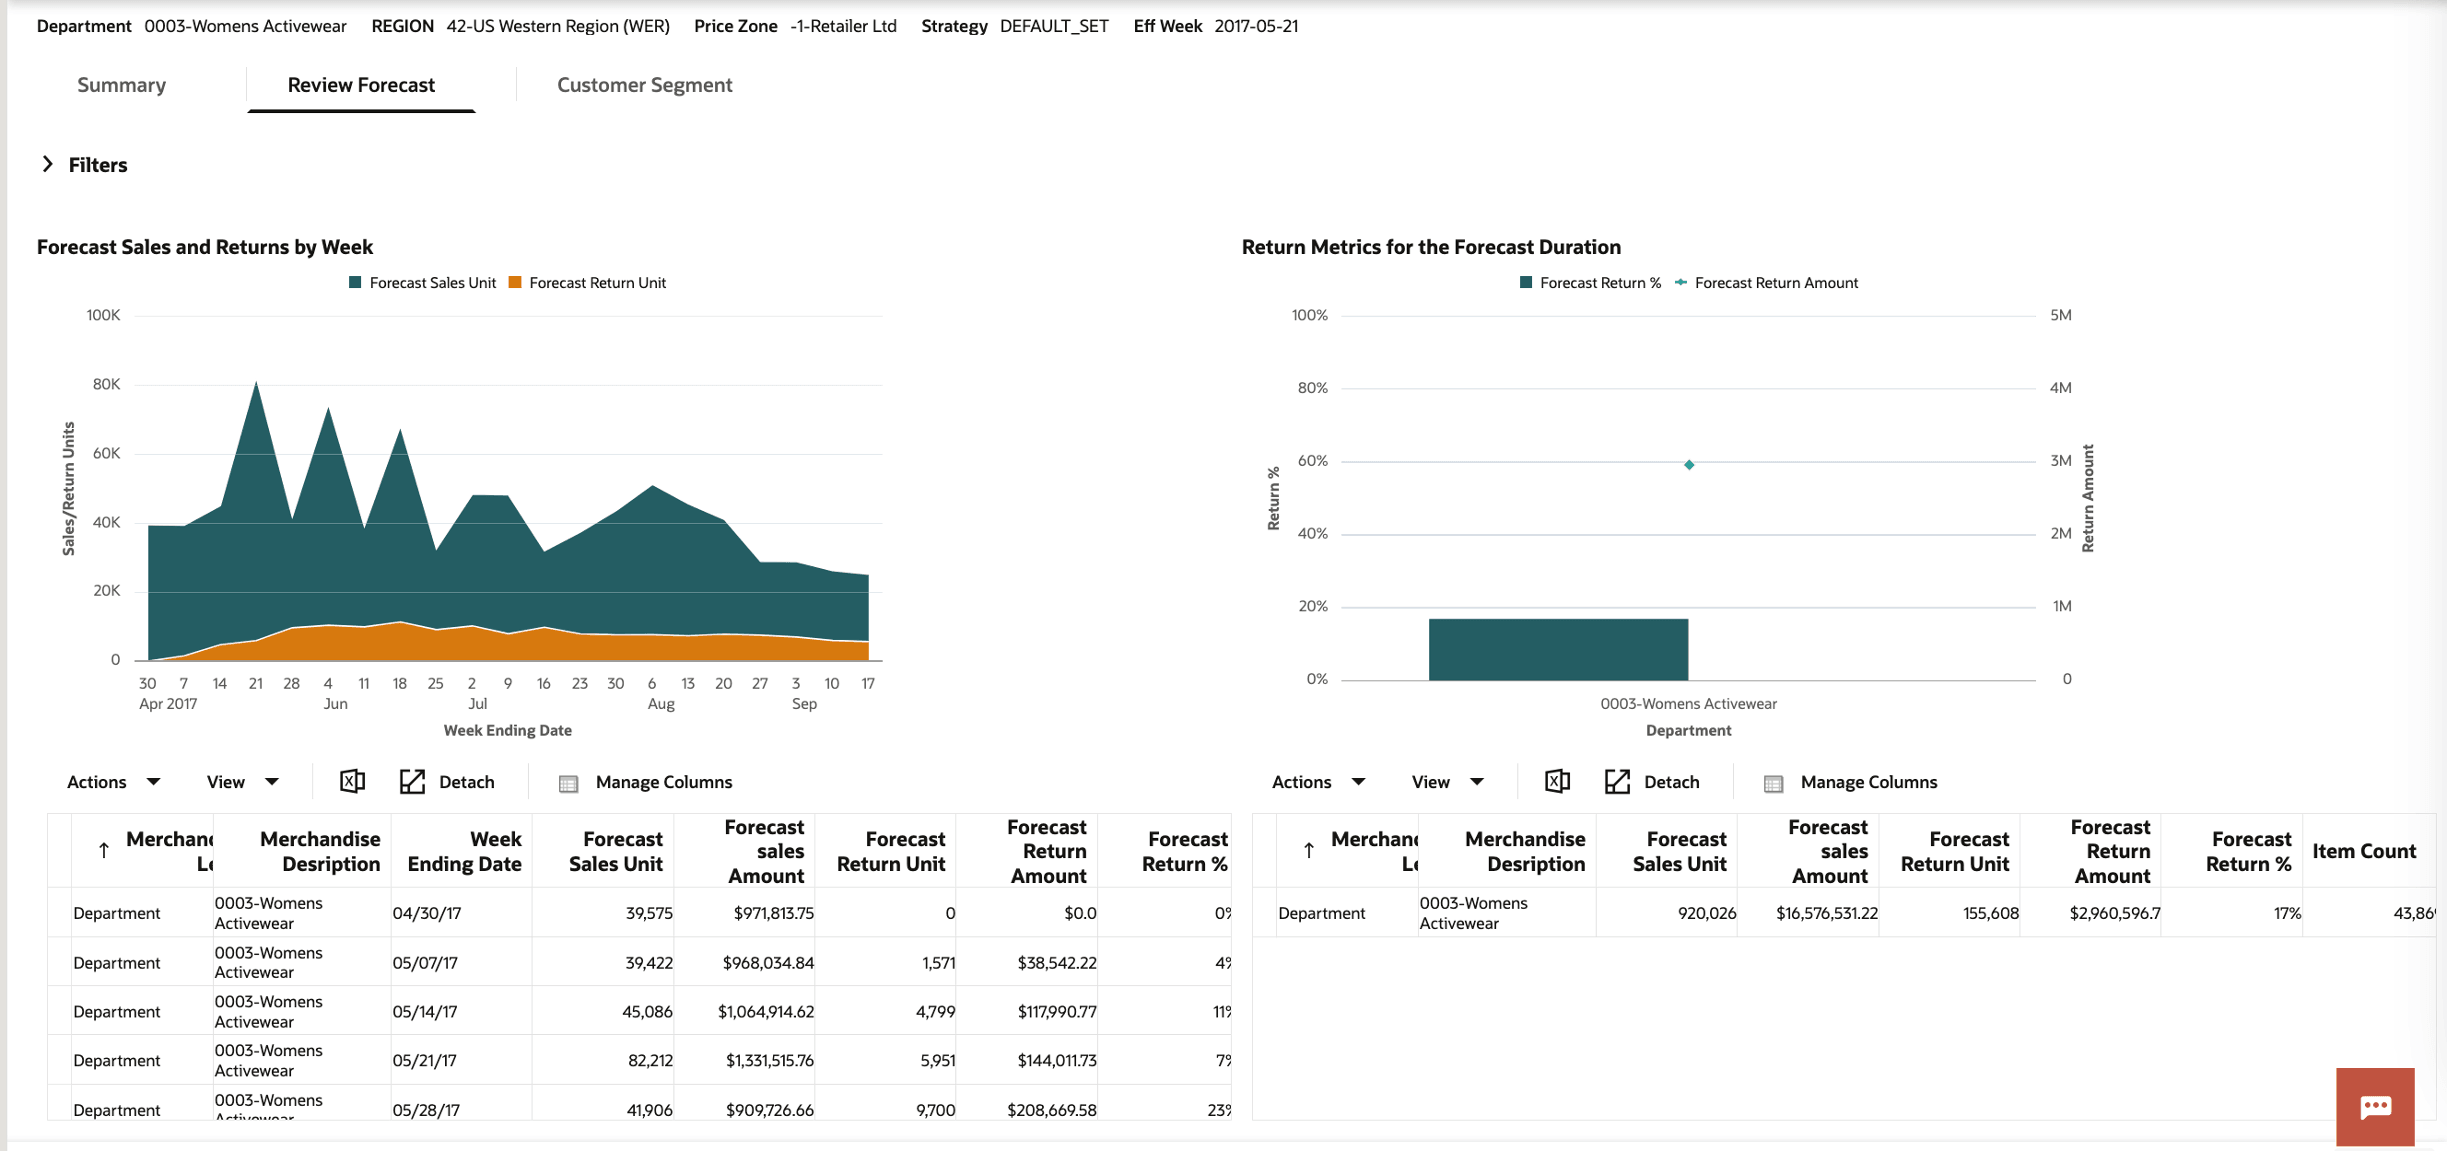
It displays aggregate forecast sales units and forecasted returns units by week for the merchandise and customer segment selection.
-
Chart to compare the return percentage and return amount across merchandise.
Figure 5-40 Returns Forecast - Compare Return Metrics
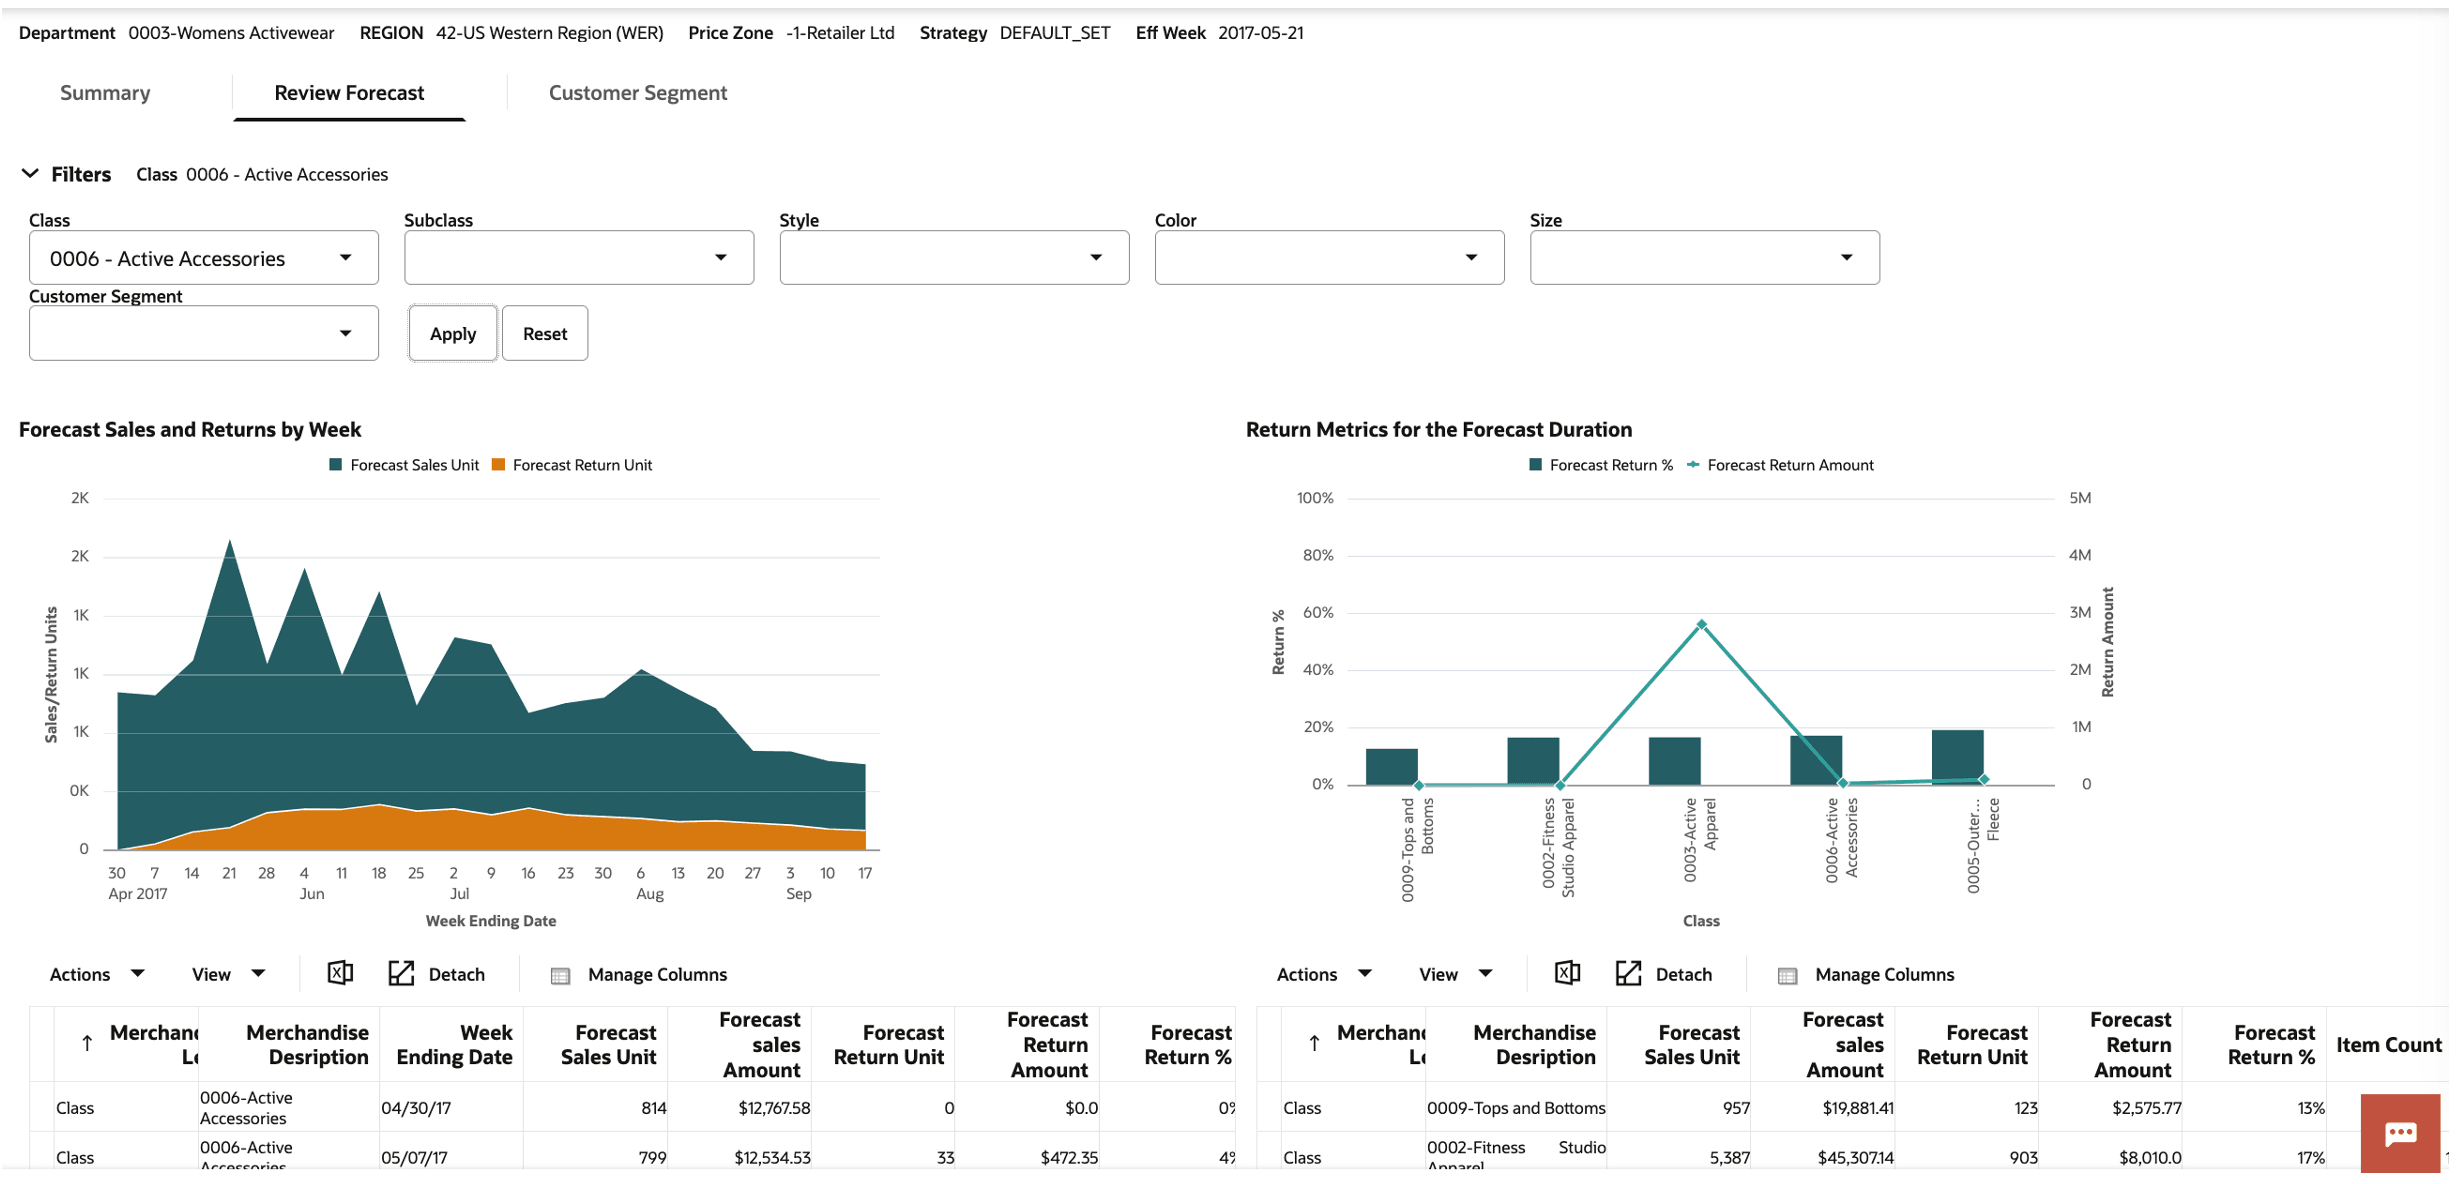
Description of "Figure 5-40 Returns Forecast - Compare Return Metrics"-
Displays the forecast return % and forecast return amount for the selected merchandise along with other merchandise under the same parent. For example, when class 0009 tops and bottoms are selected, this chart displays the above metrics for all classes within the department corresponding to 0009 tops and bottoms.
-
The forecast return % is the ratio of the sum of forecast returns units over the entire forecast horizon across all products to the sum of forecast sales units over the entire forecast horizon across all products from the selected merchandise and customer segment.
-
The forecast return amount is the total value of the returned merchandise over the entire forecast horizon across all products in the selected merchandise and customer segment.
-
-
Table with forecast sales and returns by week.
Figure 5-41 Returns Forecast - Review Sales and Returns by Week Table
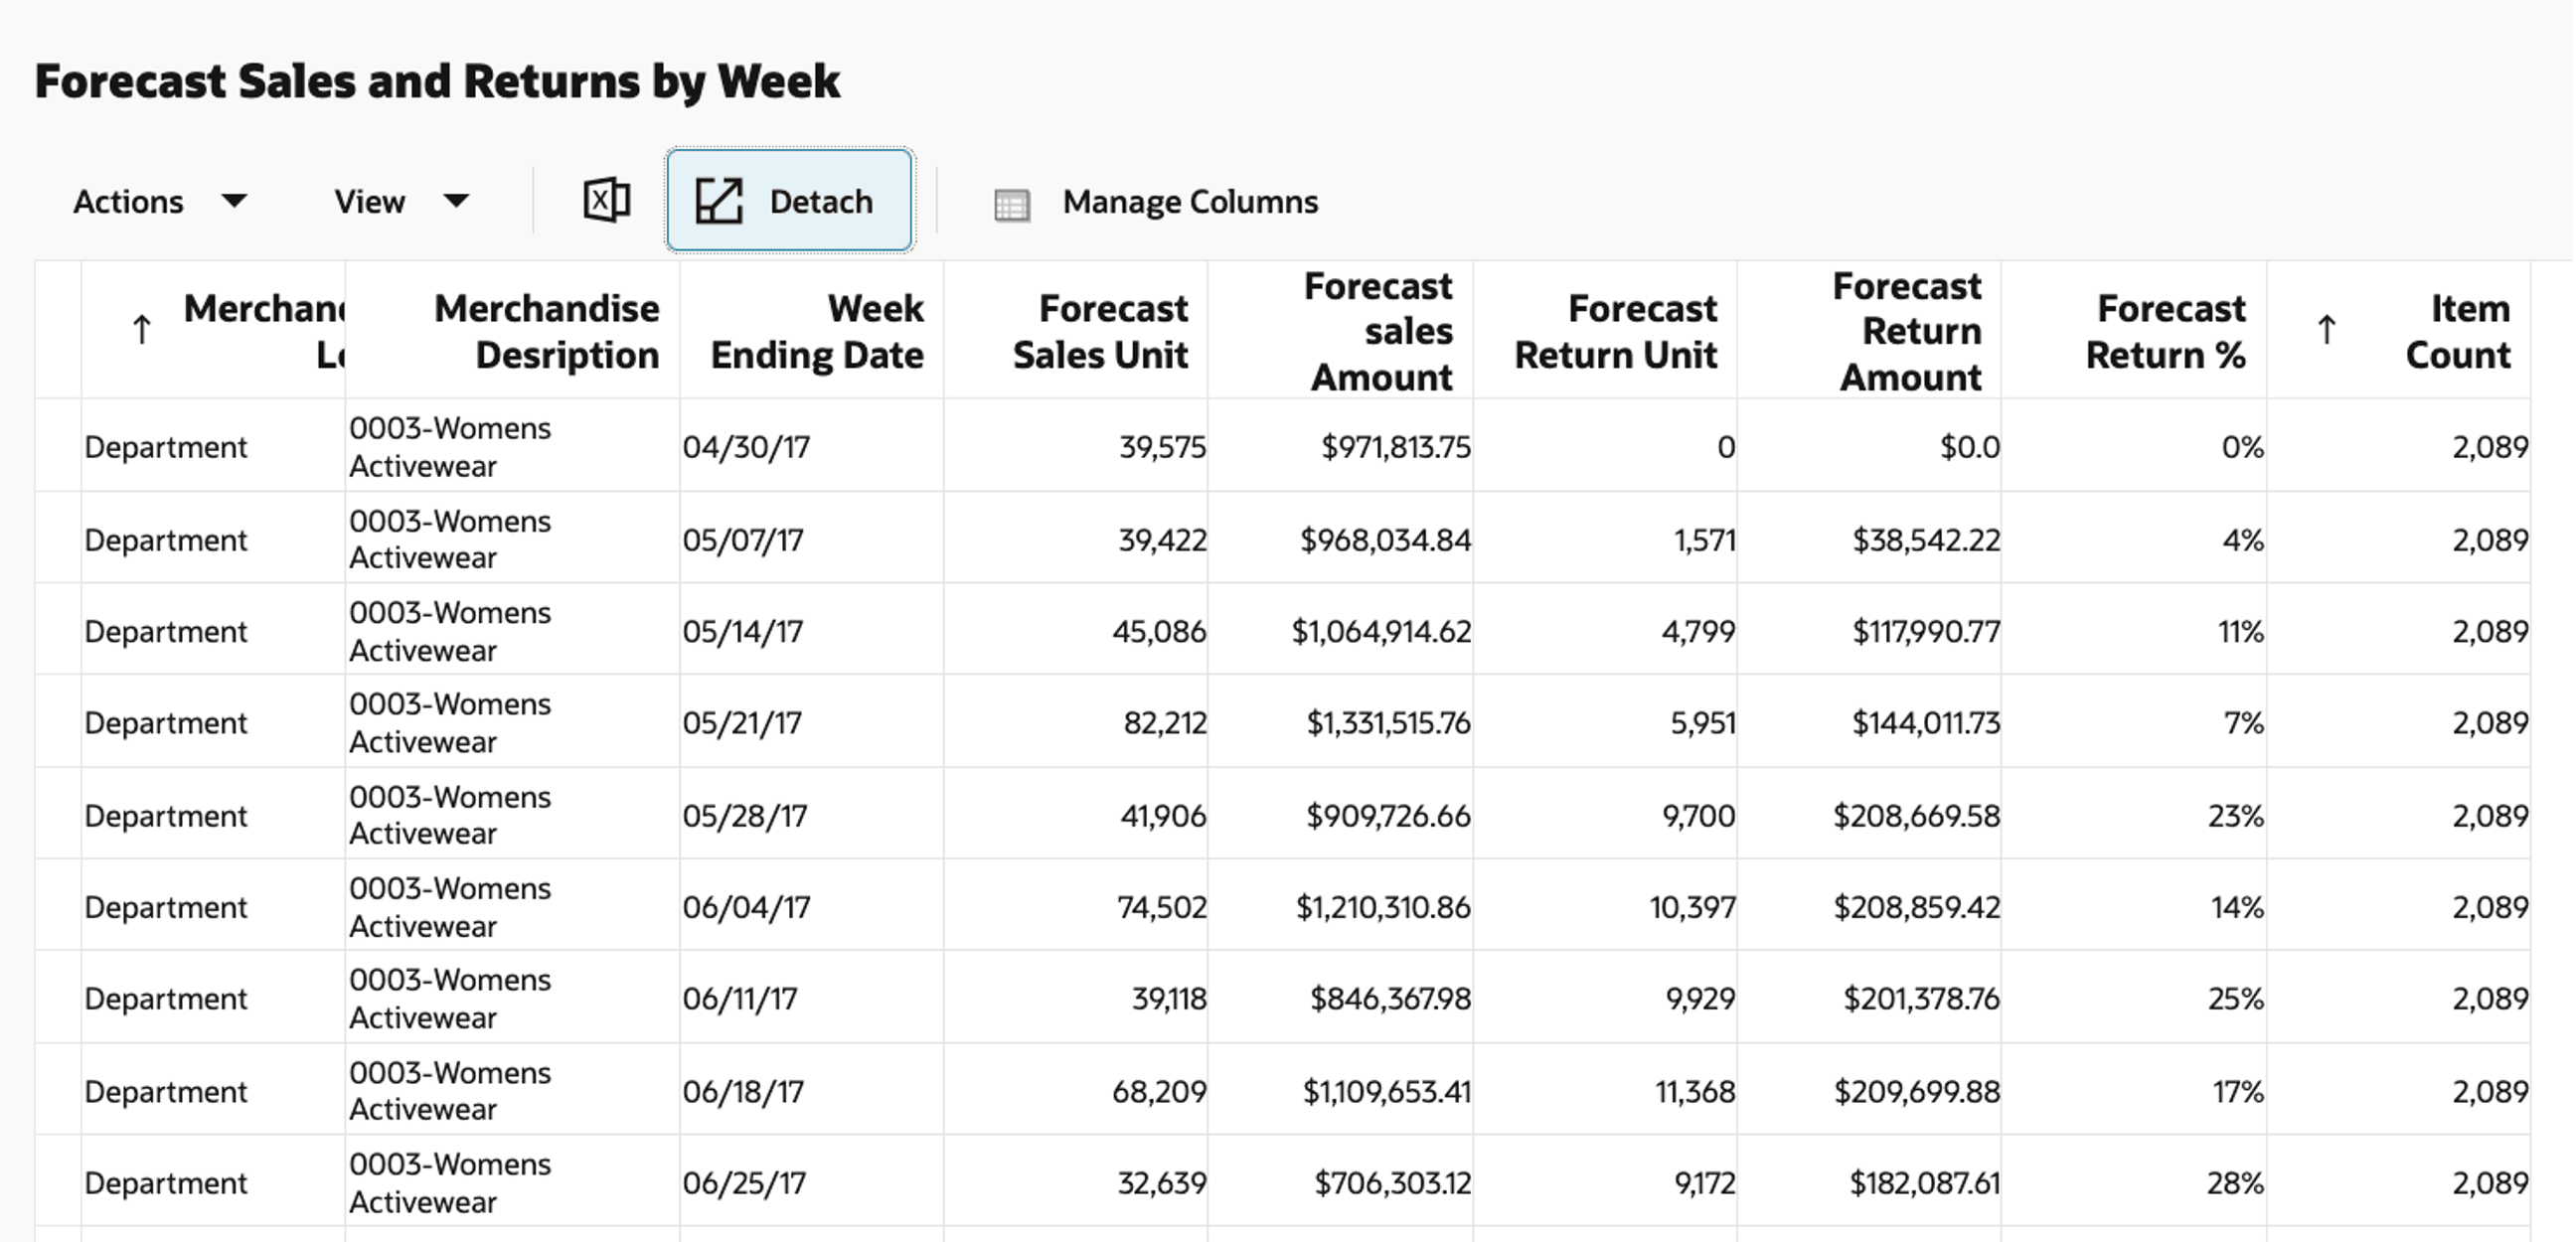
Description of "Figure 5-41 Returns Forecast - Review Sales and Returns by Week Table"-
Displays the following additional metrics compared to the chart: forecast sales amount, forecast return amount, forecast return %, and item count by week for the selected merchandise and segment combination.
-
-
Table that compares returns metrics across merchandise.
Figure 5-42 Returns Forecast - Return Metrics Across Merchandise Hierarchy Table

Description of "Figure 5-42 Returns Forecast - Return Metrics Across Merchandise Hierarchy Table"-
Displays the following additional metrics compared to the chart: forecast sales units, forecast sales amount, forecast return units, item count, sales life till date, returns life till date, and actual return percentage across all products for the selected merchandise and customer segment.
-
Returns Forecast - Customer Segment
The Customer Segment tab, shown in the following figure, is used to compare the forecast returns trends across the various segments.
Figure 5-43 Returns Forecast - Customer Segment Tab
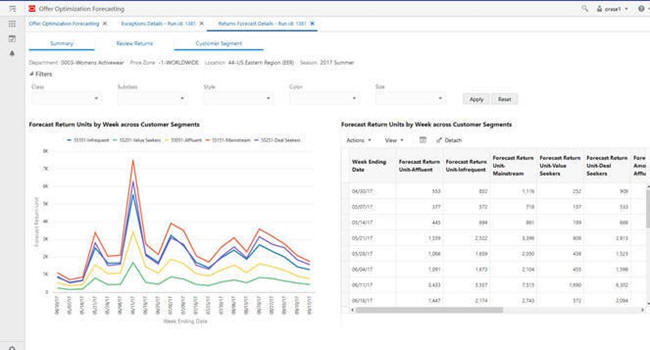
Description of "Figure 5-43 Returns Forecast - Customer Segment Tab"
Use this tab to compare the forecast return units' trends across various customer segments. Similar to Forecast Review and Returns Review tabs, you can view the customer segment comparison for the selected merchandise. The filtering functionality for merchandise works in the same way as in the Forecast Review and Returns Review tabs. In the chart, individual customer segments can be selected and un-selected by clicking the legend. The chart is rescaled automatically based on the new selection, as shown in the following figure. Rescaling is useful for reviewing patterns for customer segments with low sales volume.
Figure 5-44 Returns Forecast - Rescaling Based on New Selection
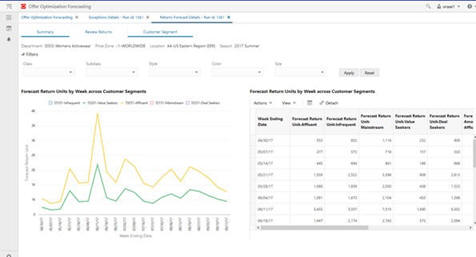
Description of "Figure 5-44 Returns Forecast - Rescaling Based on New Selection"
The table on the right displays the forecast return units and the forecast return amount for all customer segments. The Detach button can be used to expand the table into a pop-up window for ease of use, as shown in the following figure.
Figure 5-45 Returns Forecast - Customer Segment Table
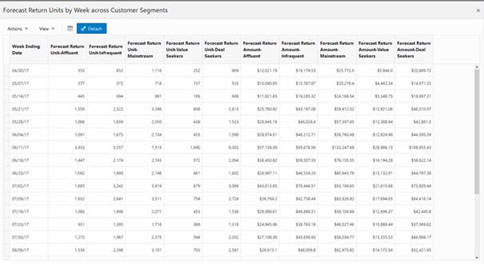
Description of "Figure 5-45 Returns Forecast - Customer Segment Table"
Markdown/Promotion - Exceptions
LPO Forecasting supports exceptions based on sell thru and returns. This includes the following:
-
Sell thru exception. When the Sell thru end of life is lower than the sell thru exception threshold for any product.
-
Returns exception. When the Forecast return % is greater than the return exception threshold for any product.
The sell thru exception threshold and return exception threshold are set in the RSE_CONFIG table and are global settings. By leveraging these settings, you can identify products that display outlier behavior, review forecast and returns information corresponding to the product, and take appropriate action.
Exceptions - Summary
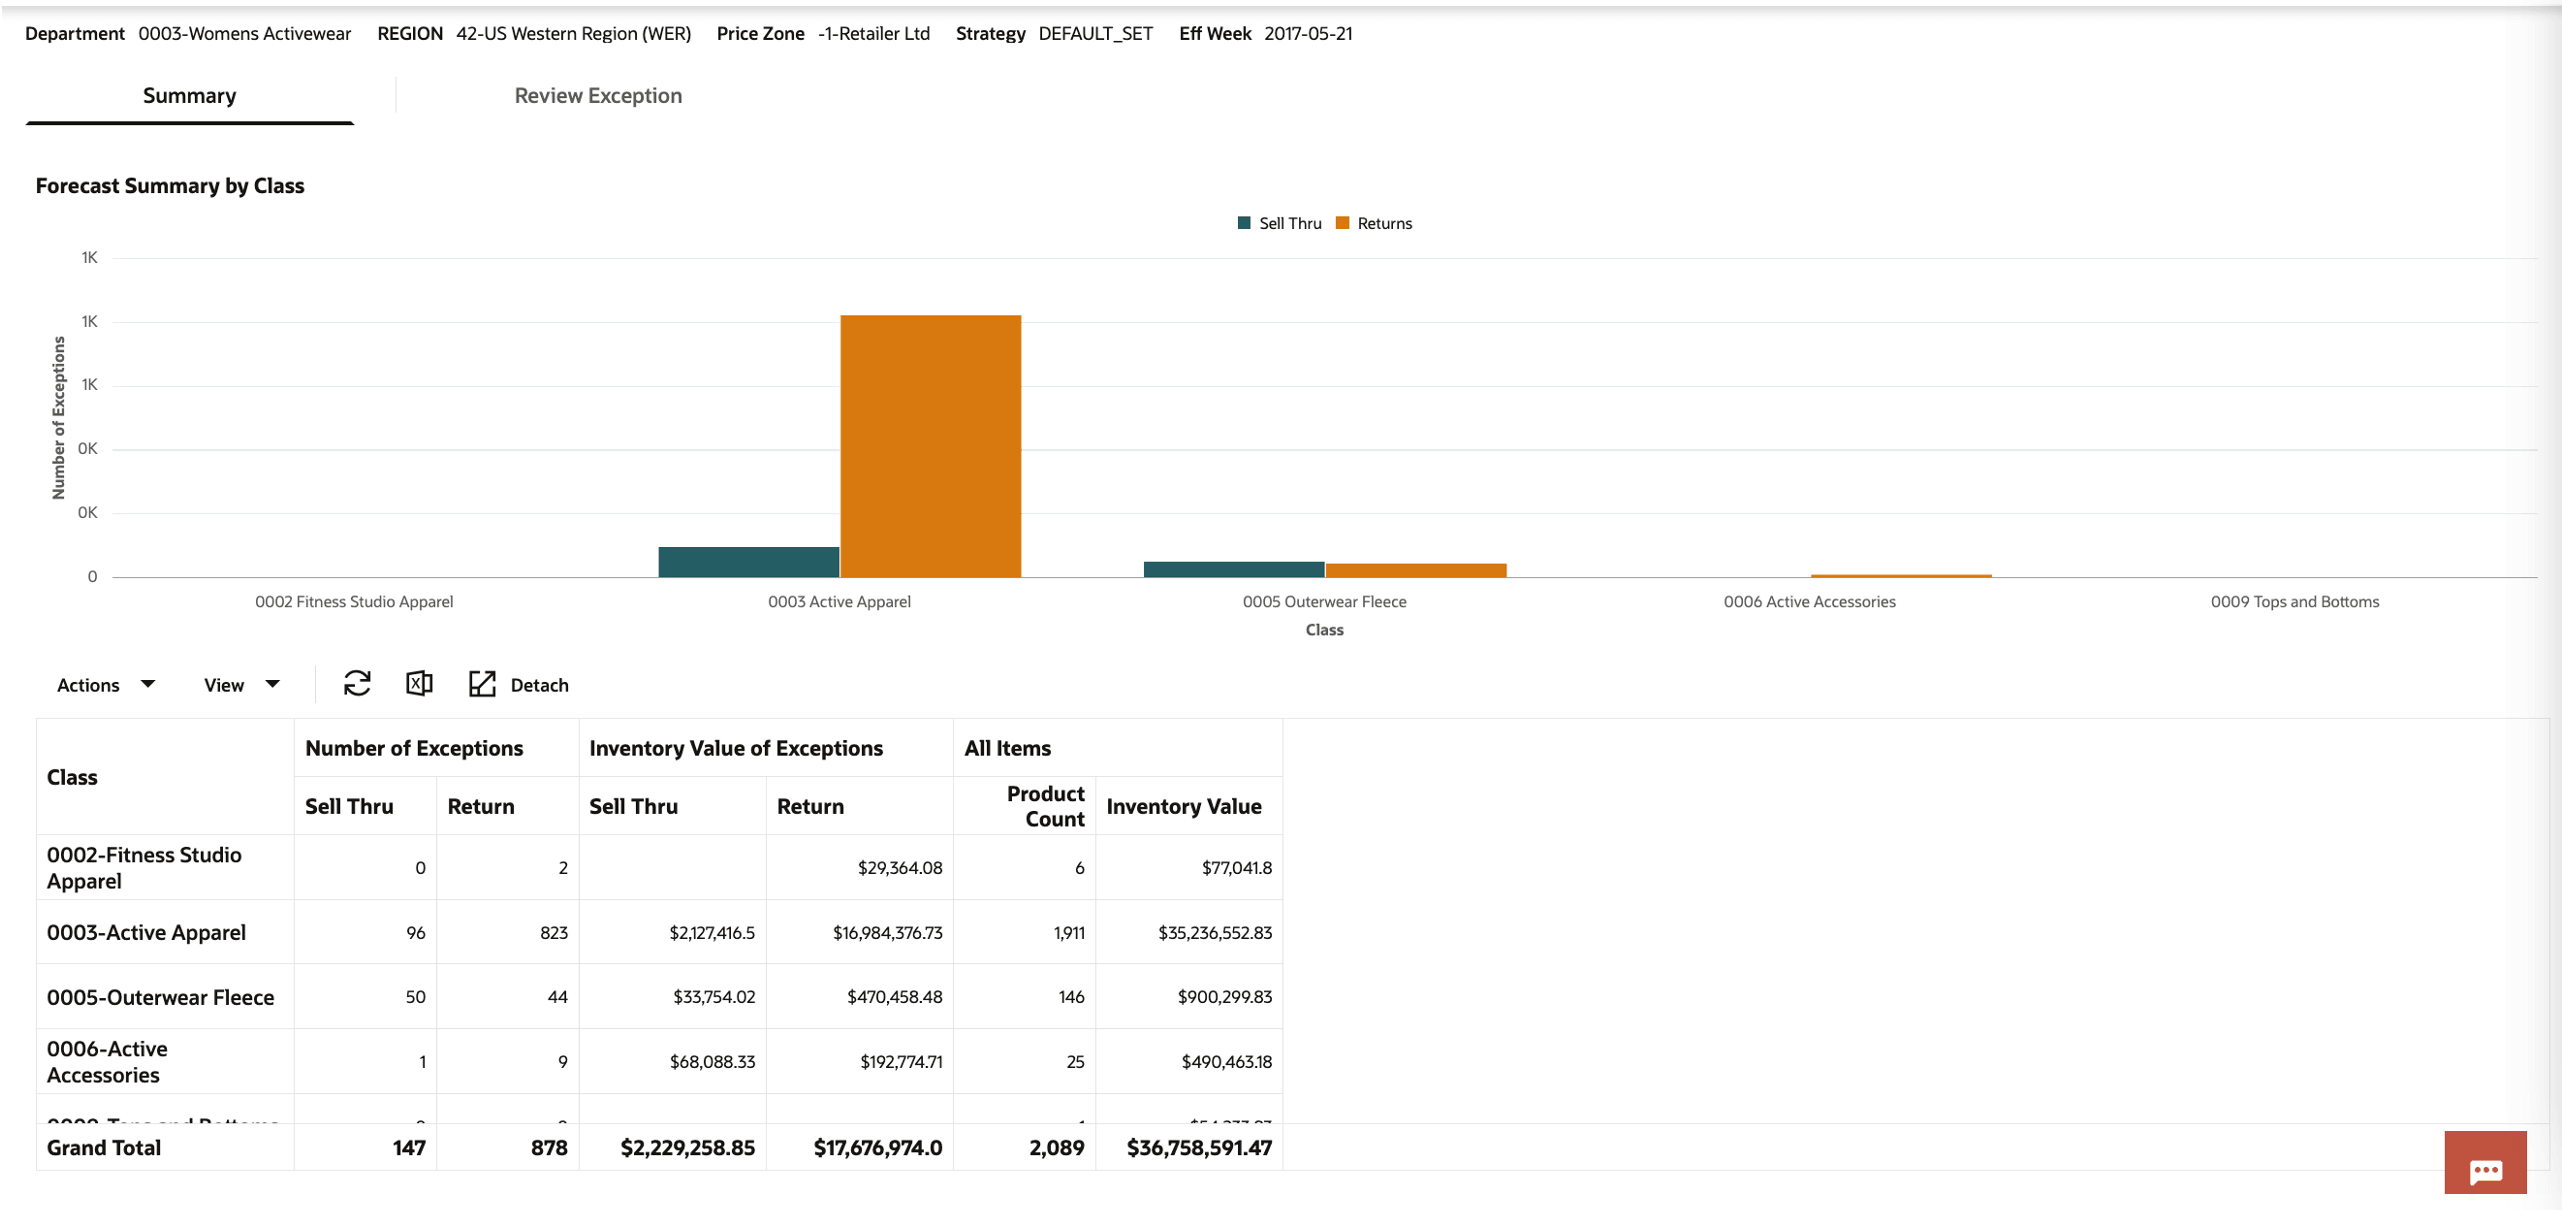
The Summary tab provides aggregate metrics by Class. It has the following two components:
-
Chart for Exception summary by class: Chart displays the count of sell thru exceptions and returns exceptions by class. Table for Exception summary by class. In addition to the count of exceptions displayed in the chart, the inventory value of the exceptions, product count, and inventory value of all products are present in the table. You can compare the inventory value of exceptions with inventory value of all items.
Exceptions - Review
The Review Exceptions table displays all the products that satisfy either the sell thru or return exception criteria. By default, the table displays all the exceptions from the selections run, shortlist products based on the merchandise hierarchy by leveraging the filter criteria.
Use the Filters icon to view and select specific merchandise, similar to the functionality in the Review Forecast and Review Returns tabs.
The forecast sales units and forecast return units act as hyperlinks to access the corresponding review forecast and review return screens. The product description acts as a hyperlink to the Manage the Recommendations screen.
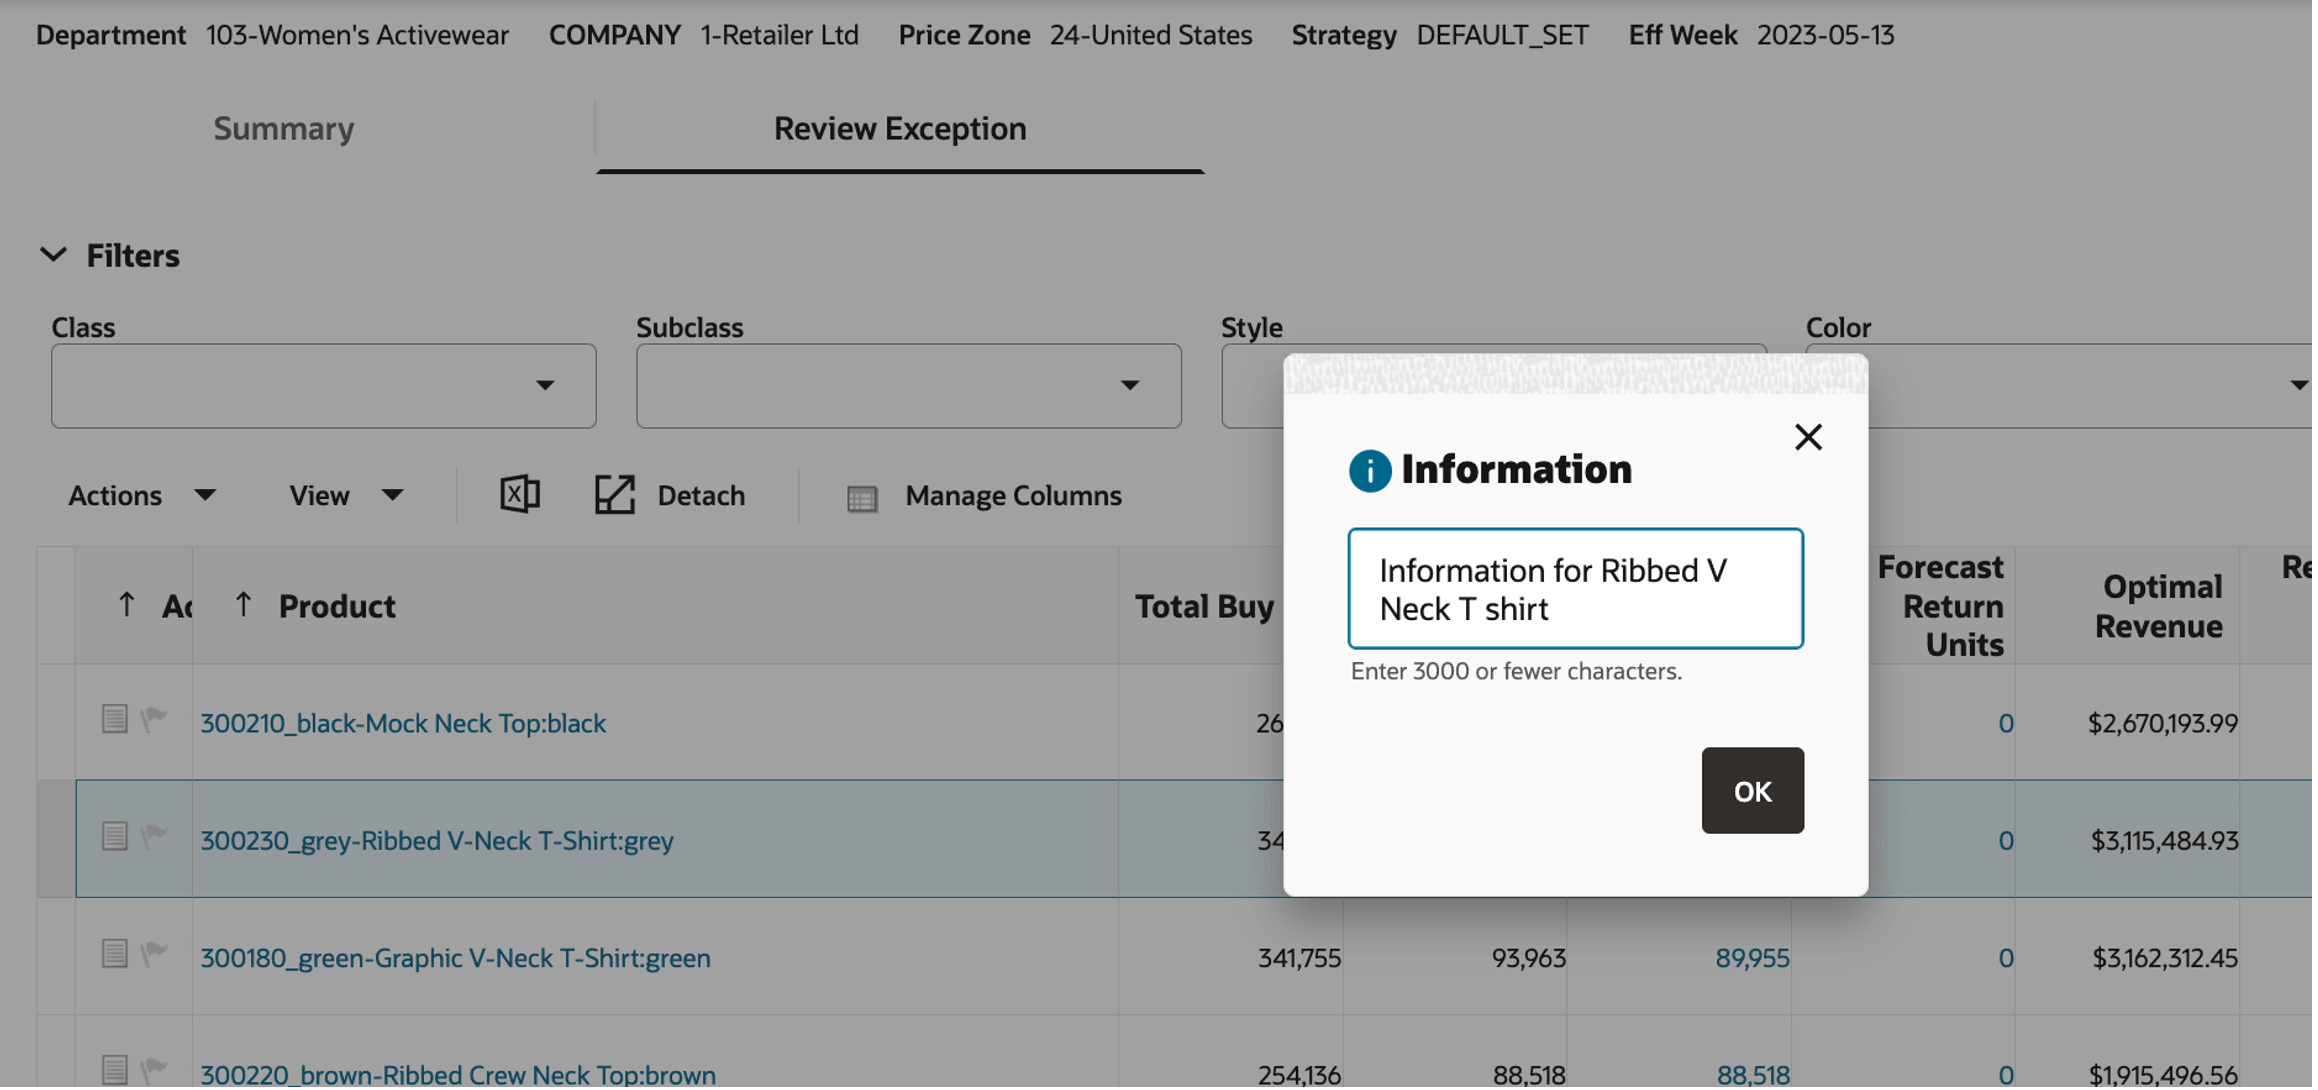
After reviewing the information, users can add comments using the Note icon in the Action column.
– The Action column also includes a Flag icon that can be used to mark certain exceptions.
– Both comments and flags are passed forward to the Manage LPO Recommendation screen in LPO.
For example, if a product has a sell-through exception, and after reviewing forecast details the user finds the model was constrained by a max first promotion rule, they may choose to override the recommendation with a deeper promotion.
Users can also click the product description to navigate directly to the Manage LPO Recommendation screen.
Figure 5-50 Exceptions - Review Exception Comments
Description of "Figure 5-50 Exceptions - Review Exception Comments"
Figure 5-51 Exceptions - Review Exceptions Flag Exceptions

Description of "Figure 5-51 Exceptions - Review Exceptions Flag Exceptions"
