10 Common UI Components
This chapter describes the common UI components.
Icons
The following icons are used in the user interface. Certain icons have slightly different definitions, depending on the context.
Table 10-1 Icons
| Icon | Description |
|---|---|
|
|
Copy a run. |
|
|
Create. Create a row. Create a run. |
|
|
Detach |
|
|
Delete. The object deleted depends on the context. |
|
|
Edit. Change status. |
|
|
Embedded help. |
|
|
Export to Excel. Export all. |
|
|
Freeze. |
|
|
Go to top. |
|
|
Go up. |
|
|
Go to bottom. |
|
|
Go down. |
|
|
Move selected item to another list. |
|
Progress indicator. The indicator changes mode when the application is processing data. |
|
|
|
Filter/Query by example. |
|
|
Refresh. |
|
|
Remove all items form list. |
|
|
Remove selected items from list. |
|
|
Required. |
|
|
Select date. |
|
|
Wrap. |
Buttons
Buttons are used to perform certain actions and for navigation.
Table 10-2 Buttons
| Button | Description |
|---|---|
| Action | Provides access to the following actions: Save, Optimize, Re-Optimize, Reviewed, Save, Recalculate, and Submit |
|
Back |
Used to return to the previous train stop. |
|
Cancel |
Used to close a dialog box without making a selection. |
|
Clear Selection |
Clears the selected rows list. |
|
Next |
Moves to the next train stop. |
|
Save |
Saves the existing settings. |
|
Select All |
In Business Rules - Pricing Groups, selects the entire set of rows displayed. |
|
Accept All |
In Results, accepts all the price recommendations. |
Pull-Down Menus
The user interface has two pull-down menus that provide access to a variety of functionality.
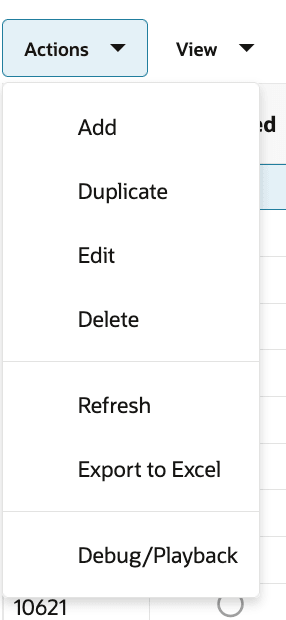
The Actions pull-down menu provides functionality that you use to manipulate the application data.
| Action | Description |
|---|---|
|
Create Run |
In Run Overview, takes you to the Optimization Setup train stop. |
|
Copy Run |
In Run Overview, used to create a duplicate of an existing run. |
|
Delete Run |
In Run Overview, used to delete a run. |
|
Export to Excel |
Used to export the set of rows displayed to Excel. |
|
Add |
In Business Rules-Pricing Groups, used to add data. |
|
Edit |
In Business Rules-Pricing Groups, used to edit data. |
|
Delete |
In Business Rules-Pricing Groups, used to delete data. |
|
Create |
In Fixture and Product Data, used to create. |
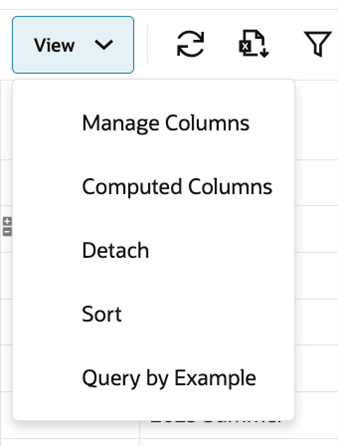
The View pull-down menu can be used to adjust how the display is organized.
Figure 10-2 View Menu
| Action | Description |
|---|---|
| Manage Columns | Provides the ability to choose/hide columns and reorder them. |
| Computed Columns | Displayed only for Recommendations table, provides the ability to create custom columns with user defined computations. |
| Detach | Maximizes the table to fit your browser. |
| Sort | Provides the ability to specify up to three columns to sort the data in ascending or descending order for each column. |
|
Query by Example (Filter Options) |
Query by Example can be turned off or on by clicking the option in View menu or by clicking the Query by Example icon in the table toolbar. Clicking the icon displays empty text boxes over the table. You can filter the table data based on the filter on each column. |
Manage Columns
The Manage Columns feature in the View menu of the LPO Manage Recommendations, LPO Run Overview, and LPO What-if Results screens lets you save, name, and manage multiple custom column configurations (views). This allows you to easily switch between different column setups for exporting, reporting, or analysis, without needing to reselect columns each time.
To create a new column set:
- Open the Manage Columns option from the View menu in the Manage Recommendations table.
- Choose or remove the desired columns.
- Select Save Column Set to store your configuration.
Figure 10-3 View Menu - Manage Columns - Save Column Set
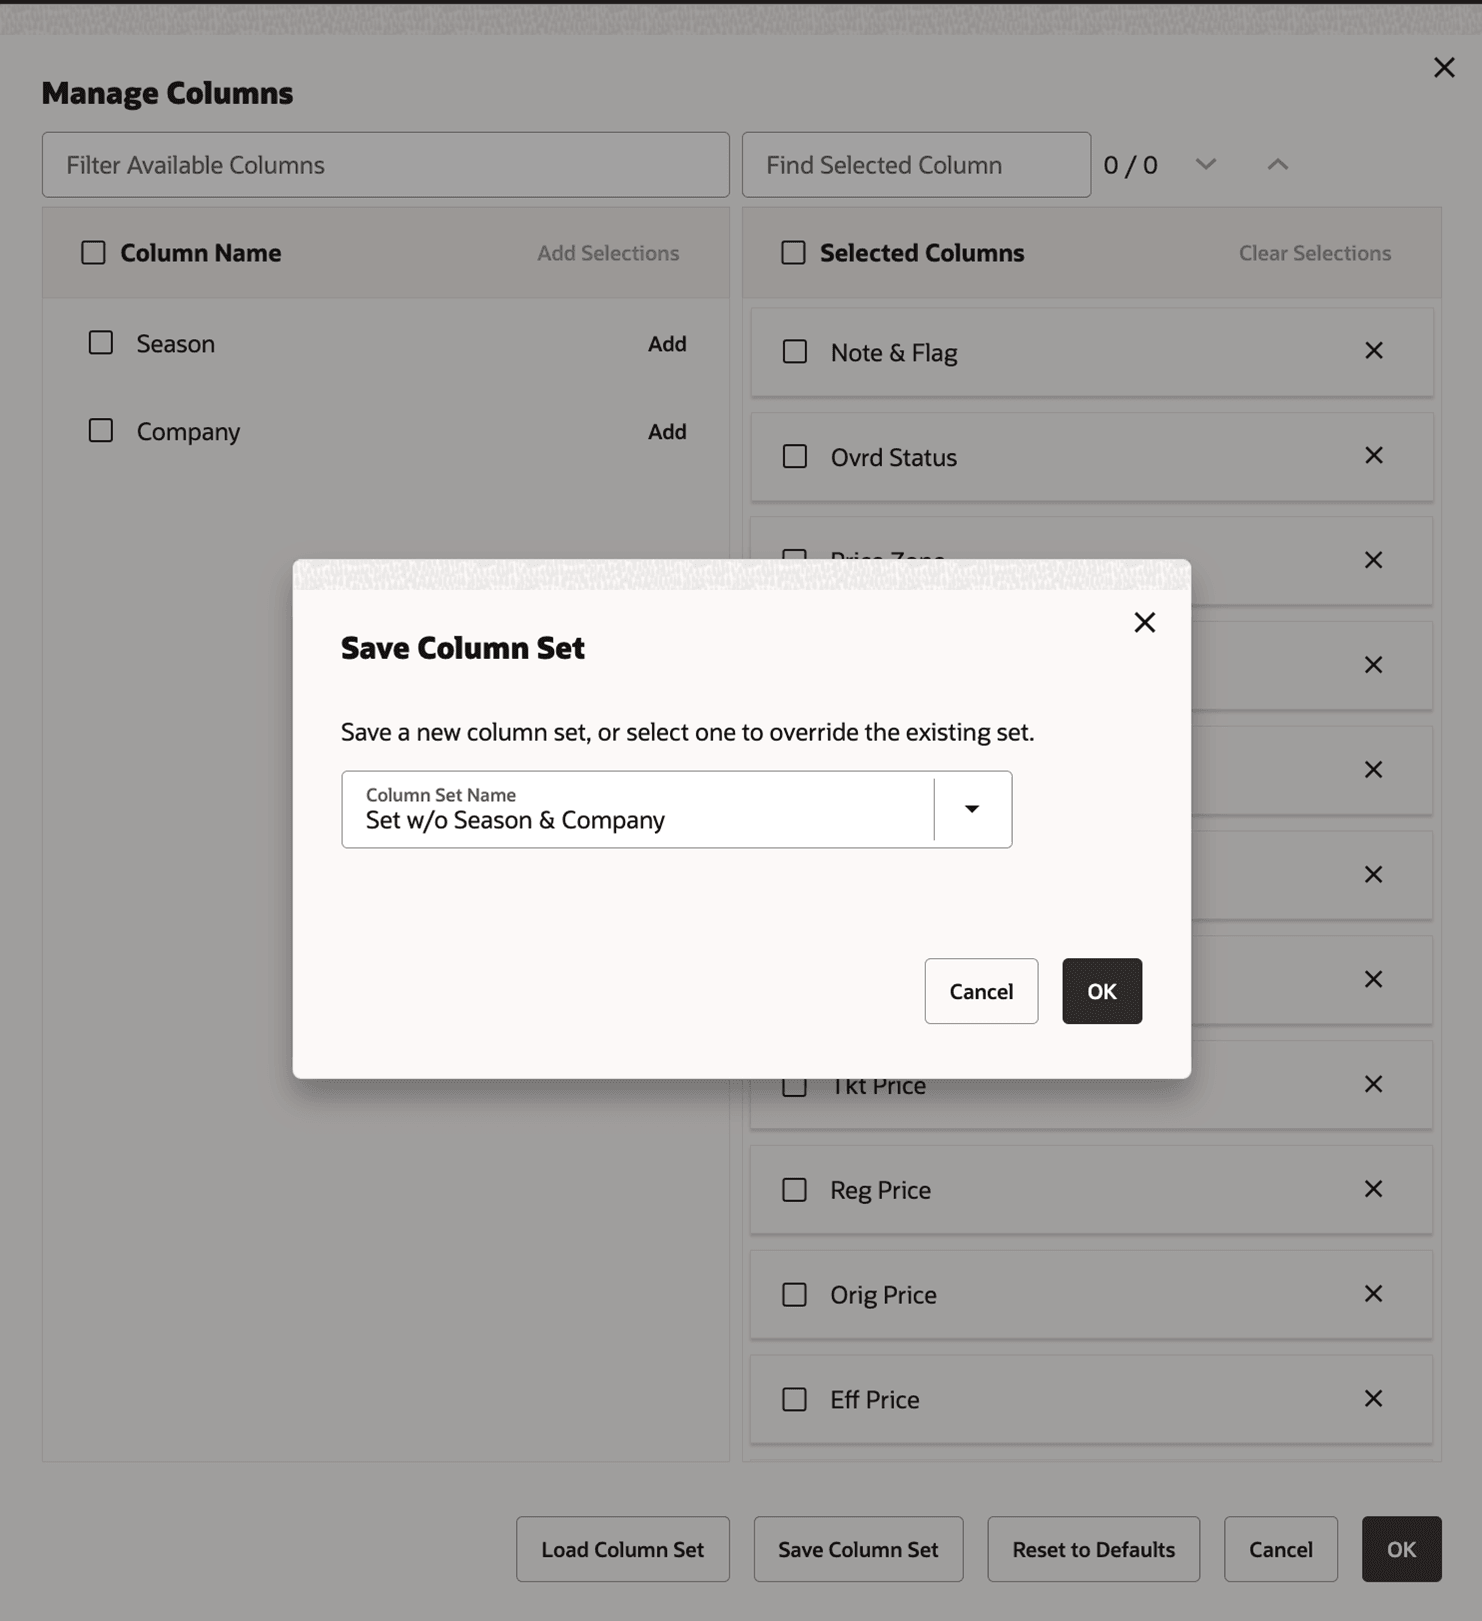
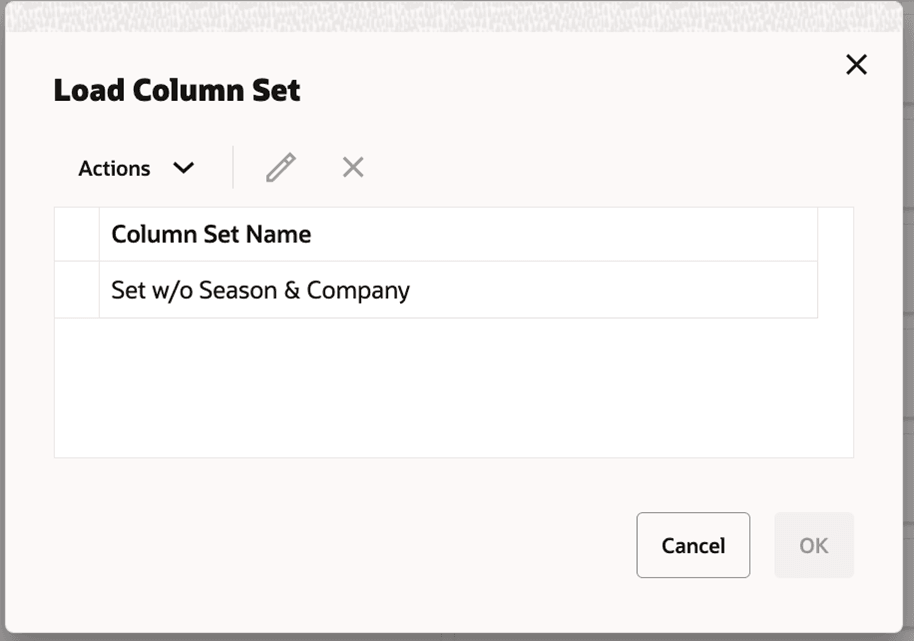
To access a saved column set, click Load Column Set and select the preferred column set name from the list.
Figure 10-4 View Menu - Manage Columns - Load Column Set
Query Builder
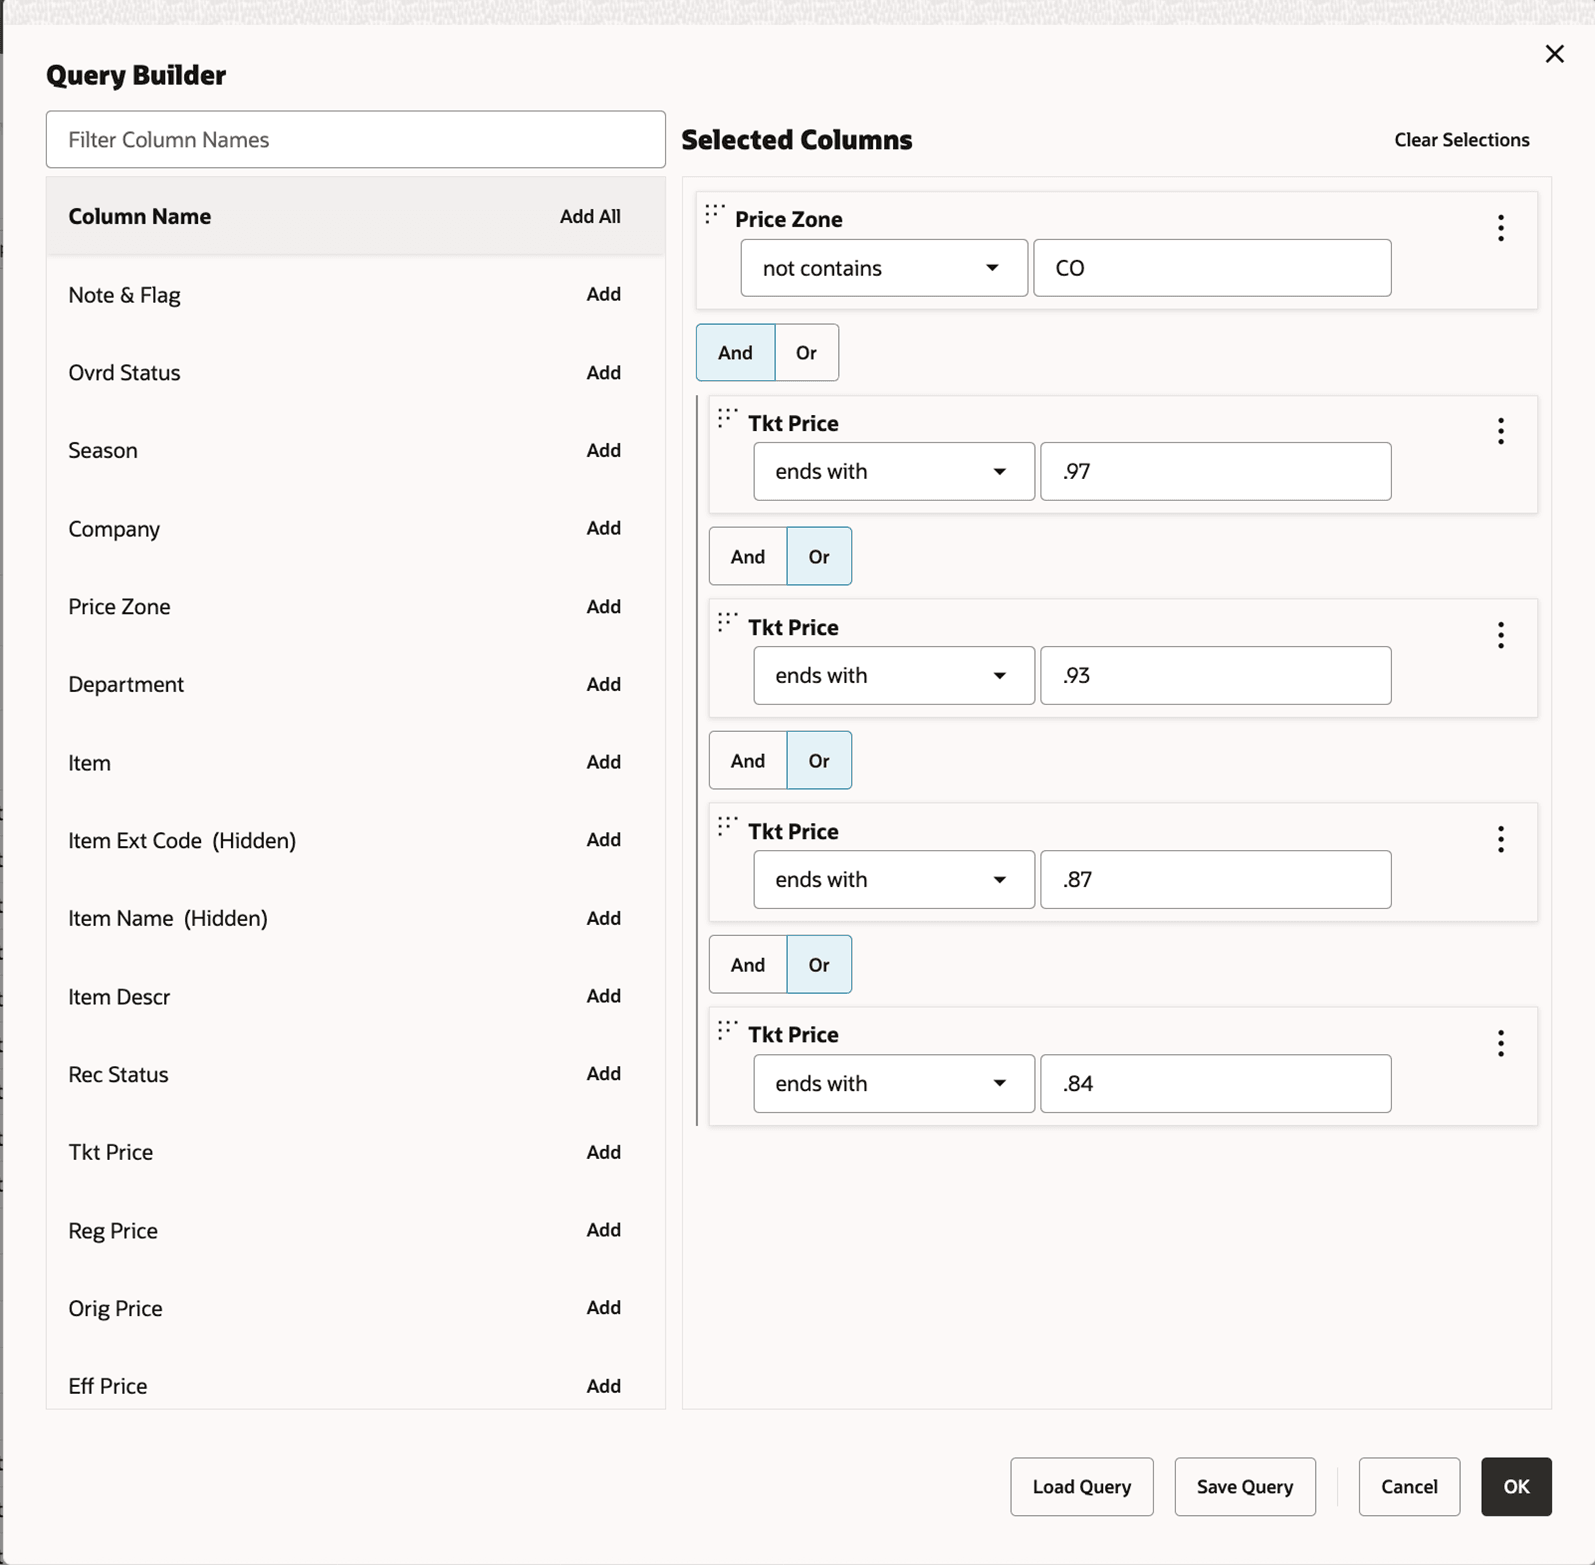
The Query Builder allows you to build a complex query, with a grouping of columns in the Manage LPO Recommendations and AND/OR logical operators within and between groups (for example, Recommended Price Type = Markdown and (Brand = Green or Markdown Number <= 2) and Remaining Inventory (at BOP>5) between 10 and 20).
For example, a query can now be constructed as follows:
Price Zone Not Contains 'CO' AND (Ticket Price ends with .97 OR Ticket Price ends with .93 OR Ticket Price ends with .87 OR Ticket Price ends with .84)
All records will then be returned that exclude price zones beginning with CO, with ticket prices ending in .97, .93, .87, or .84.
To perform this action, first select the columns, choose the applicable operator (such as =, !=, contains, not contains, or in), enter the desired values, and set And/Or conditions. Nested groups can be created by clicking the three dots beside a column and selecting columns to group within the query. The nested groups are indicated by a vertical line in the left-hand side of the selected column.
Charts
Certain stages have associated charts available on the right-hand side of the display that list data in a tabular format.
Embedded Help
Embedded help, which you access by clicking the Question Mark icon, provides additional information about the details required by certain fields.
