2 Dashboard Reports
The Sales Auditor dashboard presents information in a manner that helps auditors prioritize their day-to-day activities as well as quickly identify areas of concern. The dashboard allows a user to look at a consolidated view of their 'to-dos' and then directly and contextually launch into the corresponding Sales Audit workflows to take an action. The reports in the dashboard show data across assigned stores for an auditor.
The dashboard reports can be viewed by navigating to Reports menu > ReSA Dashboard in Sales Audit.
Figure 2-1 Sales Audit Dashboard

Open Store Days Report
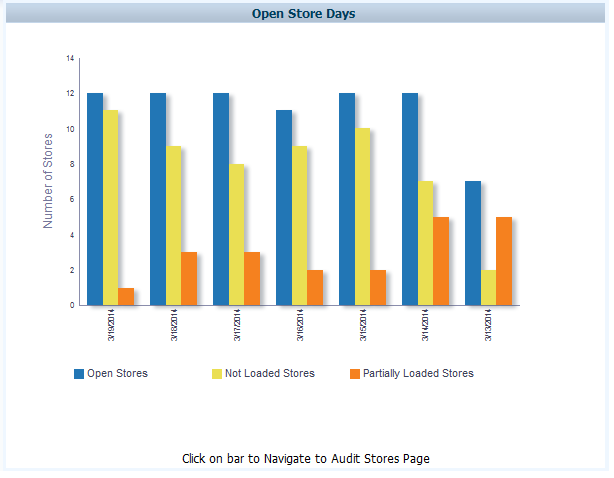
The Open Store Days report indicates a sales auditor's open store days and whether they have been audited, and whether sales have been loaded or partially loaded for the last seven days. There are three different actions that can be taken from this report:
-
Clicking the Open Stores bar in the report contextually launches the Store Day Search screen, with search auto-executed for all store-days with a status of Sales Audit In-Progress.
-
Clicking the Not Loaded Stores bar in the report contextually launches the Store Day Search screen, with search auto-executed for all store-days with a status of Ready for Import.
-
Clicking the Partially Loaded Stores bar in the report contextually launches the Store Day Search screen, with search auto-executed for all store-days with a status of Partially Loaded.
The report can be configured to show data for up to 14 days. The number of days that will be displayed in the report can be specified in the System Options screen in Sales Audit.
Figure 2-2 Open Store Days Report
Top Ten Late Stores Report
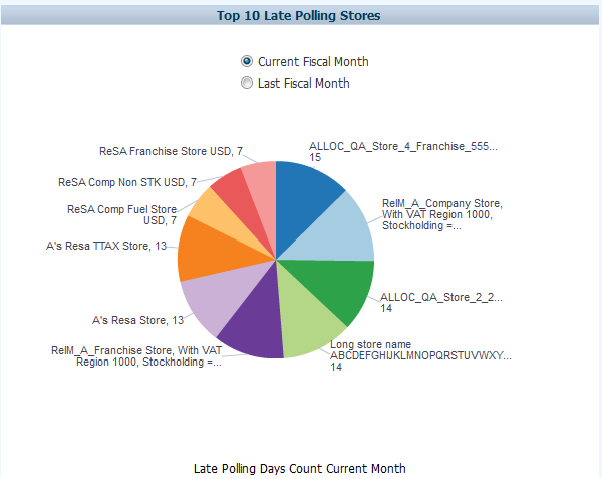
The Top 10 Late Stores report provides a view of up to 10 stores that have the highest number of late polling days in the current or last month. This report shows the count of store days with Ready to Import or Partially Loaded status per store for the current month or last month, based on the view selected. Based on this information, an auditor can choose to contact these stores to investigate further.
Figure 2-3 Top Ten Late Stores Report
Open Transaction Errors Report
The Open Transaction Errors report displays the count of open transactional errors by error code across all stores by business day. Hovering over the stacked bar shows the count of errors for a given error code on a given business date. The following actions can be performed from this report:
-
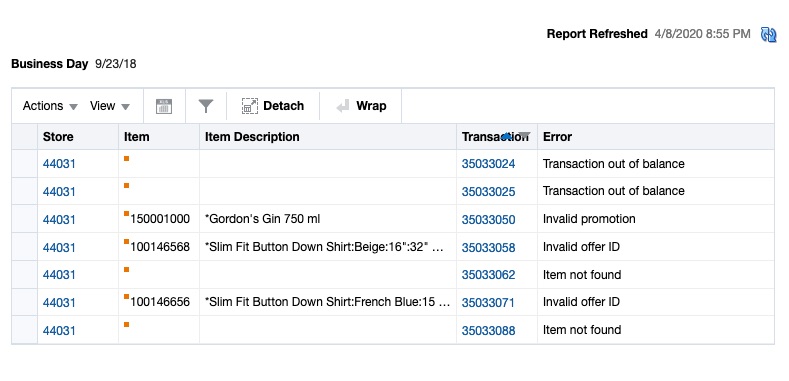
Clicking the stacked bar for a specific business day refreshes the tabular detail report on the right of the bar chart. The tabular report shows the store, item, transaction number and error details of all errors existing for the given business date.
-
Clicking the Store ID in the Store column of the Open Transaction Error table contextually launches the Transaction Search screen with search auto-executed for all transactions for the given store and business date where transaction level errors exist.
-
Clicking the Transaction ID in the Transaction column of the Open Transaction Error table contextually launches the Transaction Maintenance screen for the given transaction in View or Edit mode based on the user's privileges.
The report can be configured to show data for up to 14 days. The number of days that will be displayed in the report can be specified in the System Options screen in Sales Audit.
Figure 2-4 Open Transaction Errors Report
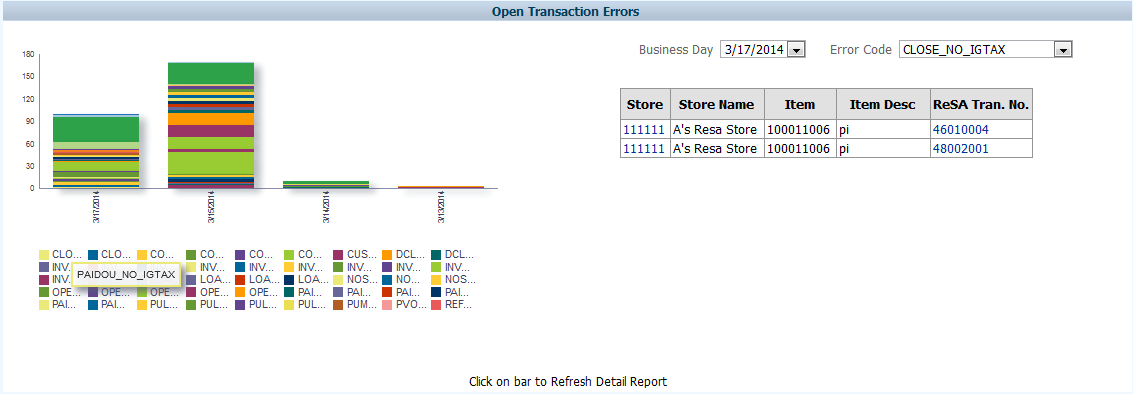
Figure 2-5 Open Transaction Errors Table
Over/Short Summary Report
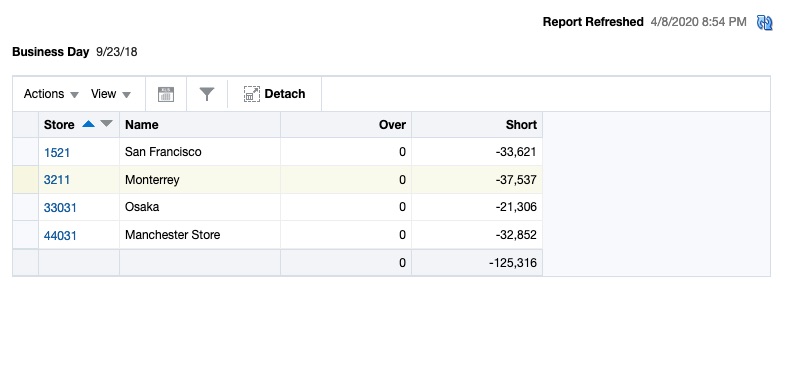
The Over/Short Summary report displays the sum of overage amounts for all stores that have totals with an over amount and the sum of shortage amounts for all stores that have totals with a short amount per business day. The following actions can be taken from this report:
-
Clicking the over or short bar for a given business day refreshes the tabular detail report on the right of the bar chart. The tabular report shows the store and the corresponding over amount or short amount for the store and given business day. If all the stores have varied local currencies, the amounts are displayed in the primary currency.
-
Clicking the Store ID in the Store column of the Over/Short summary table contextually launches the Store Day Summary screen with the Over/Short Totals tab highlighted for the selected store and business day either in View or Edit mode, based on the user's privilege.
The report can be configured to show data for up to 14 days and only above configurable thresholds for overage and short amounts. Only those overages and shortages that exceed the specified respective thresholds will be included in the report. The number of days that will be displayed in the report, over threshold and short threshold can be specified in the System Options screen in Sales Audit.
Figure 2-6 Over/Short Summary Report
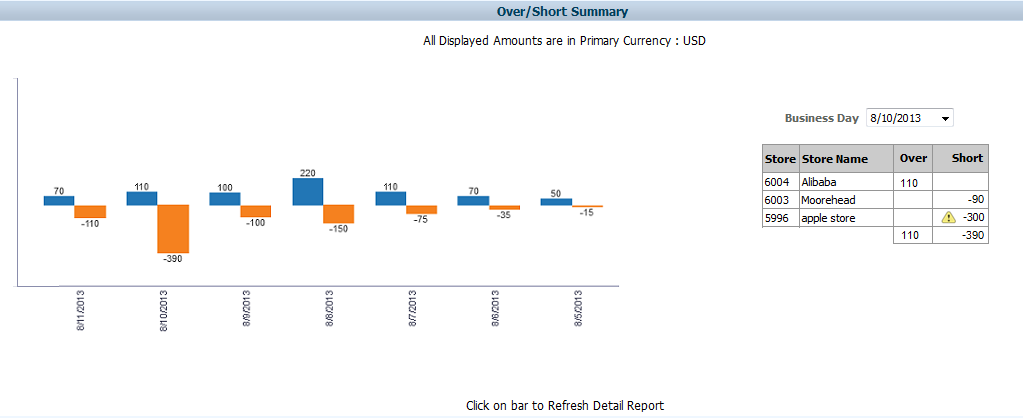
Figure 2-7 Over/Short Summary Table
