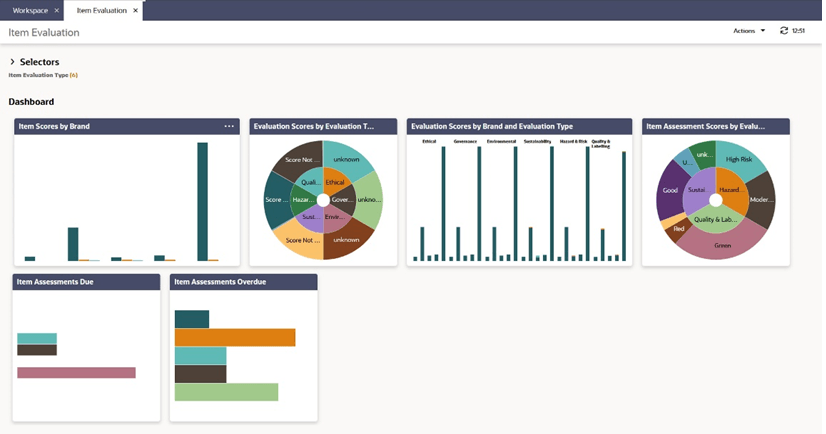
Item Evaluation Dashboard Layout
Figure 9-1 Item Evaluation Dashboard

Selectors
These controls are used to filter the data content that is displayed. The filters are based on the Supplier, Site,and Product records.
The selections apply to all Item Evaluation Dashboard content, unless explicitly stated otherwise.
When scrolling, the Selectors remain at the top of the page.
When collapsed, the Dashboard area expands to maximize the viewing area. A summary line of the selectors is displayed with the number of options selected for each control.
The Save button refreshes the content of the screen and applies the selections/filters to the Dashboard content. The selection of selectors will be saved/persisted for the current user's future sessions.
The following are available to filter the data in the dashboard tiles:
-
Evaluation Type
-
Site Type
-
Site Status
- Technologist
-
Site Top Grade
-
Business Category
-
Country
- Countries Where Sold
- Brand
-
Area
Dashboard
The content is predefined. It consists of tiles populated with Charts, Graphs, and Metrics dependent on the data being represented.
The data has implicit filters to manage the following:
-
Area Access - This is dependent upon the system parameter Restrict Access By Area being set to Yes. The Area Access is related to a user’s access to groups of Suppliers and the associated Sites. When configured, a user may have a reduced view of the data dependent upon their Area setting in their User record.
-
Role Based Access - A user’s access is dependent on the role assigned to the user.
-
Supplier Access - Supplier users only have visibility to their Suppliers and Sites.
List View Page
Selecting the Drilldown to details menu option for a Dashboard tile, opens a new tab to display data for the tile. This tab includes a row of quick filters at the top, a list view of the data, and a panel that displays the data for the row selected in the list. The user can toggle between the list view and a graph view. For an example, see Figure 8-2.