KPIs Dashboard
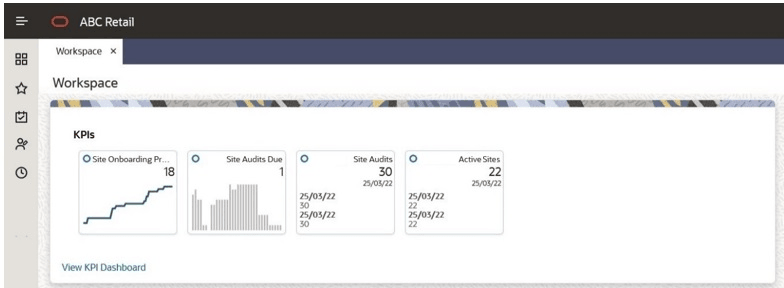
As an Advanced Reporting user, you will see the KPIs dashboard within the Workspace page.
Figure 5-1 KPIs in Workspace

You must configure which KPIs you wish to appear in the dashboard, from those that are available to you. For further details, see the Configuring the Dashboard section.
Once you have added KPIs to your dashboard, they are shown as a set of tiles. Use the > and < controls to scroll through the list if there are more to show.
The KPI data is based on KPI reports that are generated in Supplier Evaluation. The tile shows the KPI metric, and either a thumbnail representation of a chart, or the latest three values of a table.
Clicking the tile opens the KPI Dashboard page containing the full chart or table.