Weekly Comparison Module
This module compares the customer's electricity costs during peak hours in the current week to their spending during peak hours in the previous week, and provides varying feedback based on how the customer's costs in the week compare to those of the previous week.
Design
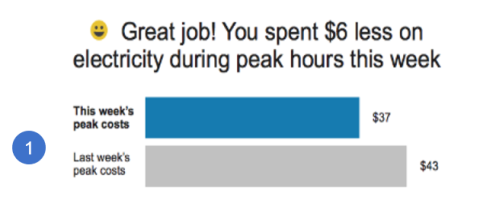
The following image shows an example of the Weekly Comparison module followed by the available configuration options.
Configuration Options
For each element listed in the table, indicate the desired configuration in the Input Value column. If you do not provide an input for optional configurations, the default will be used.
| Image Number | Configuration Option | Input Value |
|---|---|---|
|
1 |
Bar Colors Colors in the graph can match the utility’s color palette. The colors in the example represent the default colors. |
Required Choose one of the following: Use the default colors. Work with your Delivery Team to specify other colors. |
|
Not Depicted |
Comparison Range The range is used to determine whether the customer's usage for the current week falls within the neutral state. The neutral state, which provides the message, “You used about the same…” occurs if this week’s usage is within +/- of the specified range. The range is configurable, and can be stated in % or absolute dollars. The default values are +/- 5% for usage and +/- $1 for cost. |
Required Use the following range:
|
To see how this module fits into the overall user experience, see Design and Configuration: Time of Use Coach Emails.
User Experience Variations
This section discusses the user experience variations in the Weekly Comparison module.
Customer Spent More This Week
If a customer spends more during peak hours this week, the TOU Coach Weekly Comparison module displays the following:
- Insight Statement: You spent [$X] more on electricity during peak hours this week.
- Insight Graphic: The module displays an exclamation point next to the insight statement.
Customer Spent About the Same This Week
If a customer spends about the same amount during peak hours this week, the TOU Coach Weekly Comparison module displays the following:
- Insight Statement: You spent about the same on electricity during peak hours this week.
- Insight Graphic: The module does not display a graphic next to the insight statement.