Green Button - Download My Data
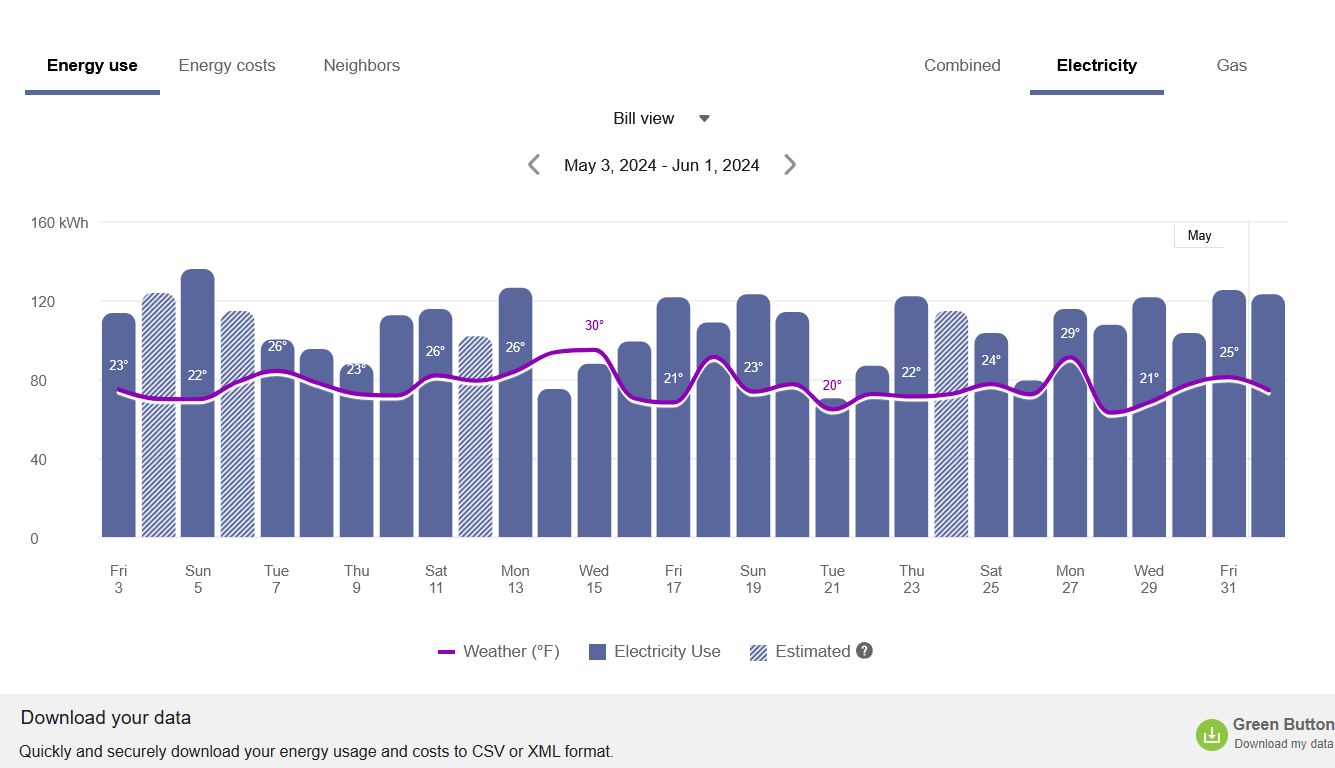
The Green Button allows customers to export their billing data into CSV or XML format. It is typically located beneath the Data Browser. When a customer clicks the Green Button link, a Download my data section displays and allows the customer to choose between downloading their data in CSV or XML format.
Green Button Example
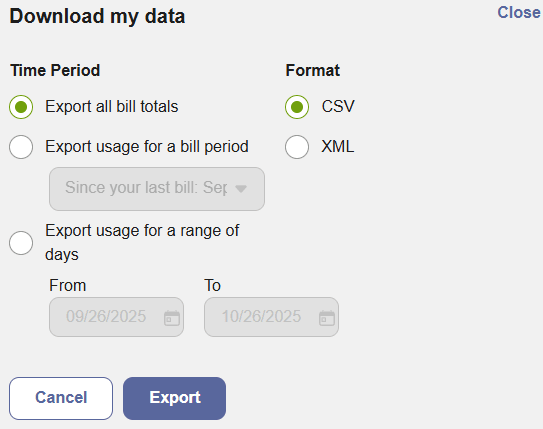
The images below show examples of the Green Button feature's behavior. The Green Button is typically displayed under the Data Browser. When a customer clicks the Green Button link, a Download my data section displays and allows the customer to choose from different options.
The options displayed vary depending on whether the customer has billing data or AMI data. The example below displays options for customers who have AMI data.
Configuration Options
For each element listed in the table, indicate the desired configuration in the Input Value column. If you do not provide an input for optional configurations, the default will be used.
| Configuration Option | Input Value |
|---|---|
|
Display File Export Options in a Modal Dialog You can display the file export options as a modal dialog instead of an expandable inline menu. Both display options provide the same fields for entering inputs and produce the same exported files. This configuration is supported for embedded and standalone implementations. Default: Inline. Selecting Download my data expands the file export options in an accordion. |
Optional Choose one of the following:
|
|
Enable Five-Minute Data Intervals You can enable rows to display five-minute usage data intervals in the downloaded energy use file. This is supported for customers with five-minute AMI data. Default: Disabled. (Five-minute intervals are summed up to 15-minute intervals.) |
Optional
|
|
Enable Account Nickname in CSV File Header Utilities can provide a personalized identifier, or nickname, for each customer account. This nickname appears in a column of all exported CSV files. The account nickname helps customers identify which account the data is from so they do not need to memorize their billing account number. This feature is helpful when account numbers are long or difficult to remember. Default: Disabled. |
Optional
|
| Enable Custom Meter or Service Point Names in Downloaded File Utilities can allow users to define custom names for their meters or service points in relevant widgets, such as the Data Browser. Those custom names can also be enabled to appear in exported files. This lets customers more easily identify the appropriate meter or service point when reviewing exported data. Default: Disabled. |
Optional Choose one of the following:
|
User Experience Variations
The user experience of the feature may vary for customers and utilities depending upon their service types (gas, electricity, dual fuel, and so on), available data, costs, locale, and other factors.
Account Nickname in CSV File Header
Depending on how the utility program is set up, an account nickname might appear below or instead of the account number in the header of the downloaded CSV file. The account nickname helps customers identify which account the data is from, which can be useful if account numbers are long or hard to remember.
Requirements: The Account data transfer feed must be established.
Customer Switches to AMI Data
If a customer is converted from a non-AMI meter to an AMI meter, there are variations from the standard user experience during the transition.
For each customer, there is an in-progress bill, or virtual bill, that is taken into account. This virtual bill is calculated by adding a defined number of days to the end date of the customer's most recent bill. Customers can download the virtual bill using the Export usage for a bill period drop-down list and selecting the Since your last bill option.
For example, a non-AMI customer may become an AMI customer on 05/10. The last bill the customer received was on 05/03. In this scenario, a virtual bill period is created from 05/03 to 06/02. Because this customer has become an AMI customer, both the additional AMI options are available after 5/10.
In a similar scenario, the customer becomes an AMI customer on 05/10, but this customer received their last bill on 04/03. This scenario creates a virtual bill period from 04/03 to 05/03. Due to this delay in bills, another virtual bill is not created. If the customer downloads their data on 05/12 and a new bill still is not available, the standard download options for AMI customers are not available to the customer.
Demand or Reactive Power
If a customer has demand or reactive power data related to their electricity use, that data is available for download.
Five-Minute Data Reads
For customers with five-minute AMI data resolution, the downloaded file may show rows for each five-minute usage read. This allows for a more granular view of a customer's subdaily usage.
Five-minute AMI data is required for this experience, and some additional configuration is needed. Contact Your Delivery Team for more information.
Modal Dialog
When configured to use a modal dialog, the feature displays a single Download my data button. When the customer selects the button, the export options open in a modal dialog that displays over the page while the background is dimmed. The dialog includes the same time-period and file-format options as the default inline experience.
Multiple Billing Accounts and Service Points
If a customer has multiple billing accounts, the customer can download a file for each account. However, the feature does not display a menu for switching between accounts. Customers must switch by clicking an account selector hosted on their utility's website.
The contents of the file will vary depending on what is selected in the Data Browser. Examples include:
- In the Year view of the Data Browser, customers can see data for a specific fuel at the service agreement level. This means that if they click Green Button to download their usage, the downloaded file contains data at the service agreement level for whichever fuel they selected.
- In the Bill and Day views of the Data Browser, customers can see data at the service point level if they have multiple service points associated with the same service agreement. This means that if they click Green Button to download their usage, the downloaded file contains data at the service point level. However, note that the service agreement ID (and not the service point ID) is what will be listed in the downloaded file.
- If a customer has two fuels, they can download data separately for their gas and electricity usage. If a customer has two or more service points of the same fuel type (for example, a customer with one for regular electric usage and one for an electric vehicle) and clicks to download data, then a zip file is generated containing a CSV or XML file for each service point.
- If a dual fuel customer is in the combined view in the Data Browser and clicks to download data, then a zip file containing two CSV or XML files is generated: one file for electricity and one file for gas.
Resources, AMI Data, and Cost Data
The table below provides the user experience variations depending on the number of fuels or resources, the availability of AMI data, and whether or not the customer has modeled rates. For example, customers with daily AMI data and rates modeled will see daily cost values. Customers with subdaily AMI data and rates modeled will see cost values broken down into the appropriate intervals, such as per hour, half hour, or quarter of an hour. Customers with these same levels of AMI data but without rates modeled cannot see the cost values, but instead can view the energy use values at the same data intervals. The table below lists these and other possible user experience variations.
| Customer Scenario | User Experience |
|---|---|
|
Fuels: Single. Available Data: Billing data. Rates Modeled?: No. |
|
|
Fuels: Single. Available Data: Billing and AMI data. Rates Modeled?: No. |
Customer can choose to export their data in CSV or XML format. CSV
XML
|
|
Fuels: Single. Available Data: Billing and AMI data. Rates Modeled?: Yes. |
Customer can choose to export their data in CSV or XML format. CSV
XML
|
|
Fuels: Multiple. Available Data: Billing data. Rates Modeled?: No. |
Customer can choose to export their data in CSV or XML format. CSV
XML
|
|
Fuels: Multiple. Available Data: Billing and AMI data. Rates Modeled?: No. |
Customer can choose to export their data in CSV or XML format. CSV
XML
|
|
Fuels: Multiple. Available Data: Billing and AMI data. Rates Modeled?: Yes. |
Customer can choose to export their data in CSV or XML format. CSV
XML
|
Solar Data and Multi-Register Meters
The downloaded spreadsheet may have additional columns for customers with multi-register meters and solar technology. This is because multi-register meters can provide more details about energy use within an interval of time, such as the amount of energy consumed from the grid, as well as the amount sent back to the grid due to solar power.
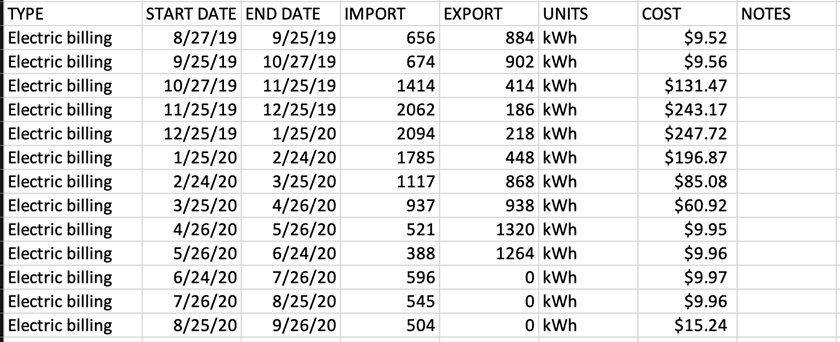
When support for multi-register meter customers is enabled, the downloaded spreadsheet displays columns for IMPORT (energy consumed from the grid) and EXPORT (energy sent back to the grid). The spreadsheet also displays columns for the start and end time of each interval if the customer has subdaily AMI data.
The image below shows an example output for the Export All Bill Totals option in the download menu.
Requirements
- Customers must have multi-register meters.
- Account, Billing, and Premise data feeds must be established with the utility.
- Some additional configuration is required to enable the IMPORT and EXPORT columns. Contact Your Delivery Team for details.
Solar Generation Data
For solar customers who have a meter that tracks solar generation data, the contents of the downloaded file vary slightly. Solar generation data shows the total amount of electricity produced by a customer’s solar panels over a certain period. By contrast, net energy data shows the difference between the amount of energy solar panels produce and the amount a household uses.
The contents of the downloaded file depend on how the customer’s service agreement with the utility is structured. There are two main supported scenarios.
Scenario 1: One Service Agreement, Two Service Points
In this scenario, customers have one service agreement with two service points: a main service point for billing, and another service point for tracking gross solar generation.
- When a customer downloads their energy information at the bill level, the file contains a USAGE (kWh) and PRODUCTION (kWh) column after the END DATE column. Depending on the configuration and other available data, there may also either be a NET (kWh) column, or an IMPORT (kWh) and EXPORT (kWh) column within the file.
- When a customer downloads a file at the interval level, two files are downloaded ---one for each service point. One file contains standard billing information, and the other contains solar generation information.
- The file with solar generation information contains a PRODUCTION (kWh) column showing the total amount of power produced in each interval. Additionally, the Service header row contains the term "SOLAR".
- Alternatively, depending on the configuration and other available data, the file with solar generation information contains IMPORT (kWh) and EXPORT (kWh) columns showing how much energy the customer's household received from the grid or sent back to the grid based on what their solar panels produced.
Scenario 2: Two Service Agreements, Two Service Points
In this scenario, customers have two separate service agreements: one service agreement with a service point for billing, and another service agreement with a service point for solar generation.
- When a customer downloads their energy information at the bill level, two files are downloaded---one for each service agreement. The main billing service agreement file contains standard billing information. The solar generation service agreement file contains a PRODUCTION (kWh) column. Additionally, the Service header row contains the term "SOLAR".
- When a customer downloads their energy information at the interval level (that is, for a day or a range of days), two files are downloaded---one for each service agreement's service point. One file contains the standard usage and cost information, and the other contains solar generation information.
- The file for the solar generation service point contains a PRODUCTION (kWh) column showing the total amount of power produced in each interval. Additionally, the Service header row contains the term "SOLAR".
- Alternatively, depending on the configuration and other available data, the solar generation file contains IMPORT (kWh) and EXPORT (kWh) columns showing how much energy the customer's household received from the grid or sent back to the grid based on what their solar panels produced.