Usage Breakdown View
The Usage Breakdown view of the Data Browser allows customers to explore how their energy usage or energy costs are distributed among available disaggregation categories (or end-use categories) over time.
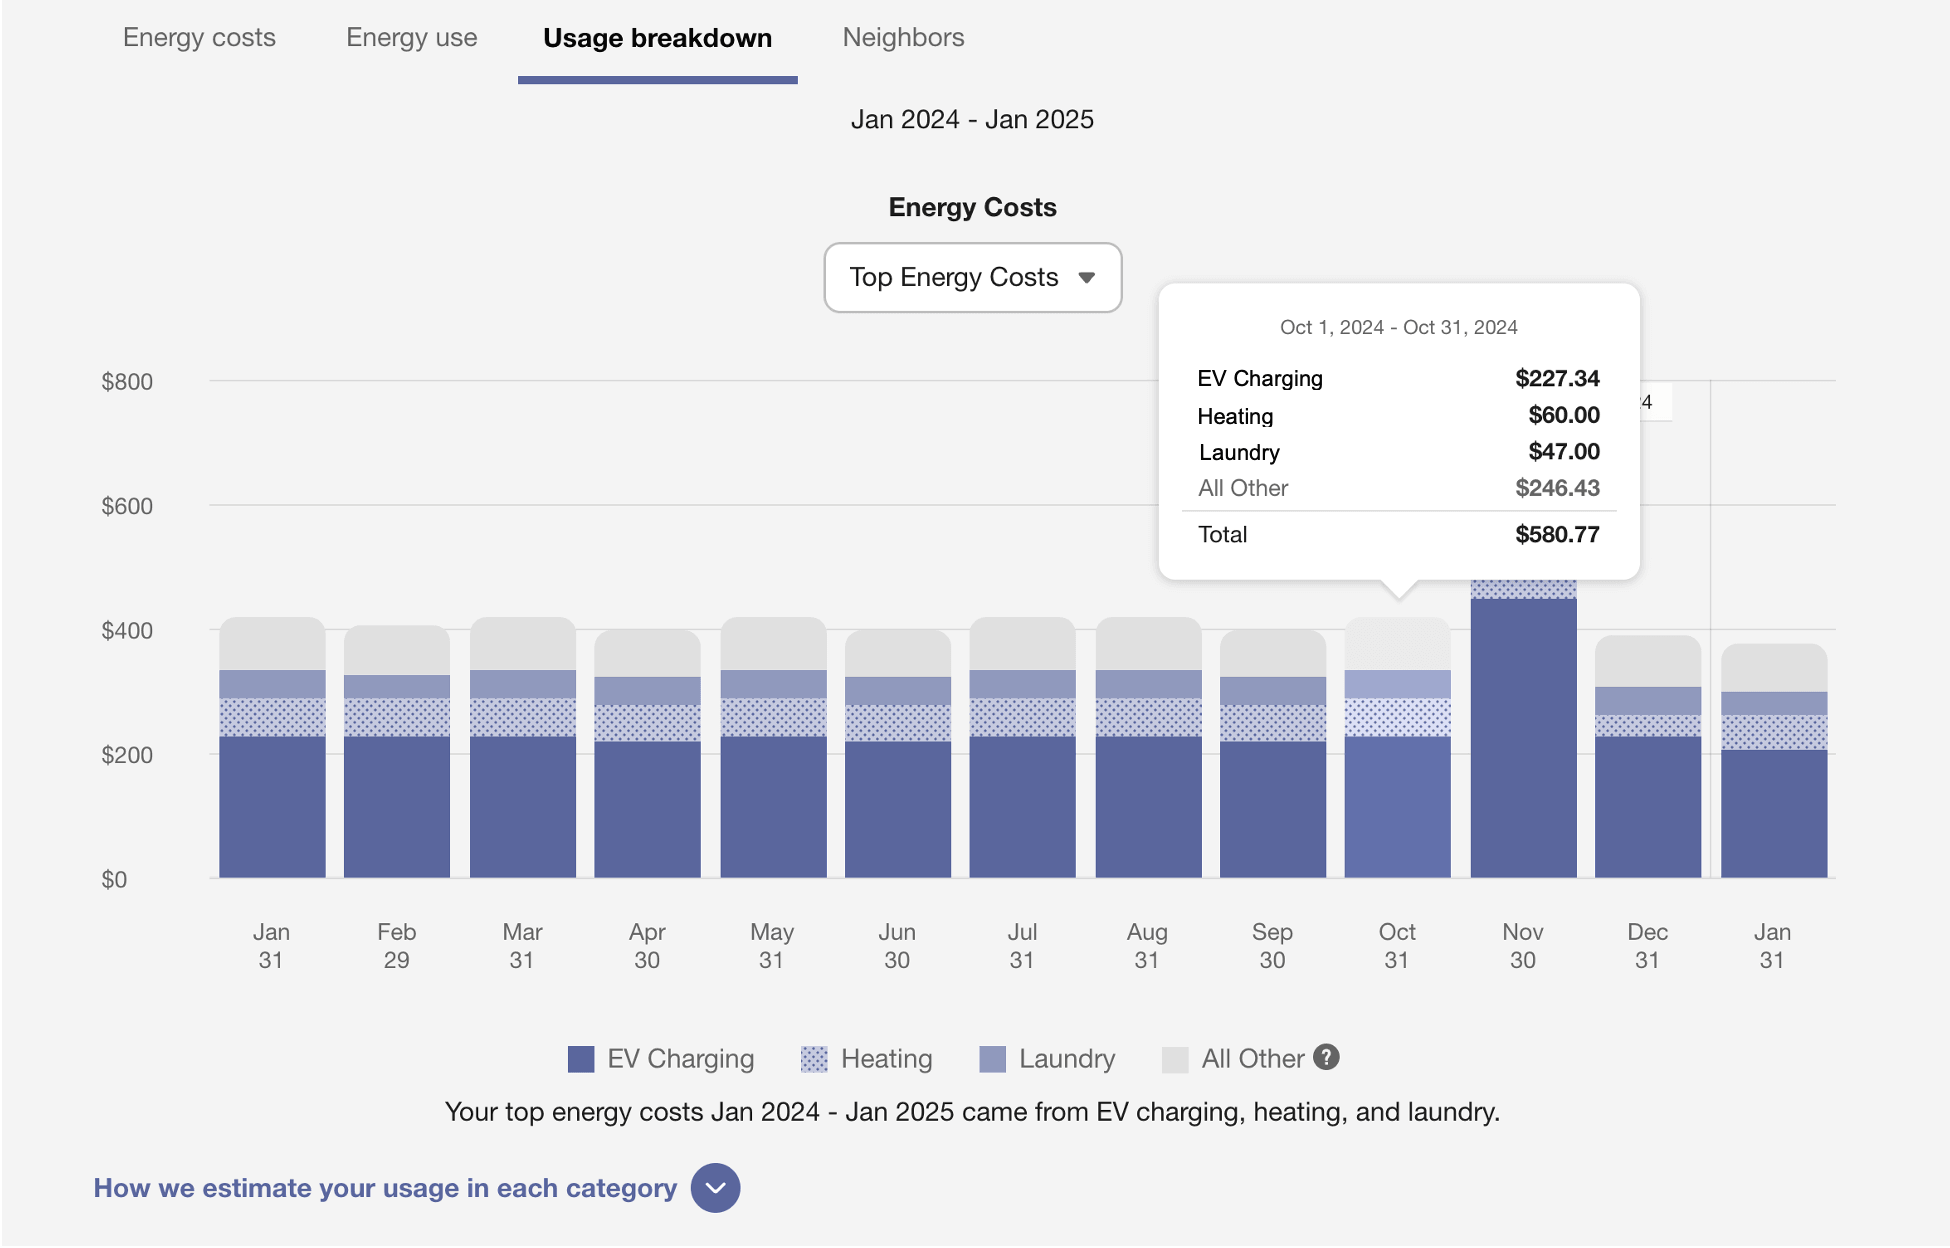
Configuration Options
For each element listed in the table, indicate the desired configuration in the Input Value column. If you do not provide an input for optional configurations, the default will be used.
| Configuration Option | Input Value |
|---|---|
|
General Configuration There are several general configurations you can make to the Data Browser, such as the order of the graphs or views, the default fuel or resource type selected, and the default time menu selected. See Data Browser for more details about what general configurations are available. |
Not applicable. |
|
Unit of Value for Disaggregation Bars The bars in the Usage Breakdown chart can be configured to display cost values or energy use values. Cost values are recommended because they help customers understand the financial impact of their energy use. Default: Cost values. |
Optional Choose one of the following:
|
|
Usage Breakdown Table Visibility The widget can be configured to hide the expandable table that appears below the Usage Breakdown chart. Keeping the table displayed is recommended because it presents the same information in another useful format for comparison and analysis. Default: Display the table. |
Optional Choose one of the following:
|
|
Disaggregation for Solar Customers The widget can be configured to show a disaggregation for eligible net-metered solar customers. The explainer below the graph mentions solar panels, and the insight message changes slightly to imply that the disaggregation is based on an estimate. Default: Disabled. |
Optional
|
User Experience Variations
The user experience may vary for customers and utilities depending on their service types (gas, electricity, dual fuel, and so on), available data, costs, locale, and other factors. For more information, see Usage Breakdown in the Digital Self Service - Energy Management Cloud Services Overview.