Peak Period Disaggregation Module
This module provides customers with insights about what appliances they use the most during peak hours each week, when included in the weekly email, and each bill period when included in the Post-Bill Report email. The disaggregation highlights up to six customer end uses to provide customers with a holistic view of their usage. End uses are split into quantified and unquantified groups based primarily on the level of detail we have about the appliance use.
Quantified End Uses: Quantified categories include end uses for which our disaggregation algorithms are able to provide an accurate estimate of how much of the appliance a customer was using during peak hours, and therefore, can be associated with a specific metric, such as kWh, percentage, or cost. The top three of these appliances are presented in the top portion of the disaggregation breakdown and accentuated with images.
Unquantified End Uses: The unquantified section includes end use categories that we can successfully detect if a customer used them during peak hours, but we cannot provide an accurate estimate of how much the customer was using the appliance during peak hours. These appliances are presented in the bottom portion of the disaggregation breakdown.
Together, the quantified and unquantified groups provide the customer with a comprehensive picture of what contributes to their peak hour energy use.
Note:
Whether a category is quantified or unquantified is determined by the data that is available from the utility and by the disaggregation model.
The disaggregation is followed by a call to action encouraging the customer to complete or update their Home Energy Analysis. The goal of this module is to raise the customer's awareness of which of their quantified and unquantified appliances contribute the most to on-peak energy use so that they can take action to save energy during on-peak billing periods.
Requirements and Limitations
This section discusses customer requirements and limitations.
Customer Requirements
| Category | Description |
|---|---|
|
Data Requirements |
AMI (hourly or more granular) data. There are additional AMI data requirements to show advanced insights such as appliance-level disaggregation. Contact your Delivery Team for more information. |
|
Data History |
AMI data for at least one period. |
|
Data Coverage |
The customer must meet the default scored AMI data threshold and may not exceed the maximum number of missed AMI reads for the billing period. Contact your Delivery Team for more information. |
Limitations
These are the limitations:
- Seasonal Transition: Costs cannot be calculated for this module if the data period overlaps the seasonal transition date.
Configuration Options
For each element listed in the table, indicate the desired configuration in the Input Value column. If you do not provide an input for optional configurations, the default will be used.
| Configuration Option | Input Value |
|---|---|
|
Allowable number of missed days of scored AMI data By default, the number of allowable missed days of scored AMI data is 2. |
Optional Choose one of the following:
|
|
Exclude Disaggregation Categories Shown The default is heating, cooling, EV charging, dryer use, water heating, dishwasher use, and oven use. Any of these can be excluded by the utility. Note: This configuration is shared with the Post-Bill Report. |
Optional Choose one of the following:
|
User Experience Variations
This section discusses the user experience variations in the Peak Period Disaggregation module.
When Included in the Post-Bill Report
The module varies as follows when included in the Post-Bill Report.
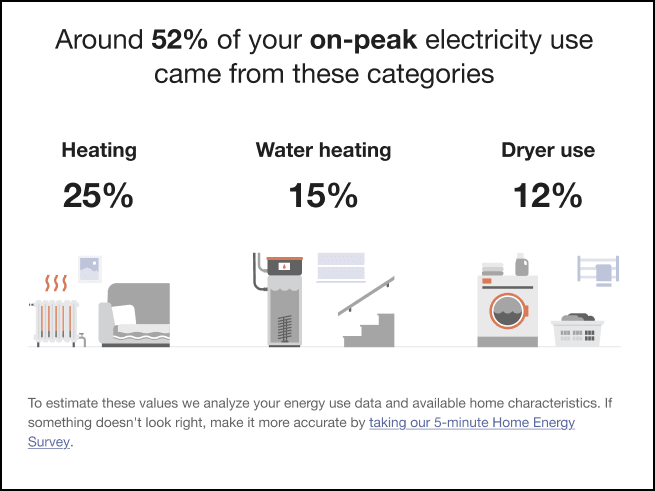
Header: The header introduces the customer to the module by telling them how much of their usage this month was associated with their top three appliances during on-peak hours. For example, "Around 52% of your on-peak electricity use came from these categories".
Header
The header varies by the data state and number of appliances.
Quantified and unquantified category behaviors operate independently from each other, with the exception of instances where there are no quantified use categories to report.
| Header Type | Cost or Usage | Property Name / Description | Usage |
|---|---|---|---|
| Quantified Header | Usage | Usage - multiple-quantified-categories | Around % of your on-peak electricity use came from these categories: |
| Usage - one quantified category | Around % of your on-peak electricity use came from <category> | ||
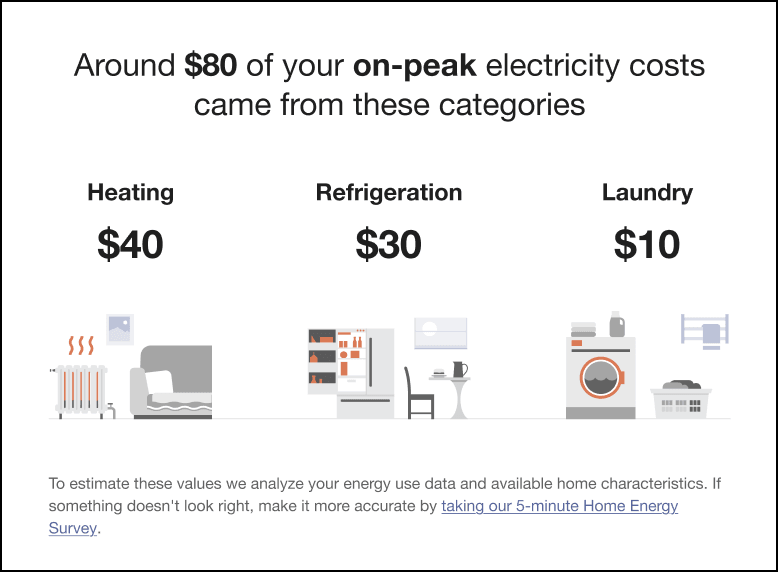
| Cost | Cost - multiple-quantified-categories | Around $ of your on-peak electricity costs came from these categories: | |
| Cost - one quantified category | Around $ of your on-peak electricity costs came from <category> | ||
| Not applicable | No quantified category | Section is omitted from the report. | |
| Unquantified Header | Not applicable | Quantified categories | Other contributors to your on-peak electricity use include: |
| No quantified categories present | No quantified categories present | Contributors to your on-peak electricity use include: | |
| No unquantified categories | No unquantified categories | Section is omitted from the report. |
Zero Quantified Use Categories and One or More Unquantified Use Categories
If there are no quantified use categories, the quantified portion of the disaggregation breakdown is omitted from the report.
One Quantified Use Category and Zero Unquantified Use Categories
If there is a single quantified use and there are no unquantified use categories, the quantified heading modifies to address the single data state, and the single quantified use is highlighted with a centered image. The unquantified portion of the disaggregation breakdown is omitted from the report.
Two or More Quantified Use Categories and Zero Unquantified Use Categories
If there are multiple quantified use and there are no unquantified use categories, the unquantified portion of the disaggregation breakdown is omitted from the report.
More Than Three Quantified Use Categories
If there are more than three quantified appliances available, the top three highest uses are listed in the quantified section. Any remaining quantified appliances are added to the alphabetical list of non-quantified uses. For example, EV charging will be listed in the unquantified usage list for a client if it is the quantified appliance category for a customer with quantified appliance data for Cooling, Dryer Use, Water Heating, and EV Charging.
No Quantified or Unquantified Use Categories
If there are no appliances in both the quantified and unquantified sections, the module will be hidden. No fallback message is displayed.
Data Overlapping the Seasonal Transition Date
Costs cannot be calculated for this module if the seasonal transition occurs within the module look back period. The behavior of the module is impacted by whether or not the peak hours data has changed.
Peak hours have changed: If peak hours changed at the season transition, and the look-back period for a given module overlaps the season transition date, then the module fails and the individual module is not included in the email. The report will still be sent with the remaining modules.
Peak hours have not changed: If the customer's peak hours have not changed, one of the following variations occurs:
- If peak hours have not changed in a period that overlaps the seasonal transition, the Transition module is shown in usage form.
- If peak hours have not changed in a period that overlaps the seasonal transition, and non-peak data for other data changing modules in the report have changed during the season transition date, then all of the report modules are shown in usage form. Costs are not calculated or shown.