Analytics
This tab displays test run analytics with the ability to filter the data using several data points. The tab has three zones:
- The first zone has two visualizations that can be used to visualize the flow run data based on the filters provided at the top of the dashboard:
- Product Family: Filters the visualization data to include flows that belong to the product family selected.
- Product Name: Filters the visualization data based on the selected product name
- Module Name: Filters the visualization data to include flows that belong to the module name selected.
- Flow Name: Filters the visualization data to include flows that start or end with a set of characters.
- Start Date: Filters the visualization data to include flow runs that are after the start date.
- End Date: Filters the visualization data to include flow runs that are before the end date.
The following figure shows the filters applicable for visualizations in the first zone:
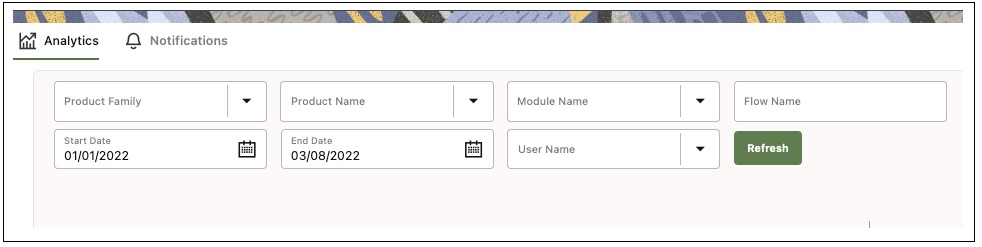
Figure 4-1 Dashboard visualization filters
After selecting the filter criteria, click Refresh to refresh the visualizations in the first zone. The results are displayed based on the filtered data.
- The first visualization, Flow Run History, provides a view of the cumulative of test flow run results based on the filter criteria. This graph also supports rolling window based visualization, so results can be further filtered across time windows. This visualization shows the count of flow runs divided by their statuses (Stopped, Failed and Passed) subject to the filters.
The following figure shows the rolling window based visualization under the first zone in the dashboard.
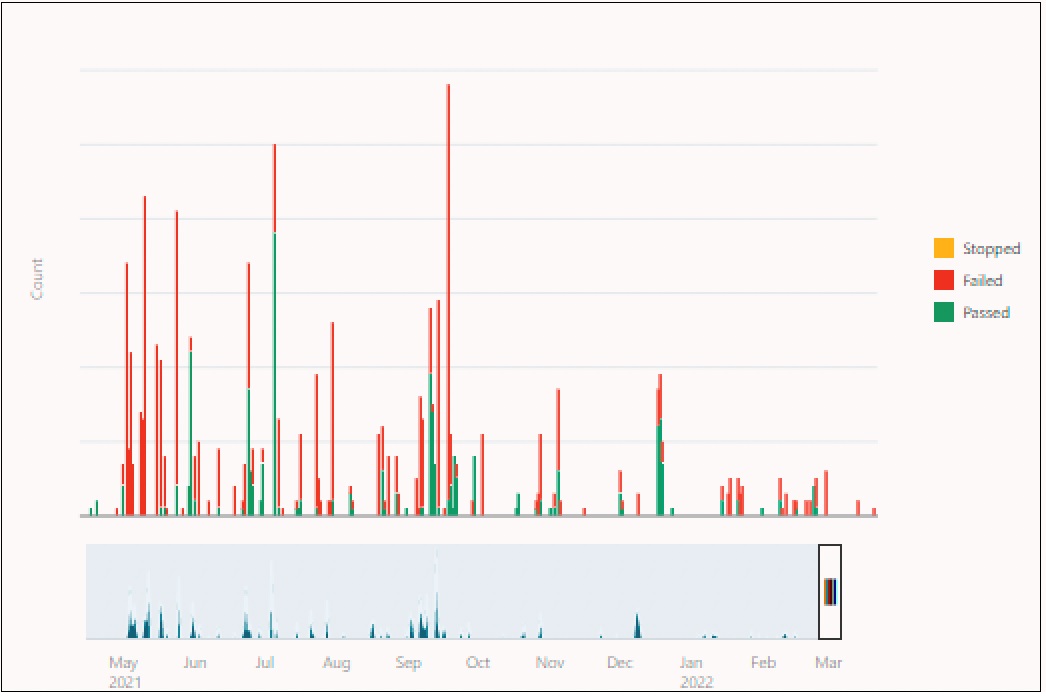
Figure 4-2 Flow execution results over time
- The second visualization, Flow Usage, helps ascertain the count of flows between flows that were never run, flows that were run but had never passed, and flows that had passed at least once, subject to the filters.
The following figure shows the second visualization related to flow run status:
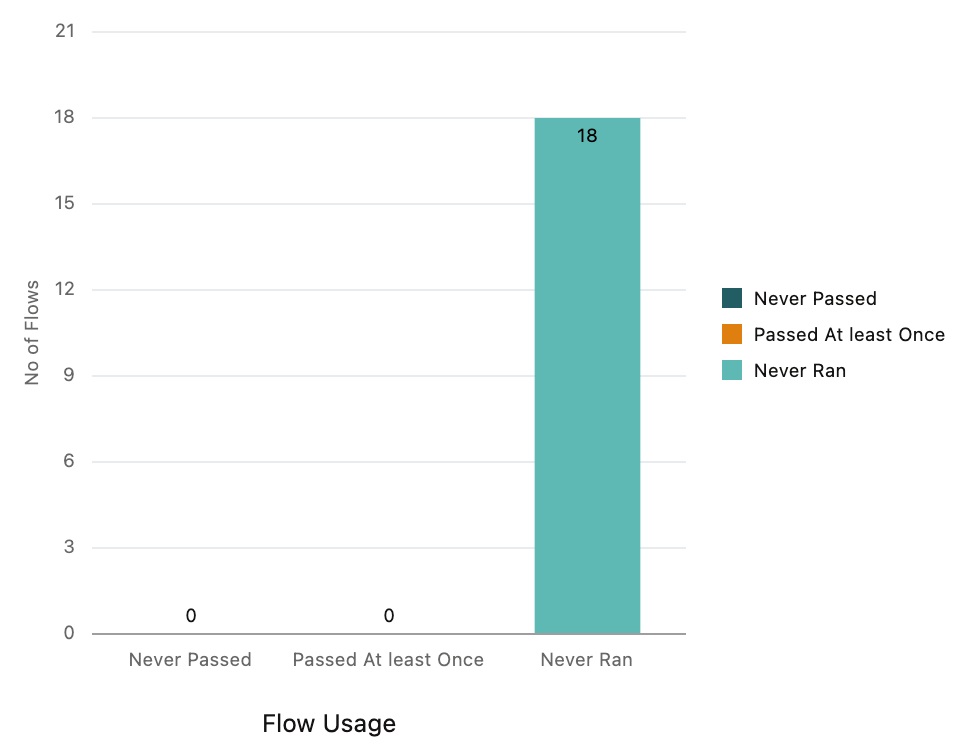
Figure 4-3 Flow usage by run and pass status