Weekly Comparison Module
This module compares the customer’s electricity or gas costs for the current week with those of the previous week and provides feedback based on the comparison. If the customer is dual fuel, the module includes graphs for both electric and gas use. If the customer is eligible to receive cost information, a cost comparison is shown instead of a usage comparison.
Requirements and Limitations
This section discusses customer requirements and limitations.
Customer Requirements
This table lists the customer requirements:
| Category | Description |
|---|---|
|
Data Requirements |
AMI (hourly or more granular) data. |
|
Data History |
AMI data for the last two weeks. |
|
Data Coverage |
The default requirements are: 50% read coverage for the week covered by the report. 50% read coverage for the week preceding the report one. This product does not differentiate between estimated and non-estimated reads. Both types of reads are supported. |
| Rates | Utility rates must be modeled by Oracle Utilities for cost information to appear. If rates are not modeled, energy use information is displayed by default. If the utility chooses to display cost information, rate modeling is required during initial program setup for an additional fee. See the Oracle Utilities Opower Rates Engagement Product Overview for more information. |
Limitations
These are the limitations:
-
Zero Usage: In the case when a customer hasn't used any electricity during the week, several checks are completed to determine whether to hide modules, or to fail the entire email communication. The checks are as follows:
- Introduction Email: If the Hourly Usage module has 0 usage, the module is excluded from the communication.
- Weekly Email: If the Weekly Comparison module has 0 usages, the communication is not sent. If the Hourly Usage module has 0 usages, the module is excluded but the communication is sent.
- Emails Including the Season Transition Module: The TOU Load Shifting Weekly email can contain the Season Transition module. If the emails include the pre-transition version of the module and the Weekly Comparison module has 0 usages, the module is excluded from the communication. If the Hourly Usage module has 0 usages, the module is excluded from the communication.
-
Rates with no on-peak period in a given season: The module shows non-peak usage data when no on-peak TOU period is present. See the User Experience Variations.
User Experience
This module includes the following components:
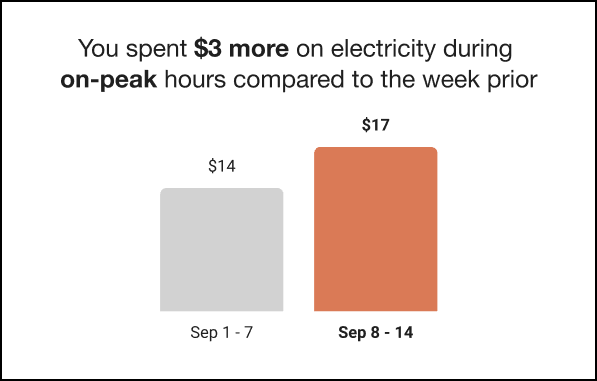
Insight Statement: A message above the graph that varies based on how the customer's costs in the week compare to those of the previous week. For example, if the customer spent less on energy in the current week, the message might say, "Great job! You spent [$X] less on electricity during peak hours this week." The message changes based on the customer's cost comparison. No filtering is performed to remove high or low usage outliers. Partial peak hours are not included in the comparison.
Bar Graph: The module includes a horizontal bar graph that compares the customer's energy costs during peak hours in the previous week to their spending during peak hours in the current week.
This image shows an example of the Weekly Comparison module:
User Experience Variations
This section discusses the user experience variations in the Weekly Comparison module.
Weekly Engagement Reports Gas-Only
For gas-only customers, the electricity unit “kWh” is replaced by “therms” or "CCFs" (whichever unit of measure is appropriate for the utility), and the word "electricity" is replaced by "gas".
Weekly Engagement Reports Dual Fuel
Dual fuel customers see two graphs in the Weekly Comparison, one for electricity usage and one for gas usage. The title is "Compared to last week".
Modeled Rates
If rates are modeled and the utility has opted to display cost information in this module, then cost information is displayed in the comparison rather than usage information.
Negative Values for Solar Customers
For customers on net metering rate plans that support solar credits, negative energy use can be displayed in the Weekly Comparison graph. This can include bars that are displayed below the graph axis to represent negative values as shown in the example below. Be aware the support for negative value display must be configured, which is discussed as part of the global configurations in Design and Configuration.
Load Shifting Reports Variations
When used in Load Shifting reports, the insight statement varies as follows, based on whether the customer spent more, less, or about the same this week:
- You spent [$X] more on electricity during peak hours this week.
- You spent [$X] less on electricity during peak hours this week.
- You spent about the same on electricity during peak hours this week.
Load Shifting Usage Variation
If the email is designed to display usage instead of cost, the module displays the following:
- Insight Statement: You used <XX% more/less> electricity during peak hours this week
- Decimal Places for kWh: When displaying usage, you can configure the module to include up to two decimal places in the kWh display. For example, 4.25 kWh.
Load Shifting Data Overlapping the Seasonal Transition Date
Costs cannot be calculated for this module if the seasonal transition occurs within the module look back period. The behavior of the module is impacted by whether or not the peak hours data has changed.
Peak hours have changed: If peak hours changed at the season transition, and the look-back period for a given module overlaps the season transition date, then the module fails and the individual module is not included in the email. The report will still be sent with the remaining modules.
Peak hours have not changed: If the customer's peak hours have not changed, one of the following variations occurs:
- If peak hours have not changed in a period that overlaps the seasonal transition, the seasonal transition module is shown in usage form.
-
If peak hours have not changed in a period that overlaps the seasonal transition, and non-peak data for other data changing modules in the report have changed during the season transition date, then all of the report modules are shown in usage form. Costs are not calculated or shown.
Load Shifting Rates with Off-Peak and Partial-Peak Periods Only
The module automatically evaluates whether there is an on-peak period in the current rate plan. If there is no on-peak period in the current rate plan, the module will use part-peak data to show off-peak usage.
Note:
This variation is only applicable to the Weekly Comparison module and the Peak Usage Summary module. Disaggregation and bill period modules do not support an off-peak usage variation.