1 What's New in JDK Mission Control 8
JDK Mission Control (JMC) is an advanced set of tools for managing, monitoring, profiling, and troubleshooting Java applications. JMC enables efficient and detailed data analysis for areas such as code performance, memory, and latency without introducing the performance overhead normally associated with profiling and monitoring tools.
Note:
Stack trace graph views such as Graph, Flame, Heat map, and Dependency are currently supported on Linux and Mac.Dependency View
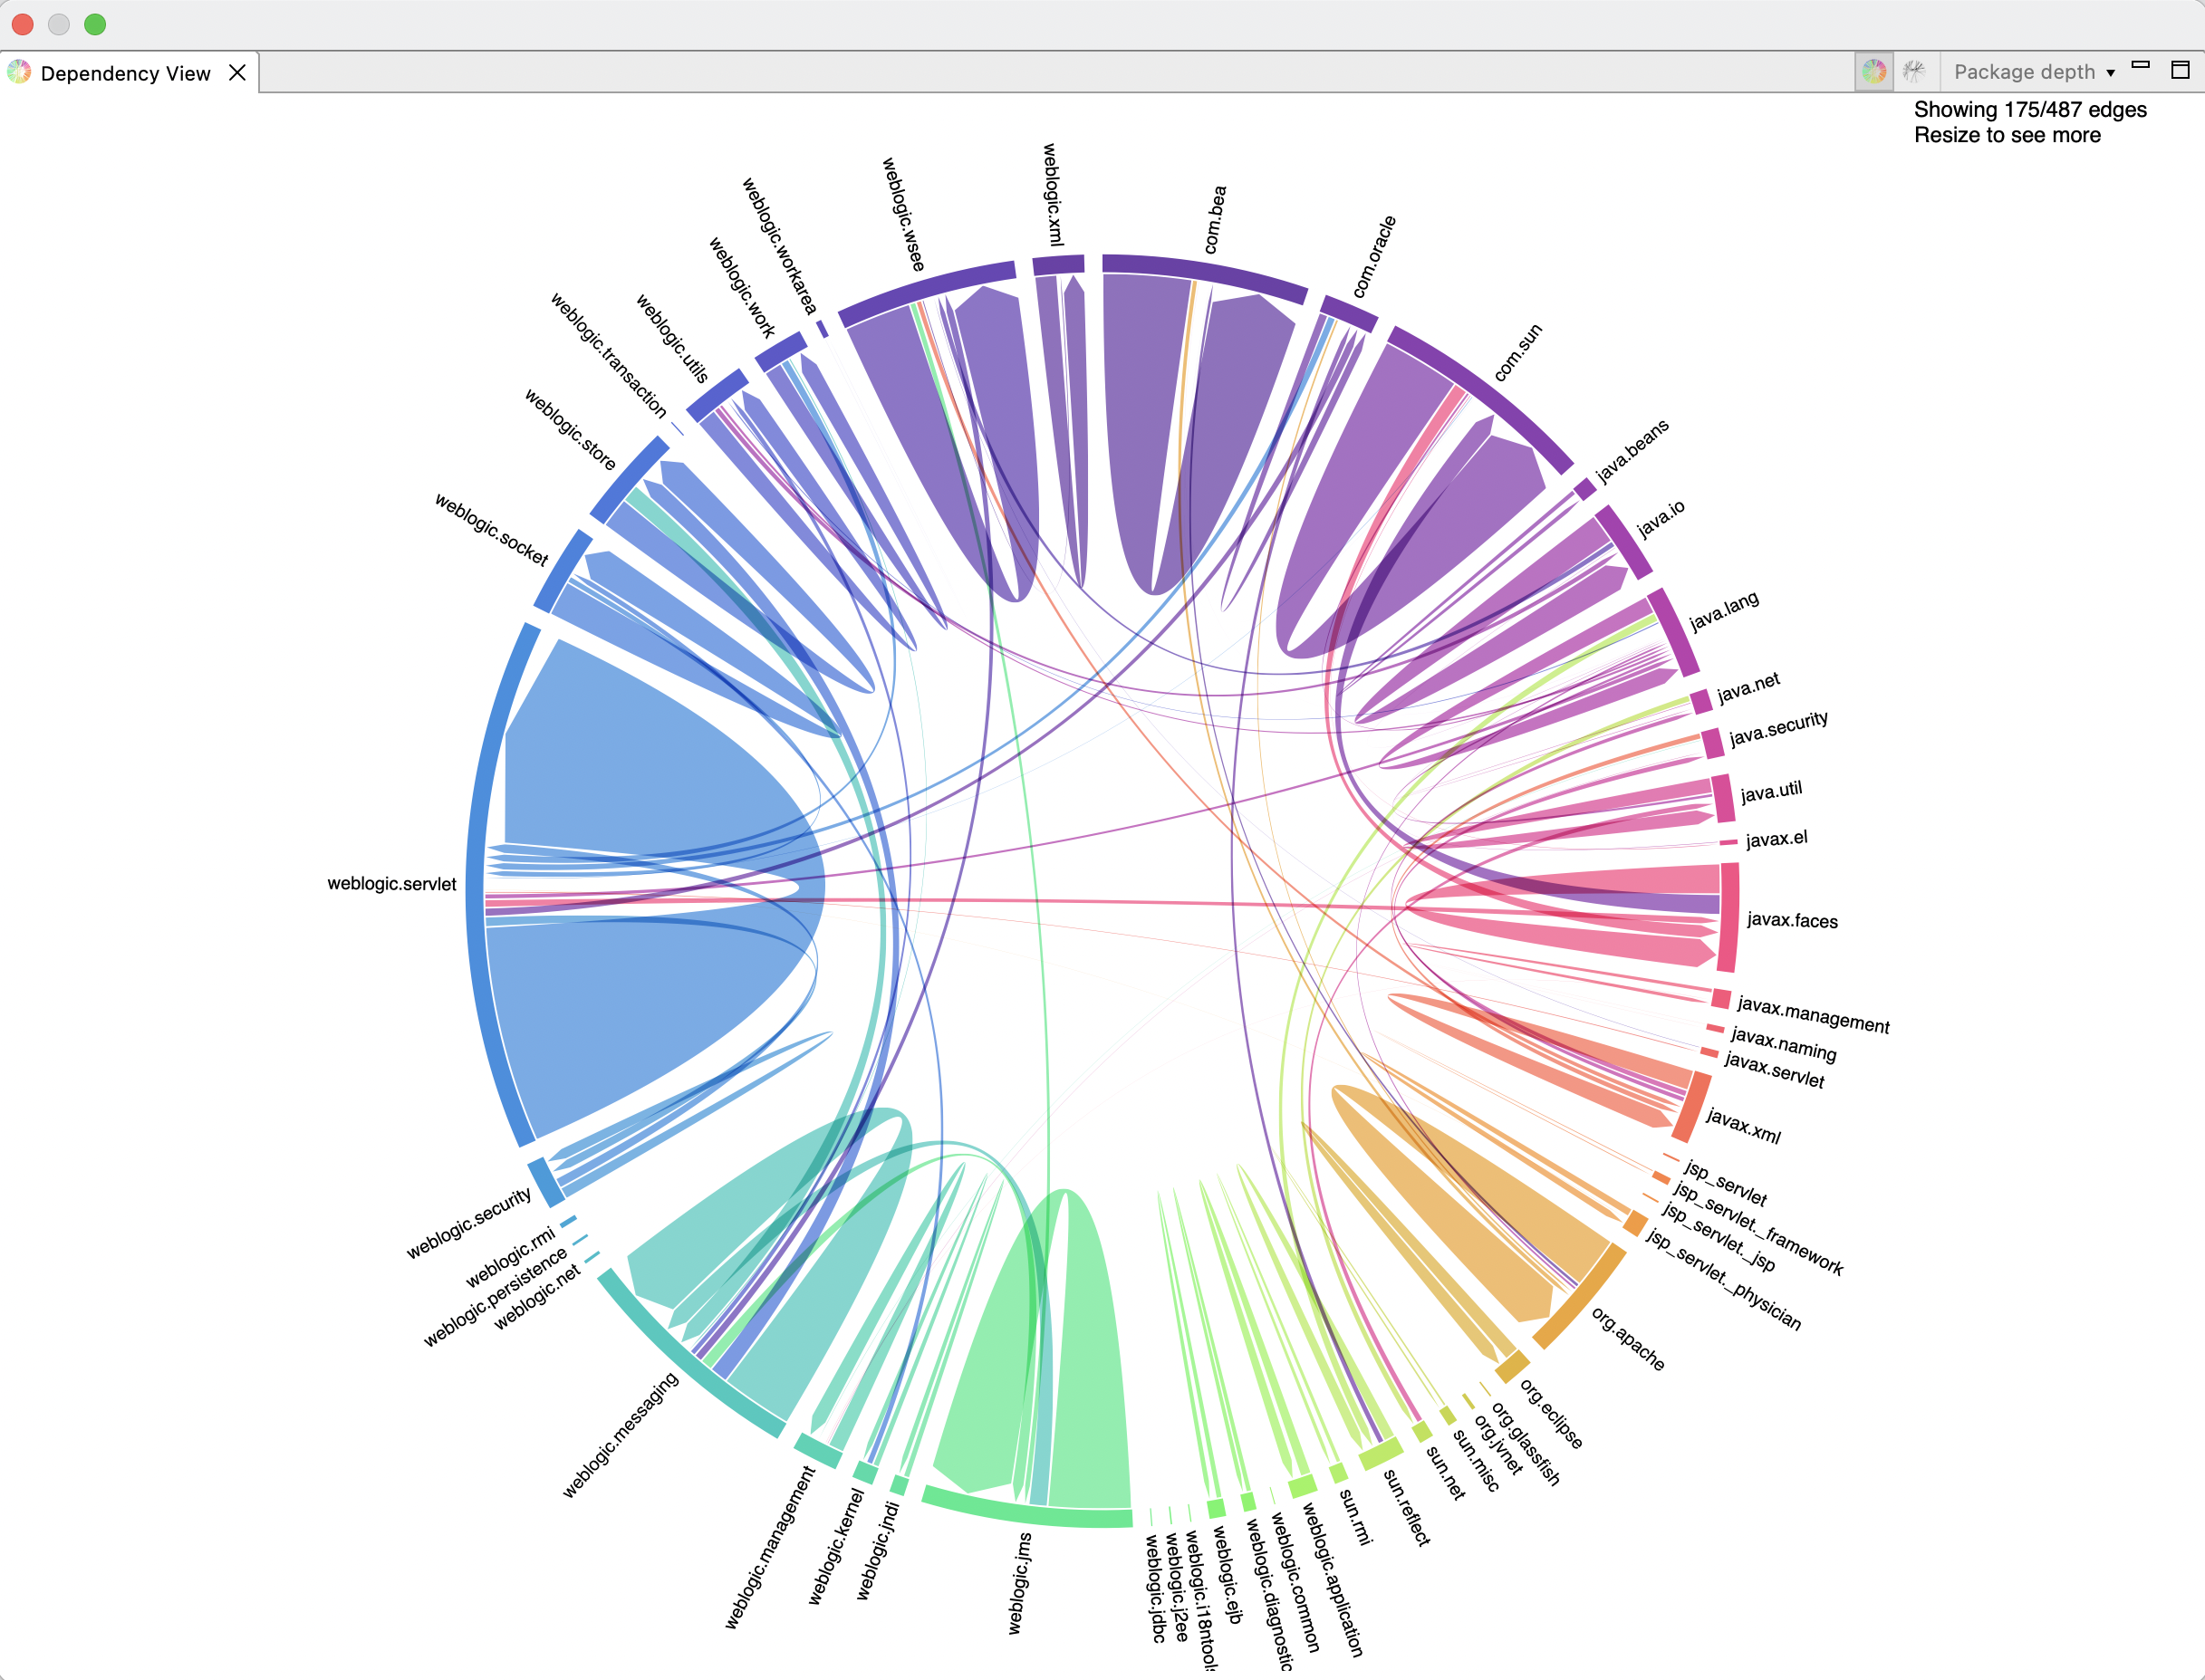
Dependency view presents aggregation of events using hierarchical edge bundling. For example, it helps in visualizing the dependencies between packages.
To enable dependency view in JMC, go to the menu item Window, Show View, Other, Mission Control, and then Dependency View. Click Open.
There are two modes of data representation:
Chord Diagram
Chord diagram show packages arranged radially around a circle, with arcs connecting the data points to indicate dependencies.
Figure 1-1 Chord diagram
Edge Bundling
In the edge bundling visualization, hover over the packages to see dependencies highlighted in a particular color:
- Green: When you hover over a package, the methods in that package call the methods in the linked package.
- Yellow: Methods in the linked package call the methods in the hovered over package.
- Red: Methods in linked package and hovered over package call each other.
Figure 1-2 Edge bundling

Package Depth
To control the size of the graph, you can select the package hierarchy depth at a certain level. This reduces accuracy but it is easier to inspect visually.
For example, when you set the package depth as 3, the package is
displayed as java.util.zip. However, if you set the package depth
to 2, the package is displayed as java.util. The hierarchical depth
is set according to the value selected. By default, the Package depth value is set
to 2.
Graph View
Graph view renders aggregate stack traces with cumulative count. It presents the stack trace in a graphical format, which helps identify method path to its root.
To enable graph view in JMC, go to the menu item Window, Show View, Other, Mission Control, and then Graph View. Click Open.
Here is a sample image displaying the Threads information in the graph view:
Figure 1-3 Graph View
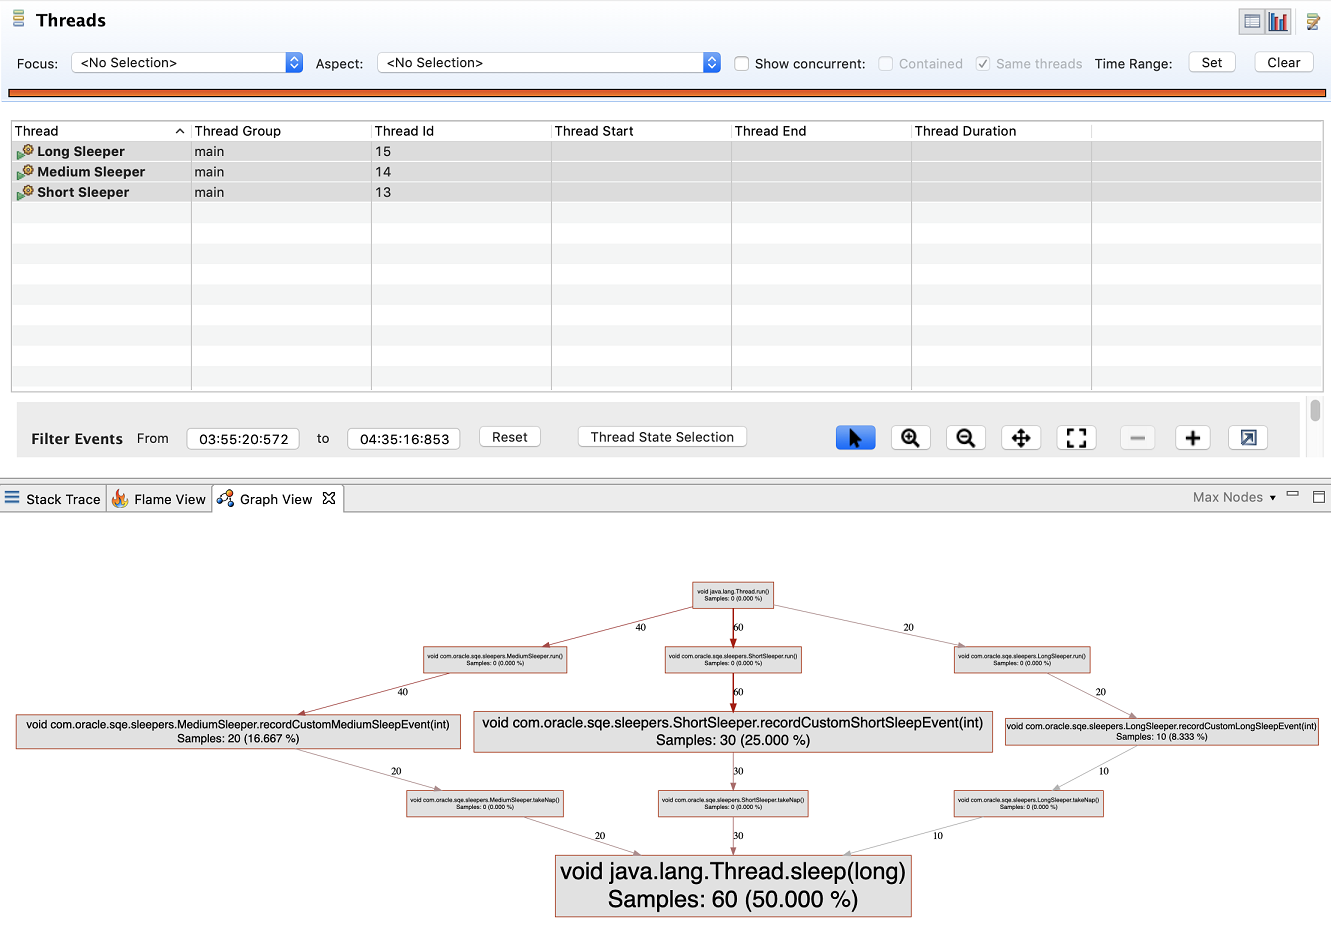
Rendering large graphs is also possible with smart pruning. You can focus on the most impactful nodes (nodes are data points, for example, method calls). In the Max Nodes drop-down, select the target number of nodes; the visualization will render maximum of that many nodes.
Heatmap View
Heatmap view provides a visual representation of events occurred during a specific time period within the stacktrace. The values are color coded, which helps to analyze complex data at a glance.
To enable heatmap view in JMC, go to the menu item Window, Show View, Other, Mission Control, and then Heatmap View. Click Open.
Here is a sample image of Heatmap view:
Figure 1-4 Heatmap view
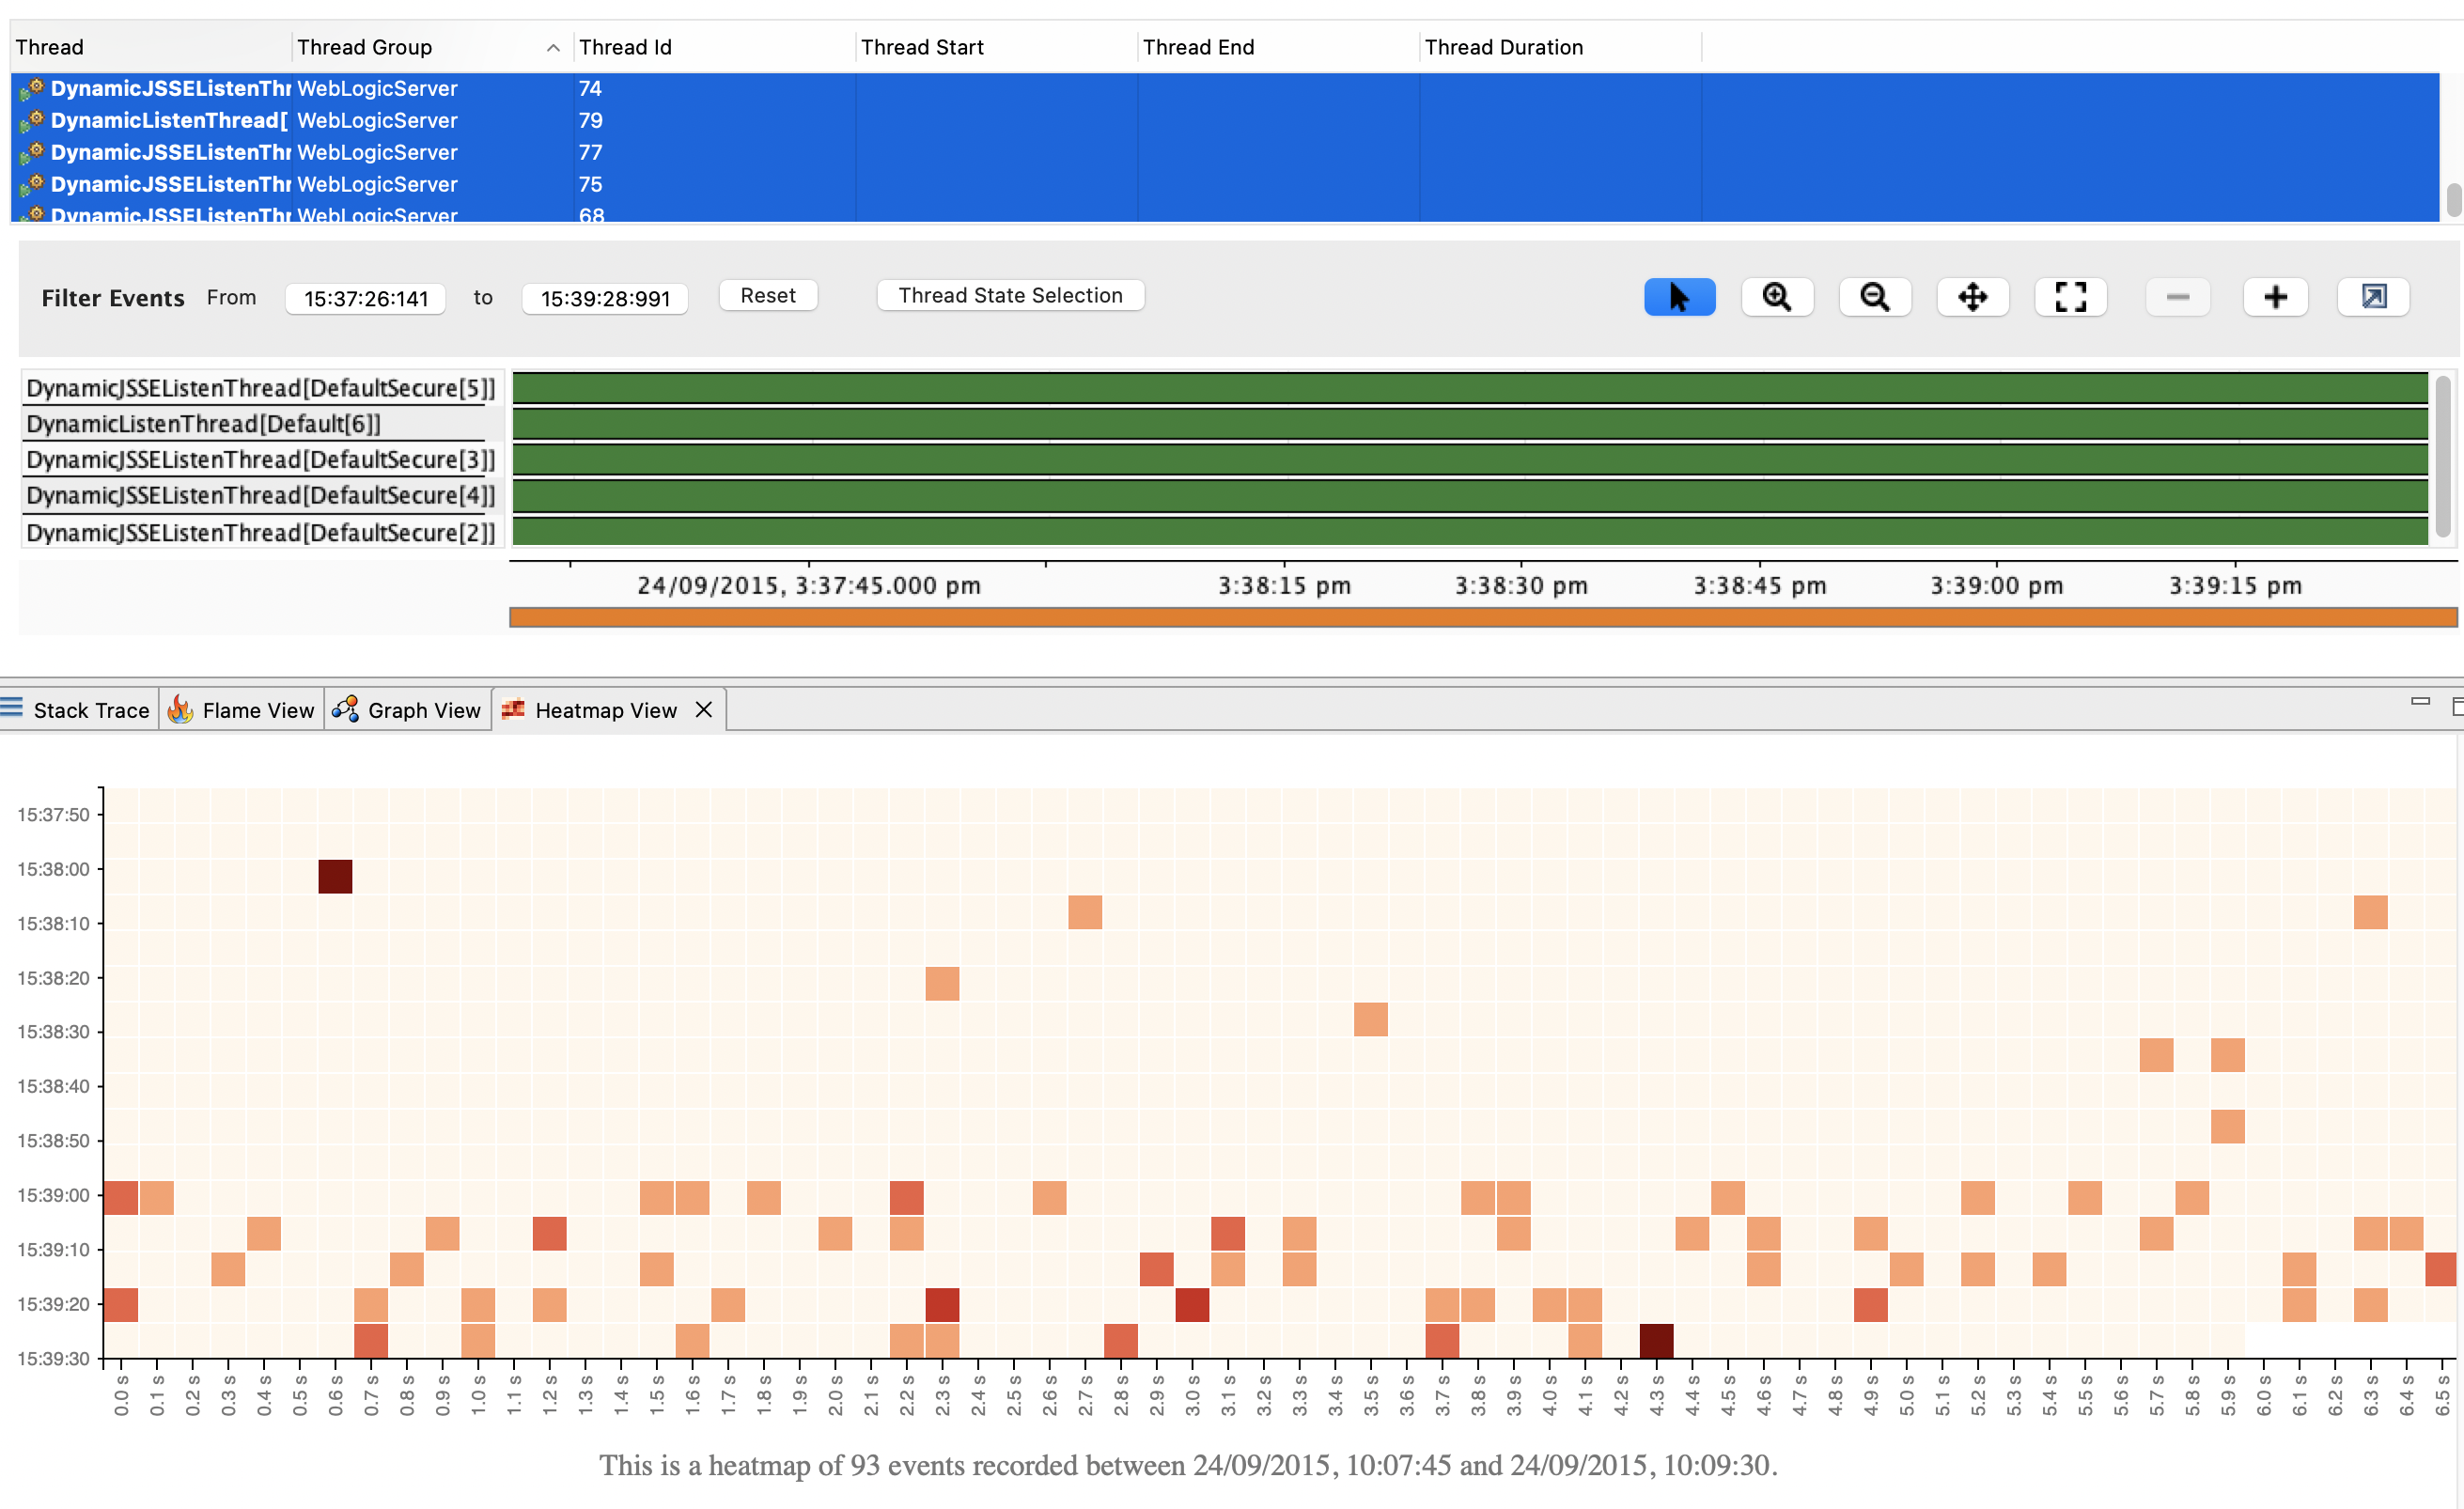
Each cell represents an event that was recorded during a specific time period. Different colors indicate various events that occurred during a particular time period.
Flame Graph View
Flame Graph view renders aggregated stack trace collected by the JFR events. It helps in faster comprehension and reduced time for root cause analysis.
To enable flame graph view in JMC, go to the menu item Window, Show View, Other, Mission Control, and then Flame View. Click Open.
Figure 1-5 Flame View
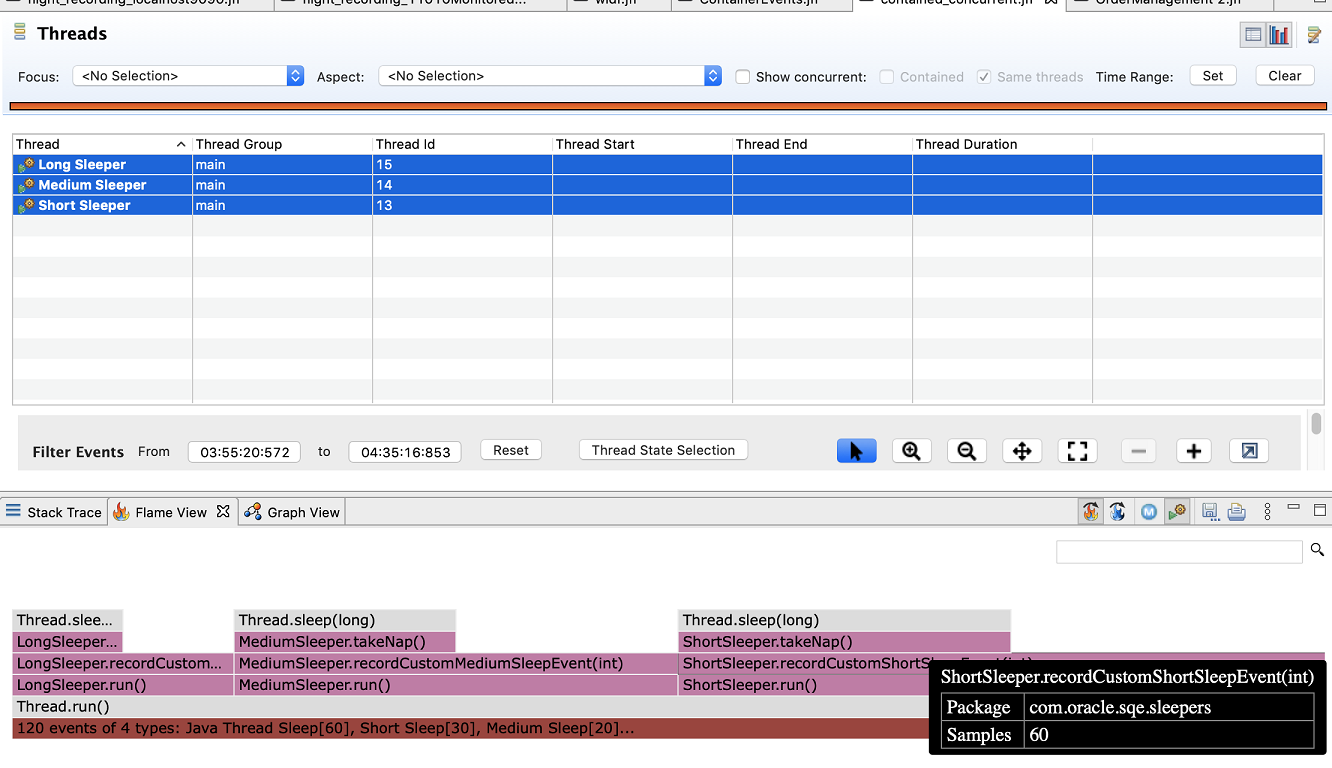
A flame graph view has the following features:
- A stack trace is represented as a column of boxes, where each box represents a function (a stack frame).
- The x-axis shows the stack trace collection and the y-axis shows the stack depth.
- The width of the box indicates the frequency of function occurrences. The wider the boxes, function occurrences are more, as compared to narrow boxes.
- The search field helps you to search for a specific term, which can include regular expressions. The searched functions are highlighted. Also, the sum of matched stack traces is shown on the flame graph as a percentage of the total profile. This is useful not just for locating functions, but also for highlighting logical groups of functions.
- The orientation of the graph can be switched by selecting the Flame Graph or Icicle Graph icons. The Icicle Graph displays top-to-bottom orientation, whereas the Flame Graph displays bottom-to-top orientation.
You can aggregate the Flame graph and Stack trace by selecting the required attribute. In the Samples drop-down, select either Allocation Size or TLAB Size. The Flame View and/or Stack Trace view is presented according to the sample selected.
Websocket Server to Access JFR Stack Trace
When you select JFR events in JMC, you can access their associated stack trace as JSON data through a user-defined port. You can programmatically control the visualization directly in the browser. It allows you to develop or alter visualization using data visualization tools.
The websocket server port is disabled by default. To enable, click Windows, Preferences, JDK Mission Control, and then Flight Recorder. In the Flight Recorder Setting dialog, provide the port number in the Websocket server port field. Set 0 to disable the port.
JMC Agent
JMC agent is used to instrument or inject custom JFR events to your running JVM or applications without the need to restart the applications. You don't need to program the JFR instrumentation in the source code of the application to use JMC agent.
Here are some of the features and advantages of JMC agent:
- You can use XML configuration to define the inject events
- You can dynamically add events at runtime
- JVM agent is extremely versatile; you can dynamically load or sideload the agent anytime
- It causes minimal footprint; you can issue only event-related function calls
- It is suitable for production use when the source is not available
Using JMC agent plugin, you can manage predefined configurations and also view live information about the resulting transformations.
Click JMC Agent from JVM Browser tab to Start JMC Agent. The prerequisites to start the agent are:
- Build the Agent JAR: See JMC Agent
Readme to to build the
agent.jar. In the Start JMC Agent dialog, browse and connect to the Agent JAR file. Use the latest version of the code for building the agent. - Define the JFR event in an xml file: You can either create an xml file manually or use JMC Agent Preset Manager, which is the user interface to create the XML file.
Note:
- If the target application that you need to
instrument is running on JDK 11 or later, then run your
application with the JVM argument:
--add-opens
                                                java.base/jdk.internal.misc=ALL-UNNAMED
. - If the target application that you need to
instrument is running on JDK 8, then run your application
with the JVM argument
-XX:+UnlockCommercialFeatures
                                                -XX:+FlightRecorder
.
Agent Live Config: Right-click the JMC Agent to open Agent Live Config console. You can use this page to view the Global Configurations applied to the agent, along with the Event List and Event Details.
JMC Agent Preset Manager: Preset Manager will help you to create, edit, and modify the configuration templates. Click Windows and select JMC Agent Preset Manager. You can Add an xml file with only required options, Edit the file, or Import Files to manage the configurations.
JMC Agent Plugin
JMC agent plugin integrates JMC agent features into JDK Mission Control. You can use the plugin to start the JMC agent and connect to a local JVM through the JMX API.
Treemap Viewer in JOverflow
Treemaps are used to visualize the memory usage by classes. It helps to identify the resources consuming most RAM or memory. Like JOverflow instance viewer, the treemap viewer utilizes the filter feature provided by JOverflow.
To enable JOverflow Treemap view in JMC, go to the menu item Window, Show View, Other, JOverflow, and then JOverflow Treemap. Click Open.
Here is a sample image of JOverflow Treemap:
Figure 1-6 JOverflow Treemap
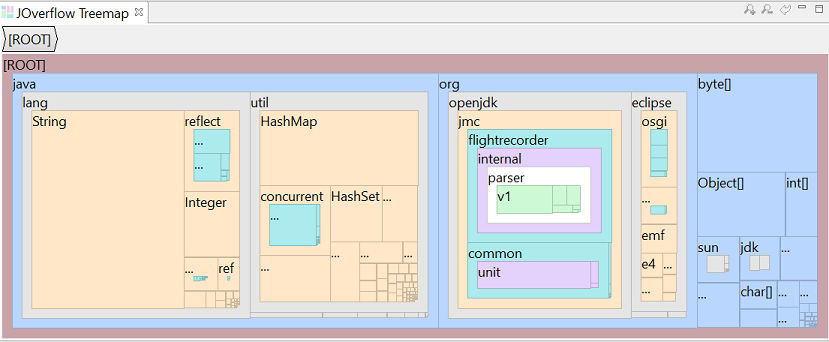
The squarified treemap is displayed where memory usage is aggregated by class and package names. The larger area depicts more memory consumed by the class or package. The background colors indicate the treemap nodes at different levels.
Coherence Tab Pack Plug-in Converted to SWT
Coherence Tab Pack plug-in is used for viewing cluster information as well as aggregated Coherence MBeans. Coherence plug-in is now converted to Standard Widget Toolkit (SWT), which removes dependency on JDK 11 and JavaFX.
See Install Plug-ins for JMC Standalone Application for the process to install the plug-in.
The Coherence Tab Pack plug-in consists of the following tabs:
- Cluster Overview: Provides various metrics regarding the overall health of the cluster
- Machines: Provides information about all the cluster machines, including cores, load, and memory pressure
- Members: Provides details about the individual members
- Services: Provides information regarding the running services and various performance metrics
- Caches: Lists the individual cache and their size, memory footprint, and individual node details
- Proxy Servers: Displays proxy servers and connections
- Persistence: Provides information about active or on-demand persistence
Support for LZ4 Compressed Recordings
JMC 8 now supports working with JFR recordings that are compressed using LZ4 format. LZ4 is an extremely fast decoder, which provides compression speed of more than 500 MB/s per core and is scalable with multi-cores CPU.
You can compress the JFR recordings that are in zip
or gzipped format. Use the file utility to
know the file type. Compress the data (.jfr) file using LZ4 utility or
record using compress=true.
Example code to compress JRF recording:
$ lz4 <un_compressed_filename>.jfr <compressed_filename>.jfr

Output: Compressed 8182601 bytes into 3626010 bytes ==> 44.31%
Improved Thread Graphs
Thread graph is enhanced with the following:
- Time filter that display the start and end time of the visible range
- Zoom in and zoom out functionality
- Zoom to automatically select the highlighted area on the chart
- Vertical and horizontal scrolling of chart canvas
Allocation Pressure Column Added to Memory and TLAB Pages
A new column is added to the Memory page to display the Total Allocation as a percentage value - Total Allocation (%).
A new tab By Top Methods is added to the TLAB Allocations (Thread Local Allocation Buffers) page in addition to the existing By Threads tab to classify the Item Histograms against Top Methods. Both tabs now have Alloc in TLABs (%) and Alloc Outside TLABs (%) columns, which provides estimated allocation size of TLAB as percentage. These updates will make it easier to view relevant areas of allocation pressure.