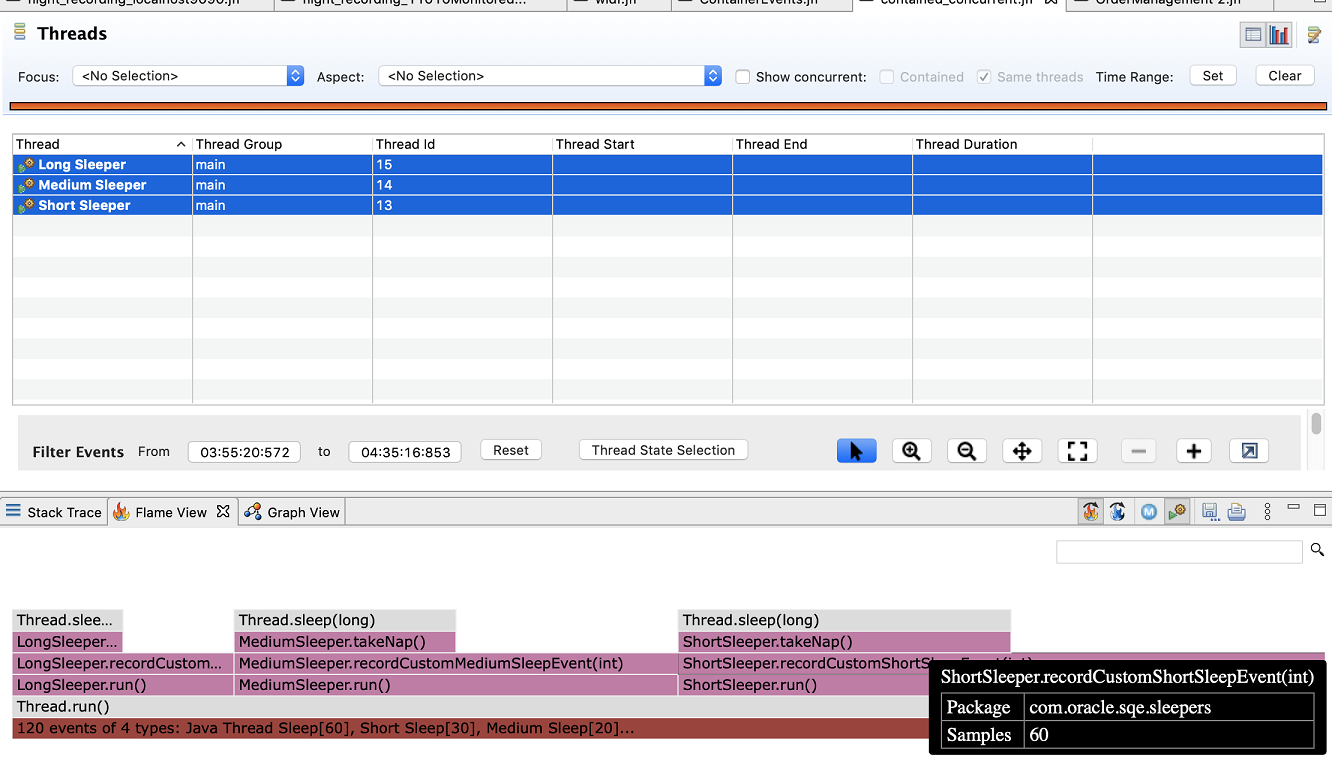
Flame Graph View
Flame Graph view renders aggregated stack trace collected by the JFR events. It helps in faster comprehension and reduced time for root cause analysis.
To enable flame graph view in JMC, go to the menu item Window, Show View, Other, Mission Control, and then Flame View. Click Open.
Figure 4-1 Flame View

A flame graph view has the following features:
- A stack trace is represented as a column of boxes, where each box represents a function (a stack frame).
- The x-axis shows the stack trace collection and the y-axis shows the stack depth.
- The width of the box indicates the frequency of function occurrences. The wider the boxes, function occurrences are more, as compared to narrow boxes.
- The search field helps you to search for a specific term, which can include regular expressions. The searched functions are highlighted. Also, the sum of matched stack traces is shown on the flame graph as a percentage of the total profile. This is useful not just for locating functions, but also for highlighting logical groups of functions.
- The orientation of the graph can be switched by selecting the Flame Graph or Icicle Graph icons. The Icicle Graph displays top-to-bottom orientation, whereas the Flame Graph displays bottom-to-top orientation.
You can aggregate the Flame graph and Stack trace by selecting the required attribute. In the Samples drop-down, select either Allocation Size or TLAB Size. The Flame View and/or Stack Trace view is presented according to the sample selected.