Note:
- This tutorial is available in an Oracle-provided free lab environment.
- It uses example values for Oracle Cloud Infrastructure credentials, tenancy, and compartments. When completing your lab, substitute these values with ones specific to your cloud environment.
Use APEX to create an app from a spreadsheet
Introduction
Oracle Application Express (APEX) is a low-code development platform that enables customers to easily build stunning, scalable, secure apps with world class features, that can be deployed anywhere. It’s also included free in all current versions of the Oracle Database, including Oracle Autonomous Data Warehouse and Oracle Autonomous Transaction Processing services.
This lab will show you how to create a robust APEX application with data imported from a common business spreadsheet. Many customers are wasting enormous amounts of time and energy keeping their business workflows and critical data in unmanageable spreadsheets. It’s a common fact, spreadsheets don’t scale. What if your customer could create a secure, scalable, multi-user application out of that spreadsheet that could save time and money? That’s what you’ll be learning in this lab!
Objectives
- Build a secure, scalable application using uploaded spreadsheet data
- Improve application by managing and changing the filters through APEX’s powerful faceted search
- Improve the Interactive Report and form pages to add better usability features
- Improve the Calendar page to reflect business objectives
- Link pages
- Build confidence in demonstrating the APEX application to customers!
Intended Audience
- Cloud sales and engineering
- Database cloud sales and engineering
Prerequisites
- Basic cloud familiarity
Create an Oracle Autonomous Database Instance
APEX is a feature of Oracle Database, including the Oracle Autonomous Data Warehouse and Oracle Autonomous Transaction Processing services. We’ll use an Oracle Autonomous Transaction Processing instance on Oracle Cloud Infrastructure (OCI) to host and an APEX workspace.
Overview Video
Fun fact! What is an APEX workspace?
An APEX workspace is a logical domain where you define APEX applications. Each workspace is associated with one or more database schemas (database users), which are used to store the database objects such as tables, views, packages, and more. These database objects are generally what APEX applications are built on top of.
-
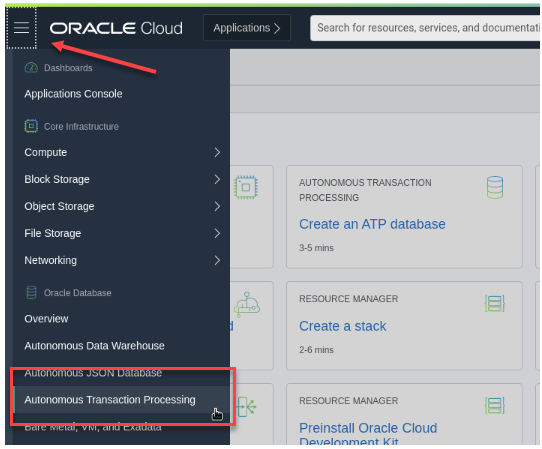
From within the OCI Console, open the resources menu, navigate to Oracle Database and select Autonomous Transaction Processing.
-
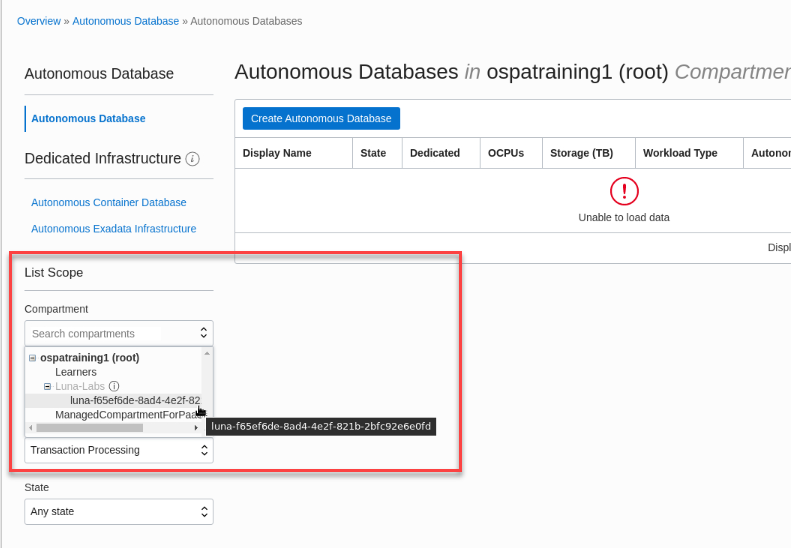
In the List Scope section, choose the Luna compartment that was assigned to your instance. Expand the minus signs until you find the ephemeral compartment and select it.
-
Click Create Autonomous Database.

-
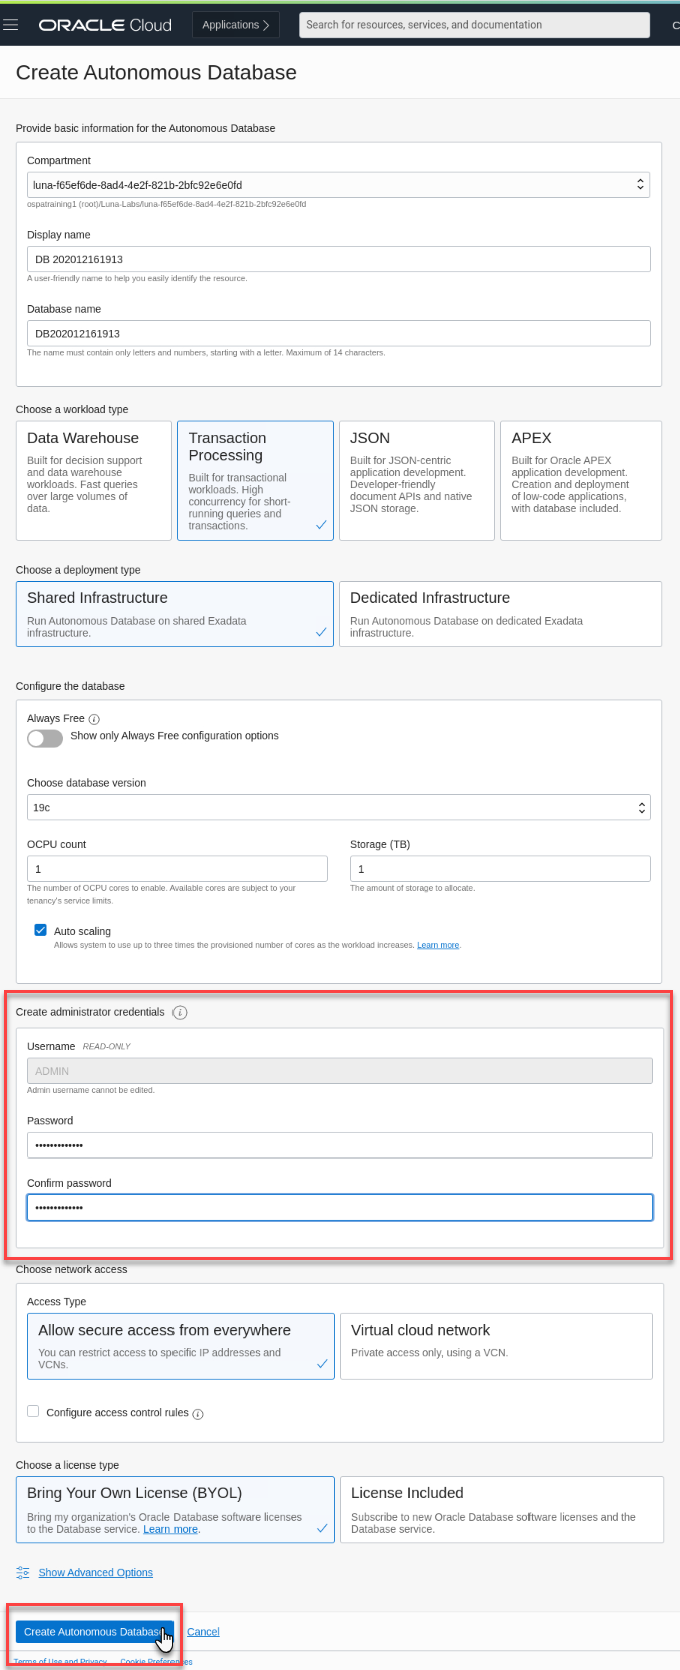
The only thing you need to add in the Autonomous Database configuration page is a password for the Admin user. Scroll down the form to the Create administrator credentials section and enter a 12-30 digit password. Make sure it’s one you can remember because you’ll be using it later. Look over the form and accept all of the defaults.
Field Recommended Information Compartment Verify that your Luna compartment has been selected Display name Accept the default Database name Accept the default Choose a workload type Transaction Processing Choose a deployment type Shared Infrastructure Database Version 19c OCPU Count 1 Storage (TB) 1 Username ADMIN (Can’t be edited) Password Create a 12-30 character password Choose network access Allow secure access from everywhere Choose a license type Bring Your Own License (BYOL) -
Click Create Autonomous Database.
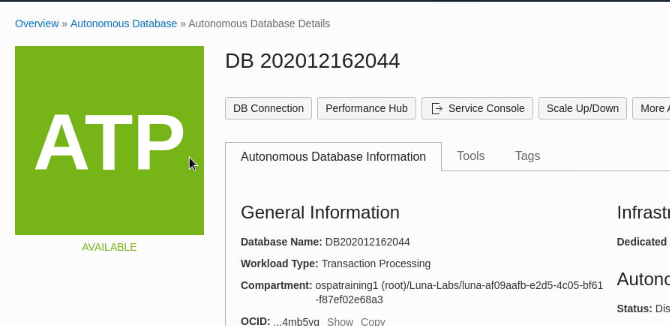
The database creation process will take a few moments. As it’s provisioning, the ATP icon will display orange.
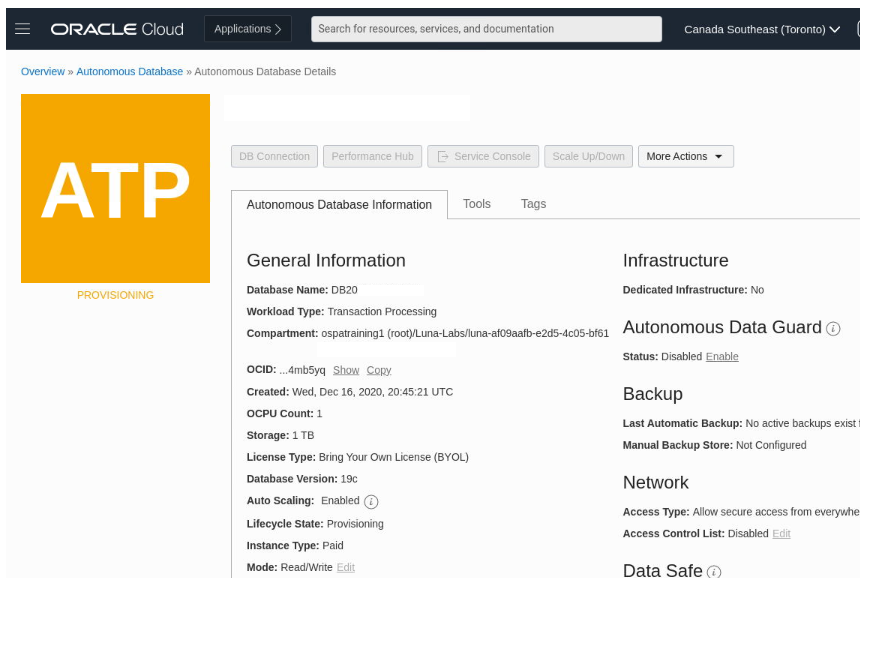
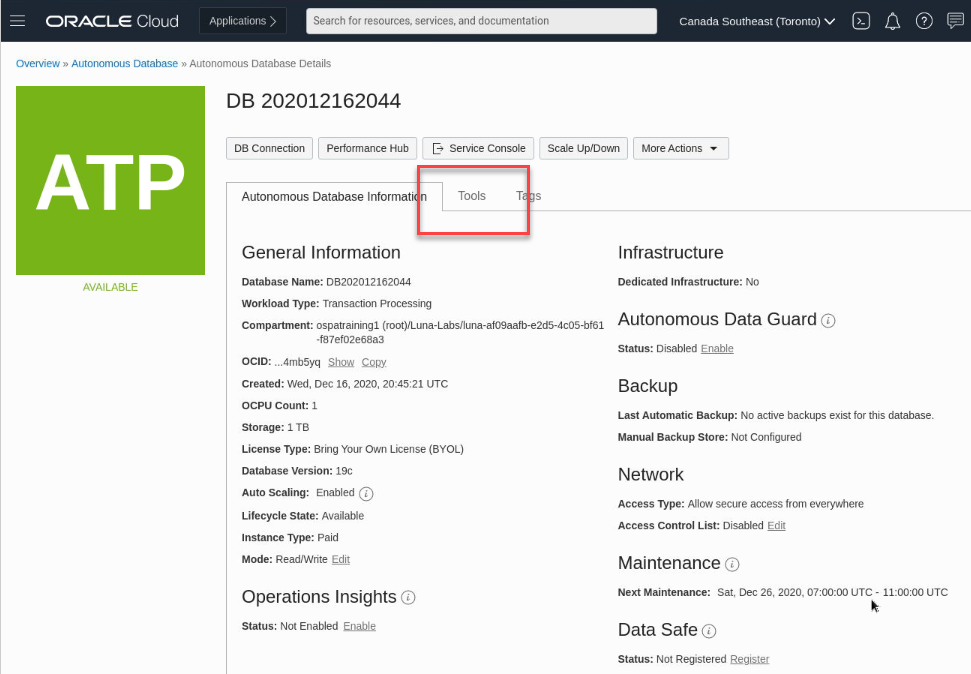
Once it’s completed, the ATP icon will display green and be available. Be sure to have a small celebration as you’ve taken just a few moments to launch and configure the most powerful database in the world!
Configure the APEX Workspace
Since you’ve just created a brand new Oracle Autonomous Database instance, you’ll need to configure APEX for first use. In the next steps, you’ll log in as the administrator to initialize a workspace and create a user called demo. Then you will log out and back in as the new user (demo) to begin creating your first amazing application.
Overview Video
-
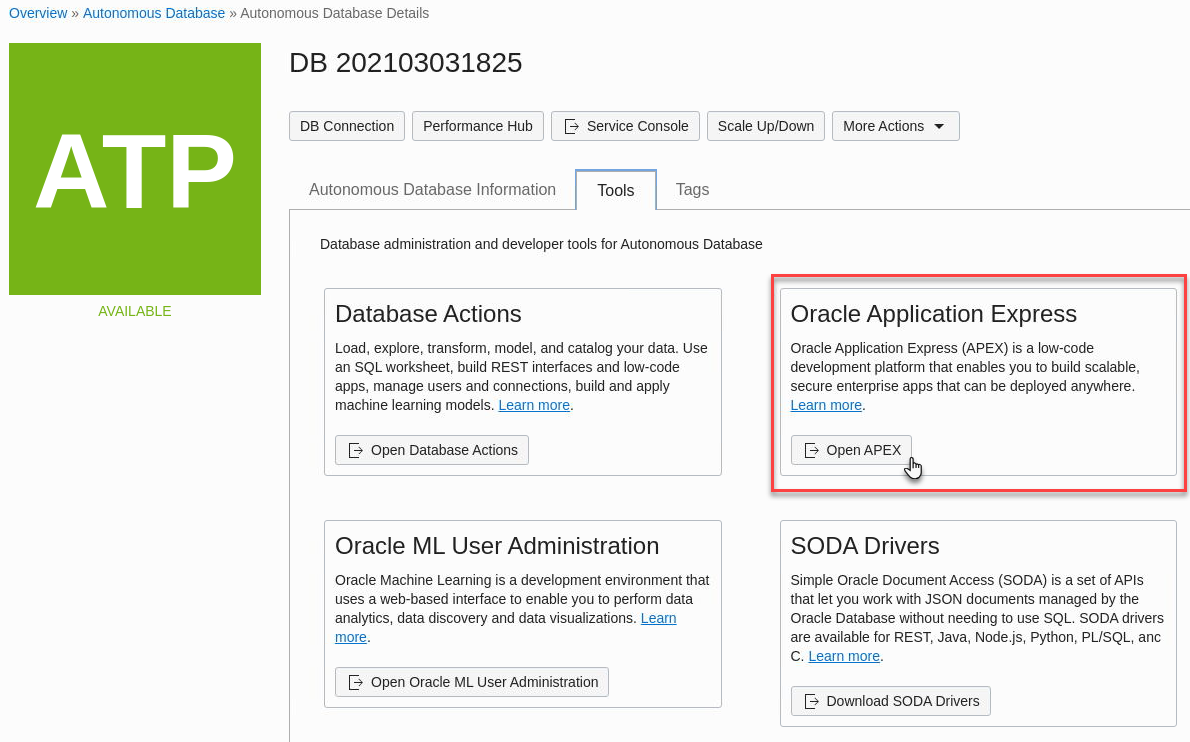
Click the Tools tab to access the database tools section where you’ll find a link to the APEX application.
-
Click Open APEX to begin.
-
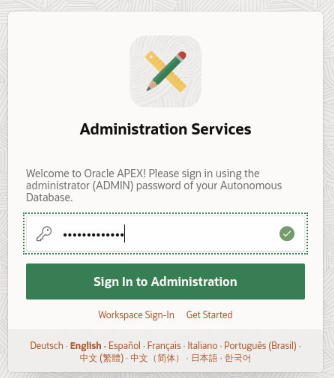
Enter the Admin password you used to create the Oracle Autonomous Database in the first step and click Sign in to Administration.
-
Click Create Workspace.
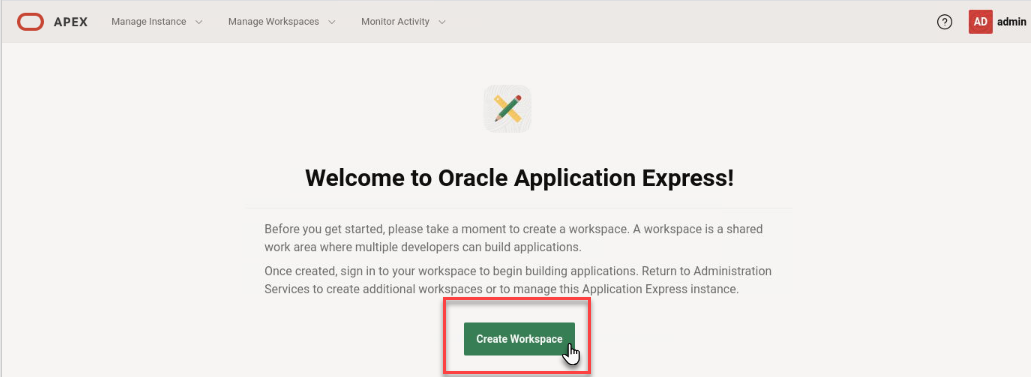
-
In the Create Workspace dialog box, you’ll be creating a new user along with a new workspace to house the application. Enter the following information and click Create Workspace:
Property Value Database User DEMO Password use the same password you used earlier or another of your choice Workspace Name DEMO 
You’ve successfully created a new workspace called DEMO with a new user called DEMO.
Now you’ll need to logout of the Admin workspace and login to the DEMO workspace. The simplest way to do this is to click DEMO on the Workspace created message that’s likely at the top of your screen.

-
This will log you out of the administration workspace and allow you to log in to the new DEMO workspace. Fill in the password and click Sign In.

Create an App from a Spreadsheet
In this section, you will learn how to create an APEX application using data imported from a spreadsheet. To simplify the demonstration, you will use sample data that’s built into APEX. However, the steps would be the same if you were uploading your own or a customers data.
Now that you are logged into your workspace, you can start creating APEX applications. You will build a simple application based on a spreadsheet. Keep in mind that APEX is great for a variety of apps, from simple ones like this to large, sophisticated apps based on local database objects, REST enabled SQL objects, and even REST APIs.
While APEX developers spend the majority of their time in the App Builder, you should also investigate the SQL Workshop, where you can create and maintain database objects, Team Development, where you can track large APEX development projects, and the App Gallery, which contains numerous productivity and sample apps that can be installed within minutes.
Overview Video
Load Project and Tasks Data
-
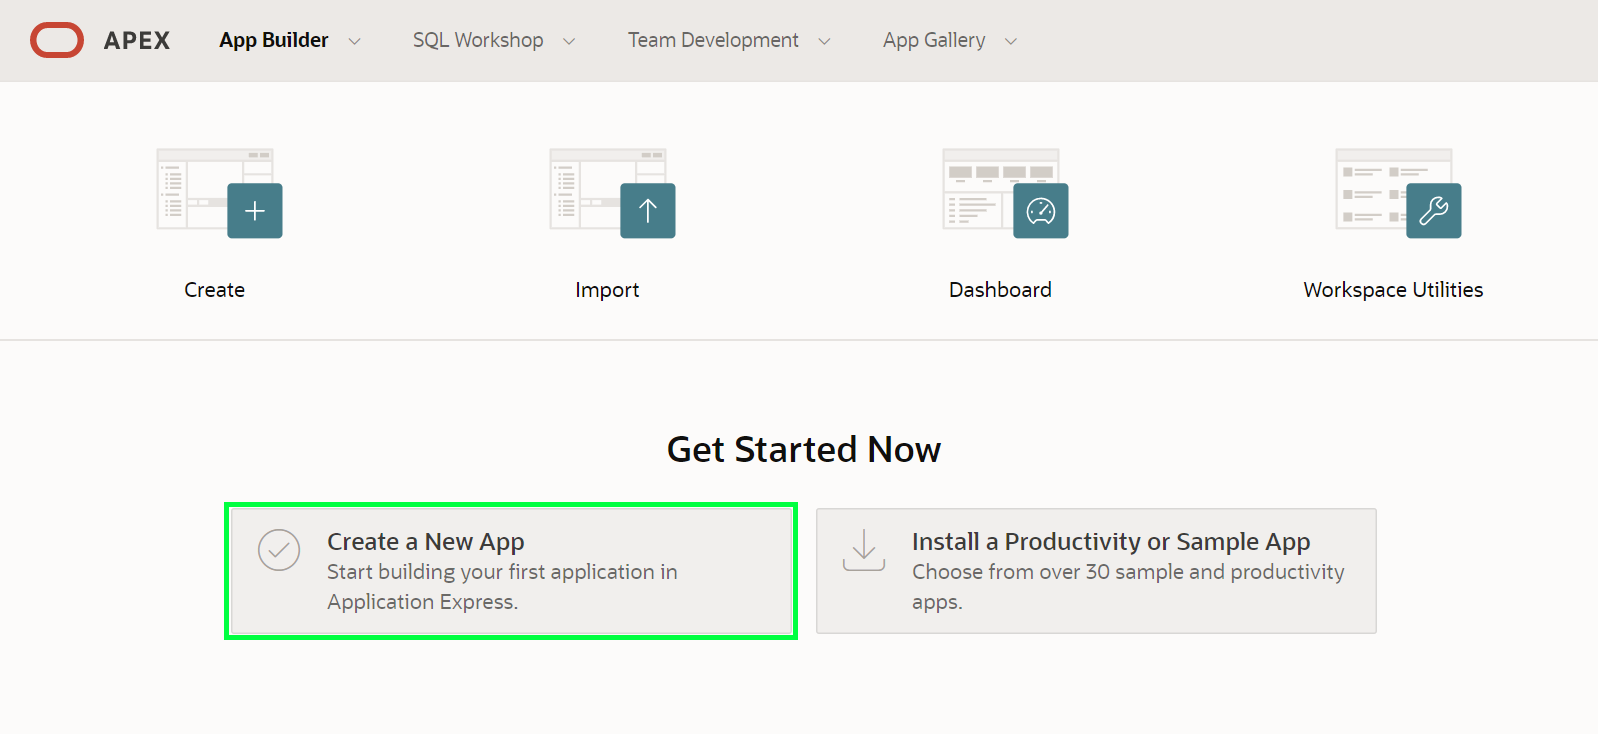
From your APEX workspace home page, click App Builder.

-
Click Create a New App.
-
Click From a File.
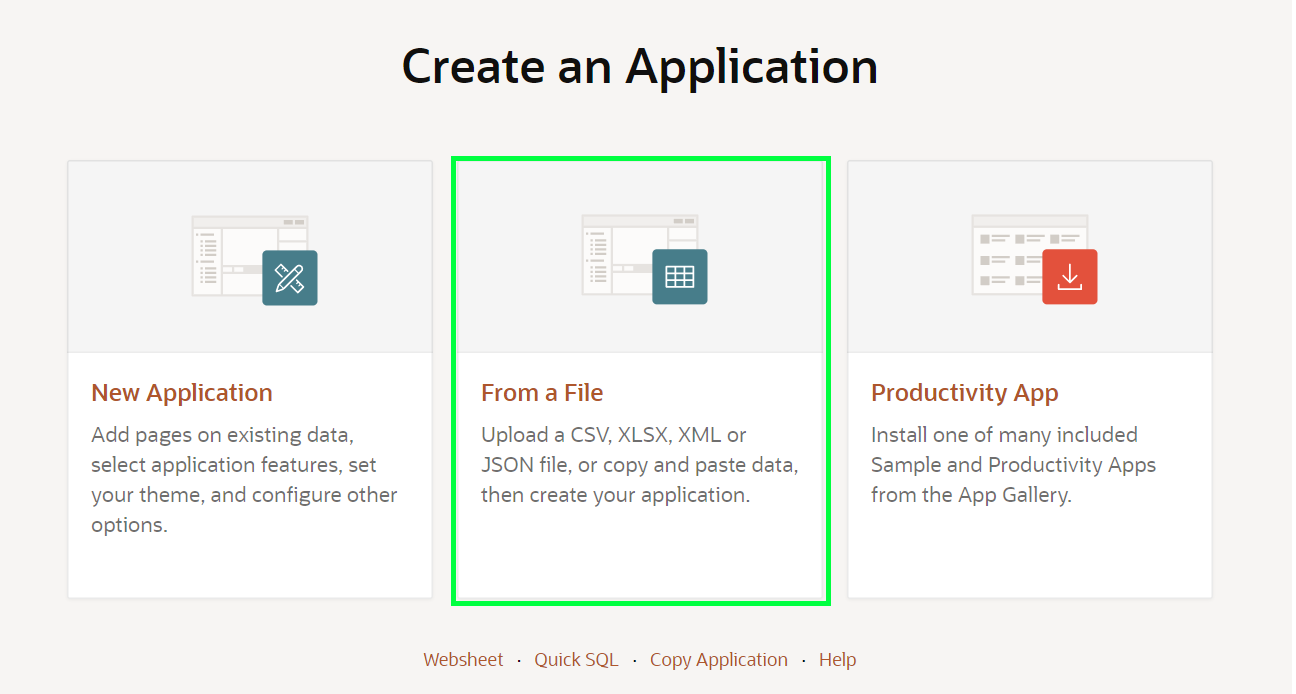
When creating an application from a file, APEX allows you to upload CSV, XLSX, XML, or JSON files and then build apps based on data contained in those files. You can also copy and paste CSV data or load sample data. For this demonstration, you’ll be loading sample data that comes with the application.
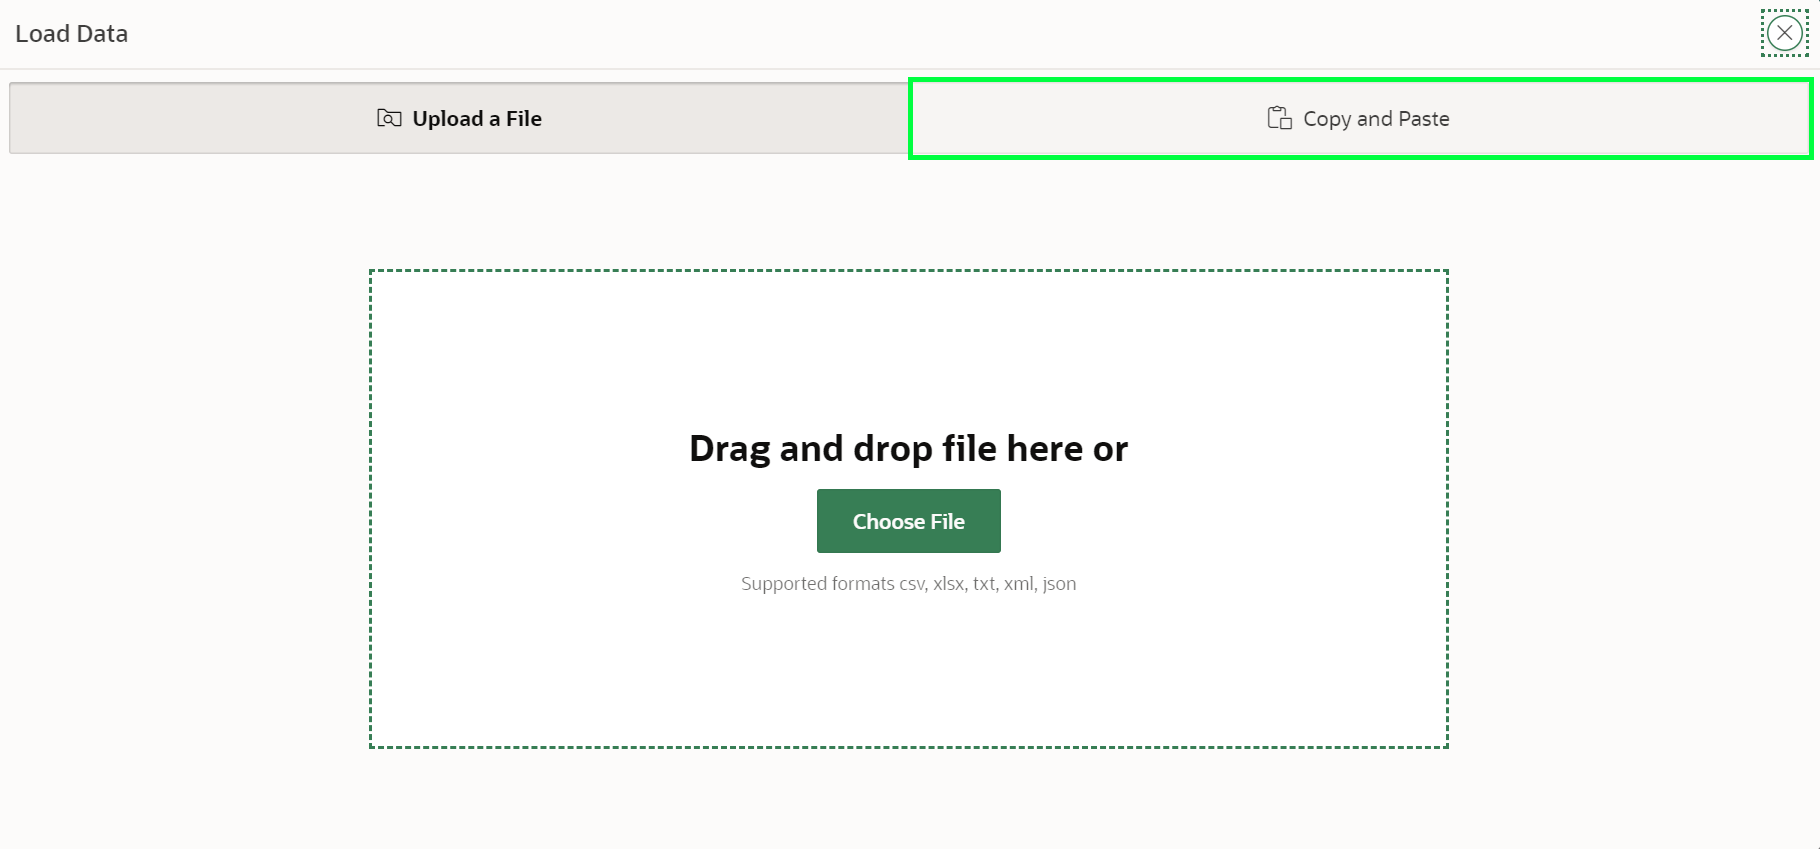
-
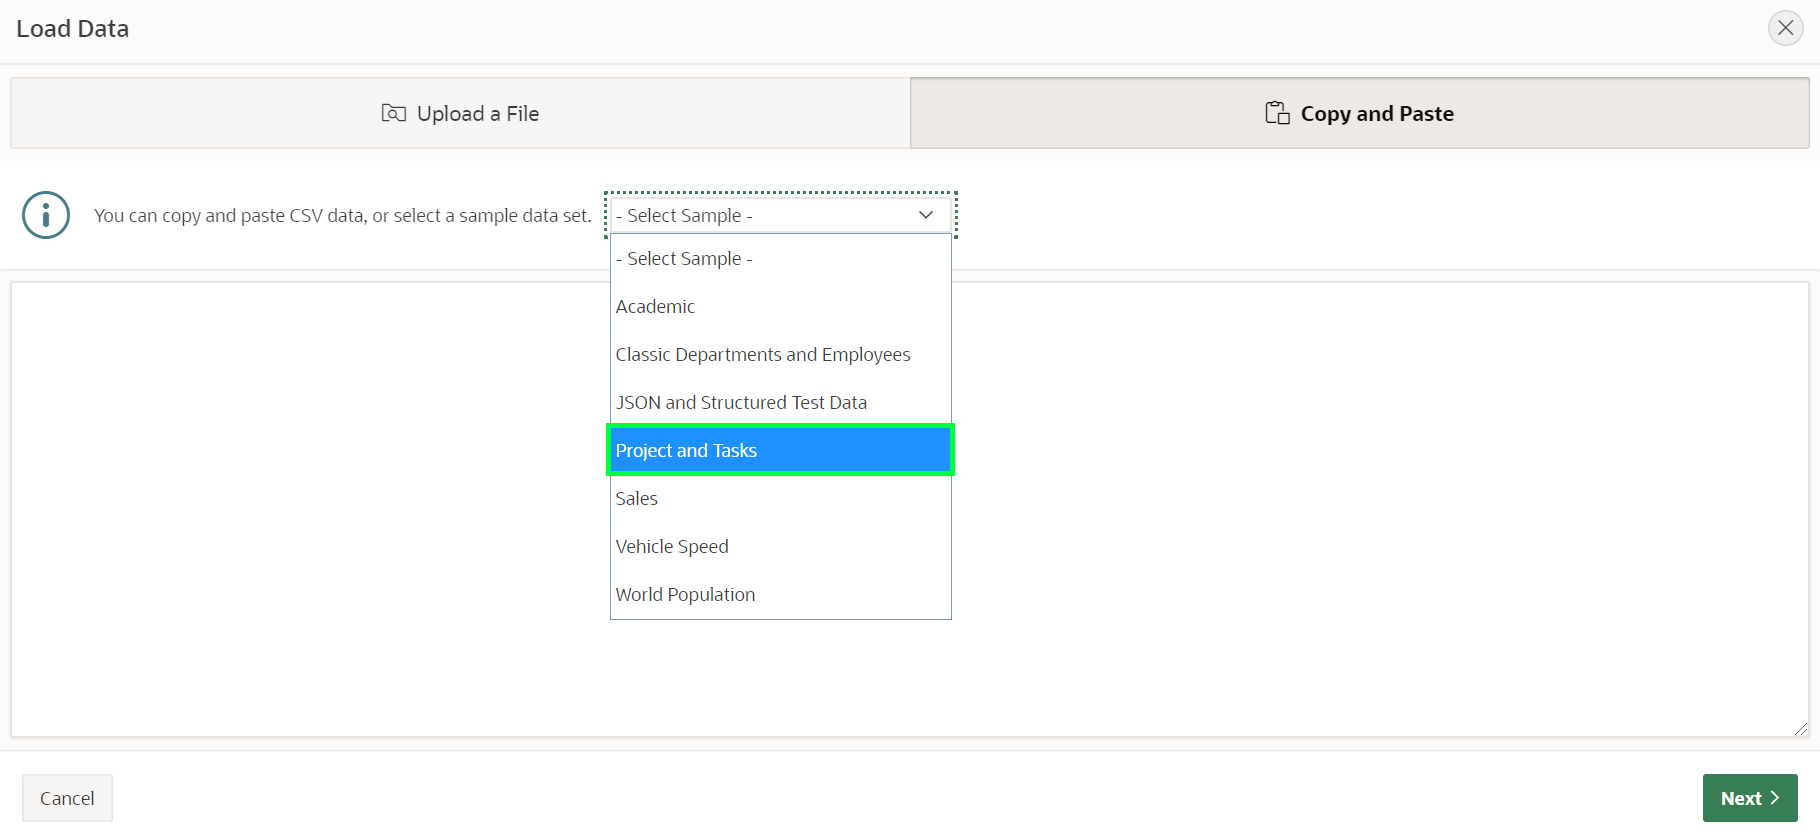
Within the Load Data wizard, click the Copy and Paste option at the top.
-
Select Project and Tasks from the sample data set list and then click Next.
-
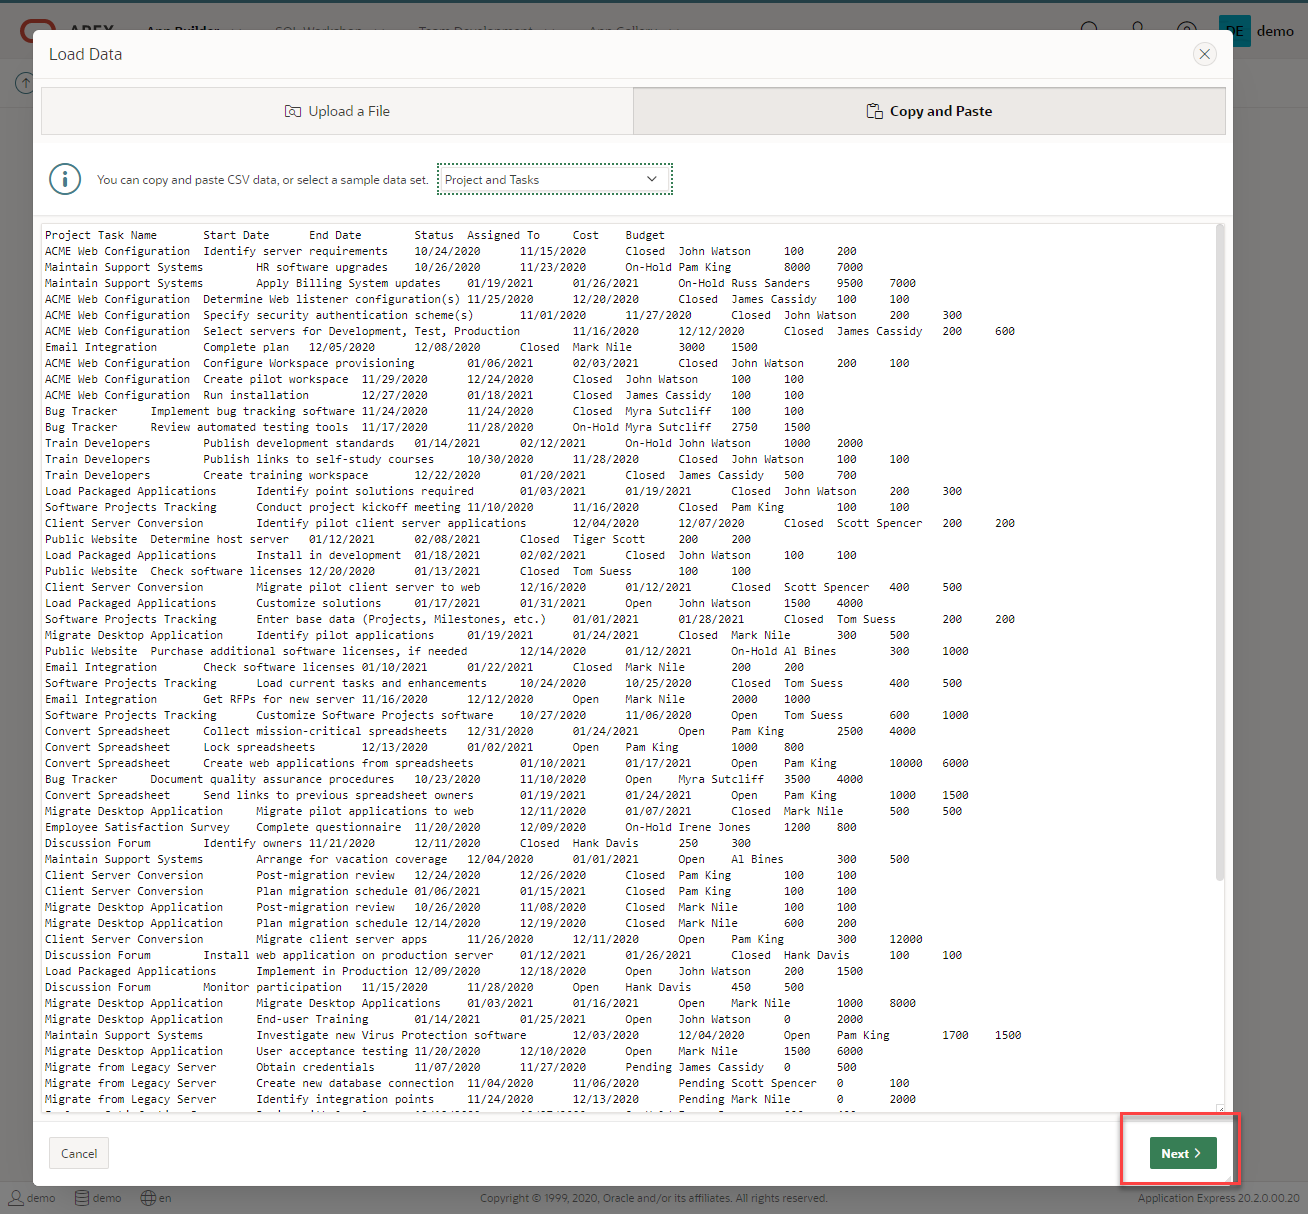
Review the parsed data for the demo application and click Next.
-
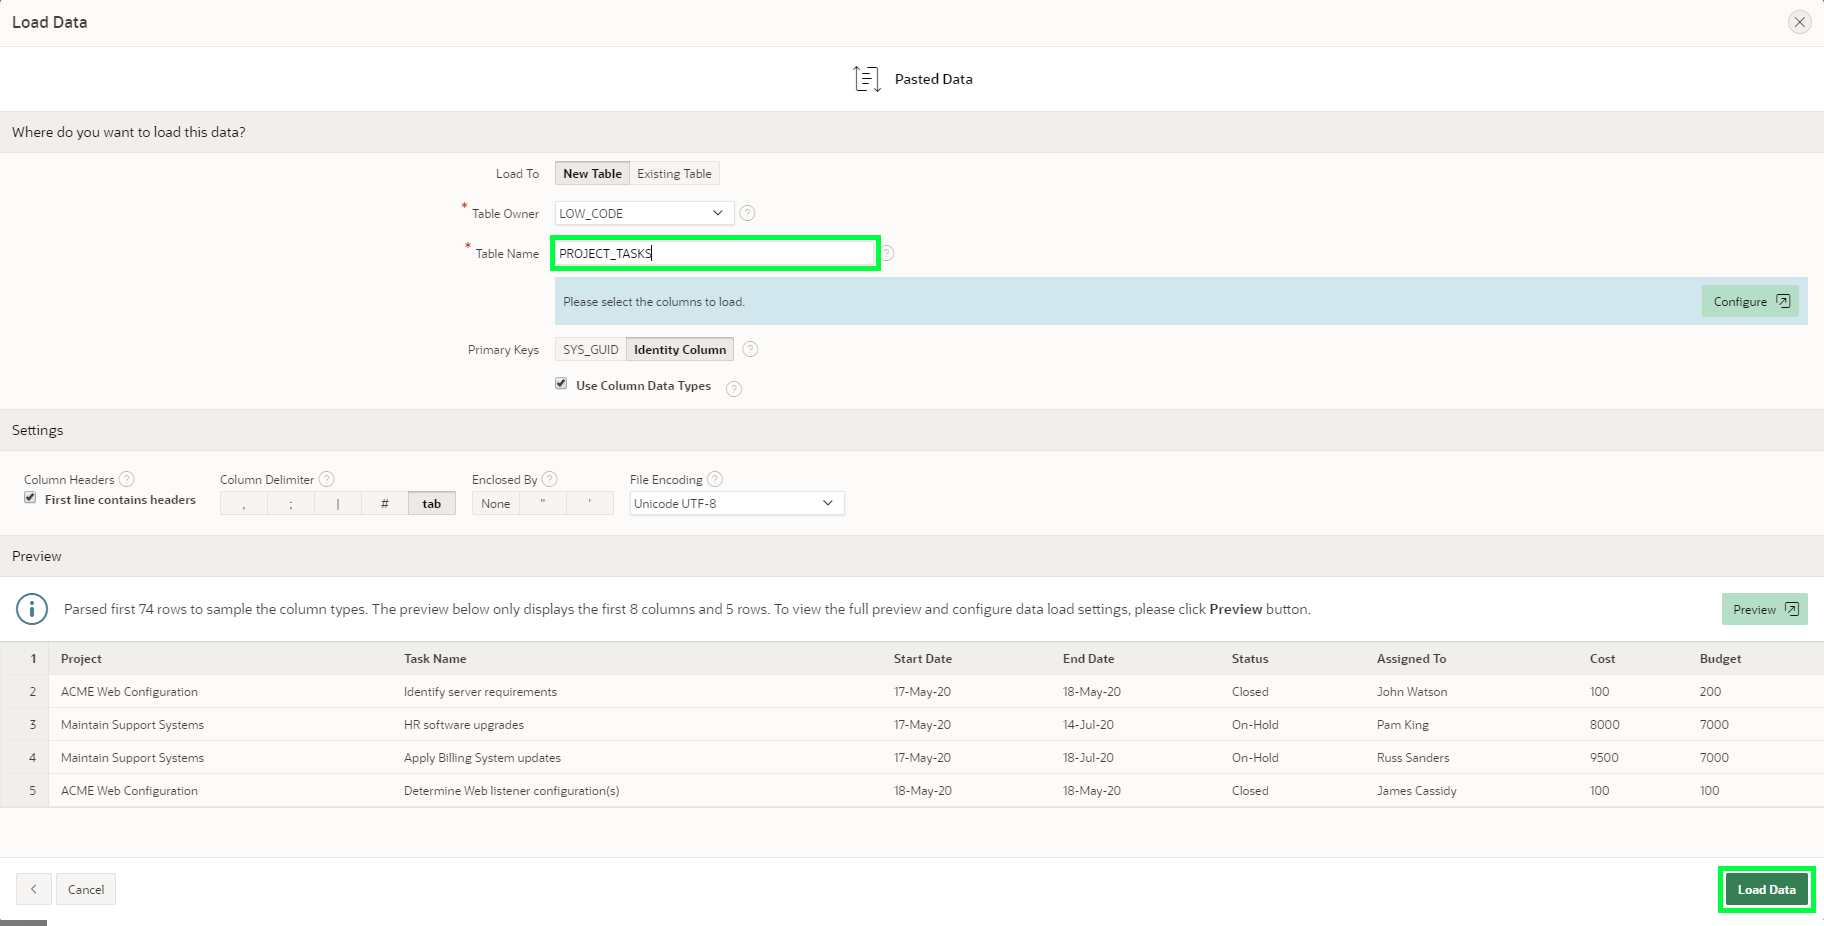
Select New Table to load data to. Verify Table Owner is set to Demo. Set Table Name to PROJECT_TASKS and click Load Data.
After clicking Load Data, you will see a spinner until the wizard finishes loading the data.
Note: The Data Load wizard has created a new table and populated that table with the records from the sample data. You will now create the application based on data from the new table.
-
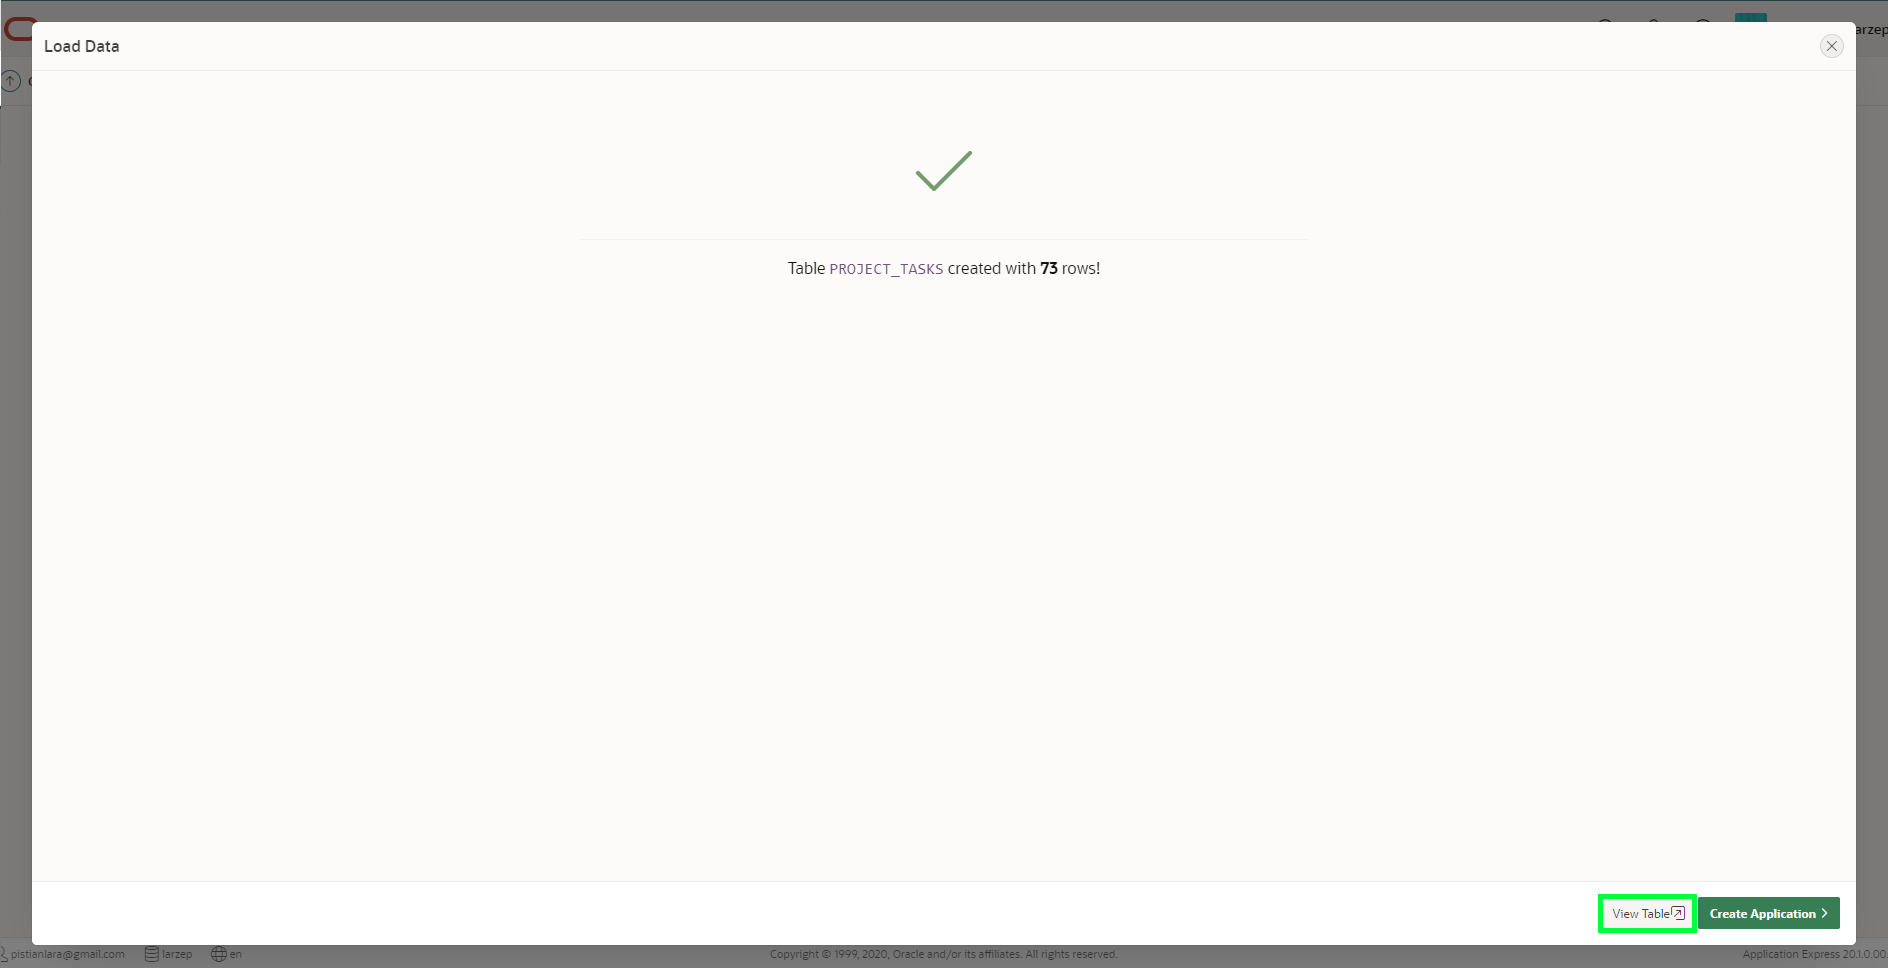
In the Load Data dialog box, verify that 73 rows have been loaded into the PROJECT_TASKS table, then click View Table.
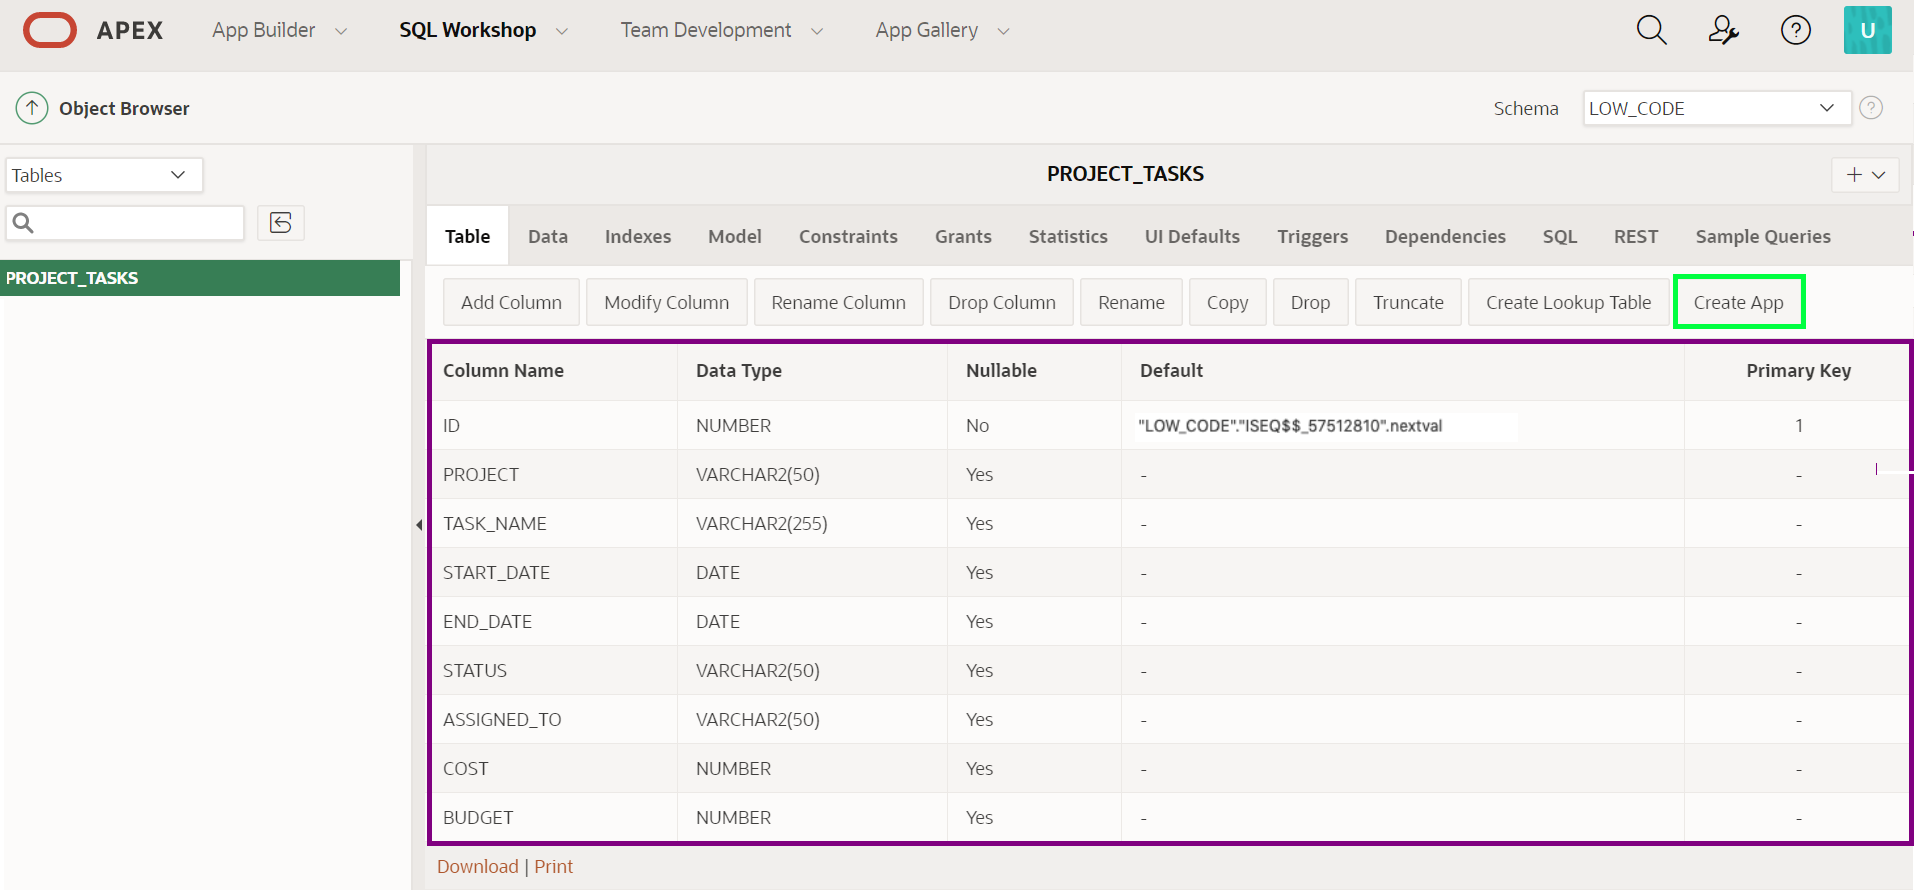
-
You are now in the Object Browser, review the table structure and other information that will be created. In the Table toolbar, click the Create App button.
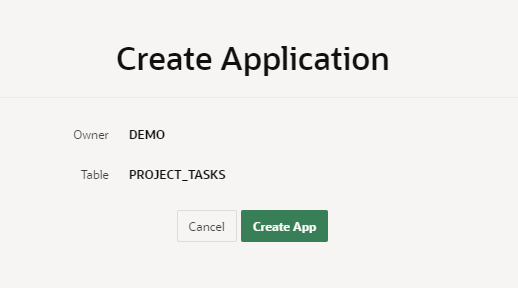
-
On the Create Application page, click Create App.
In the Create Application page, review the listed pages, these will form the basis of your new application. You can click the Edit button of each page to add customizations up front if you already know what you want. Click to review each one if you have time.
-
Under Features, click the Check All link to include all available features in your application. Click Create Application.

-
Wait a few moments for the application to be created. When the wizard finishes, you will be redirected to the application’s home page in the App Builder.
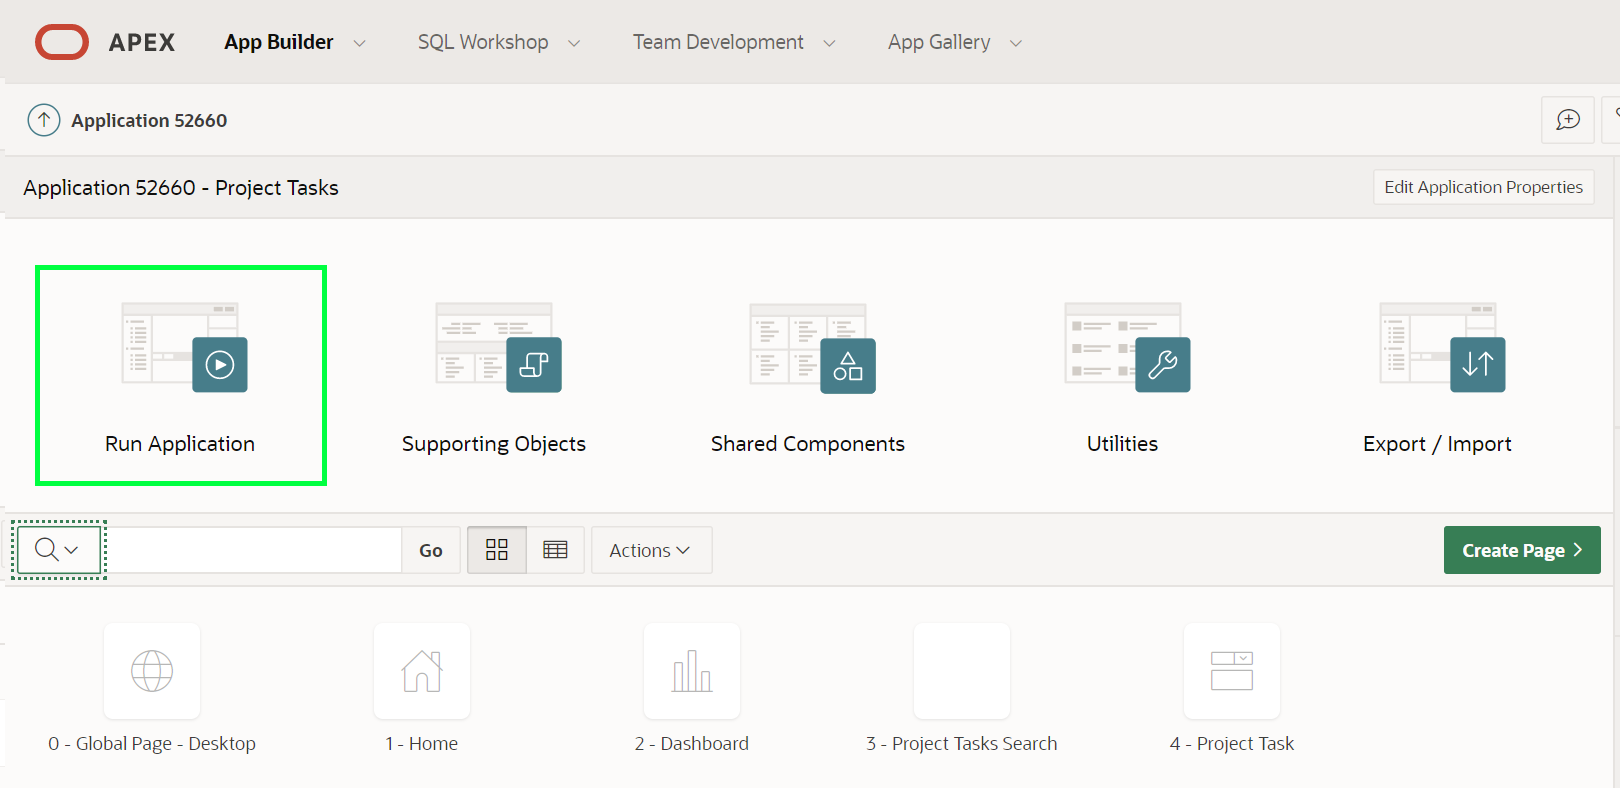
-
Click Run Application. This will open the runtime application in a new browser tab, allowing you to see how end users will view the app.
-
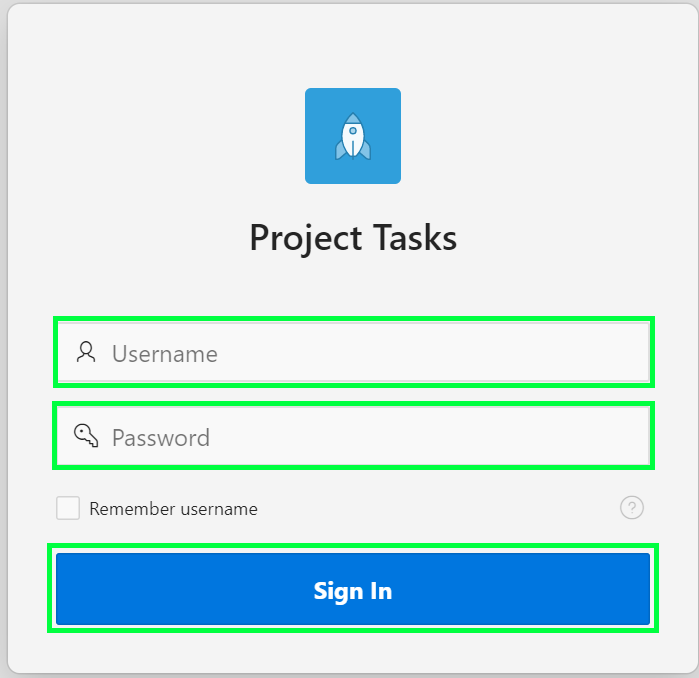
Enter your user credentials and click Sign In.
Note: Use the same Username and Password you used to sign into the APEX Workspace. (DEMO)
-
Explore the application and familiarize yourself with the overall look and feel.
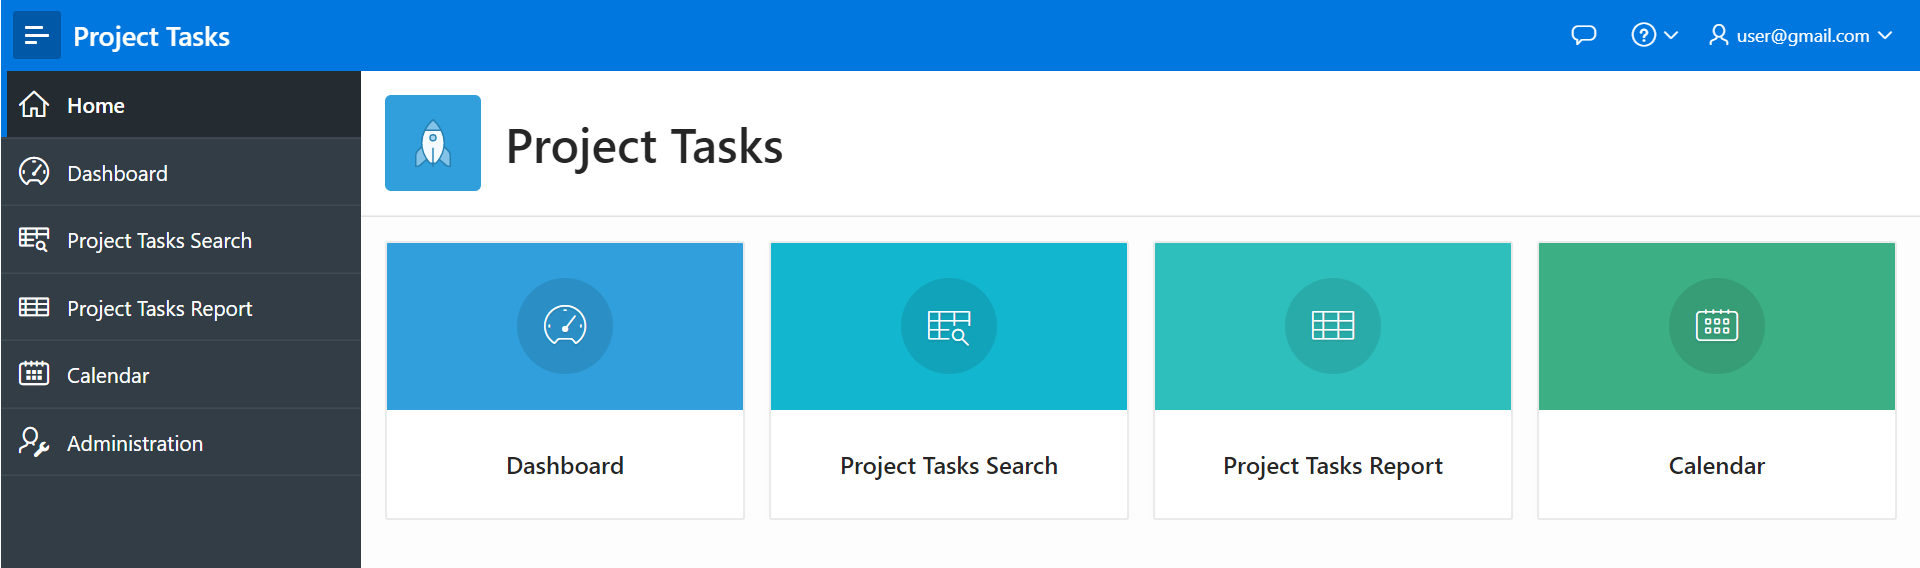
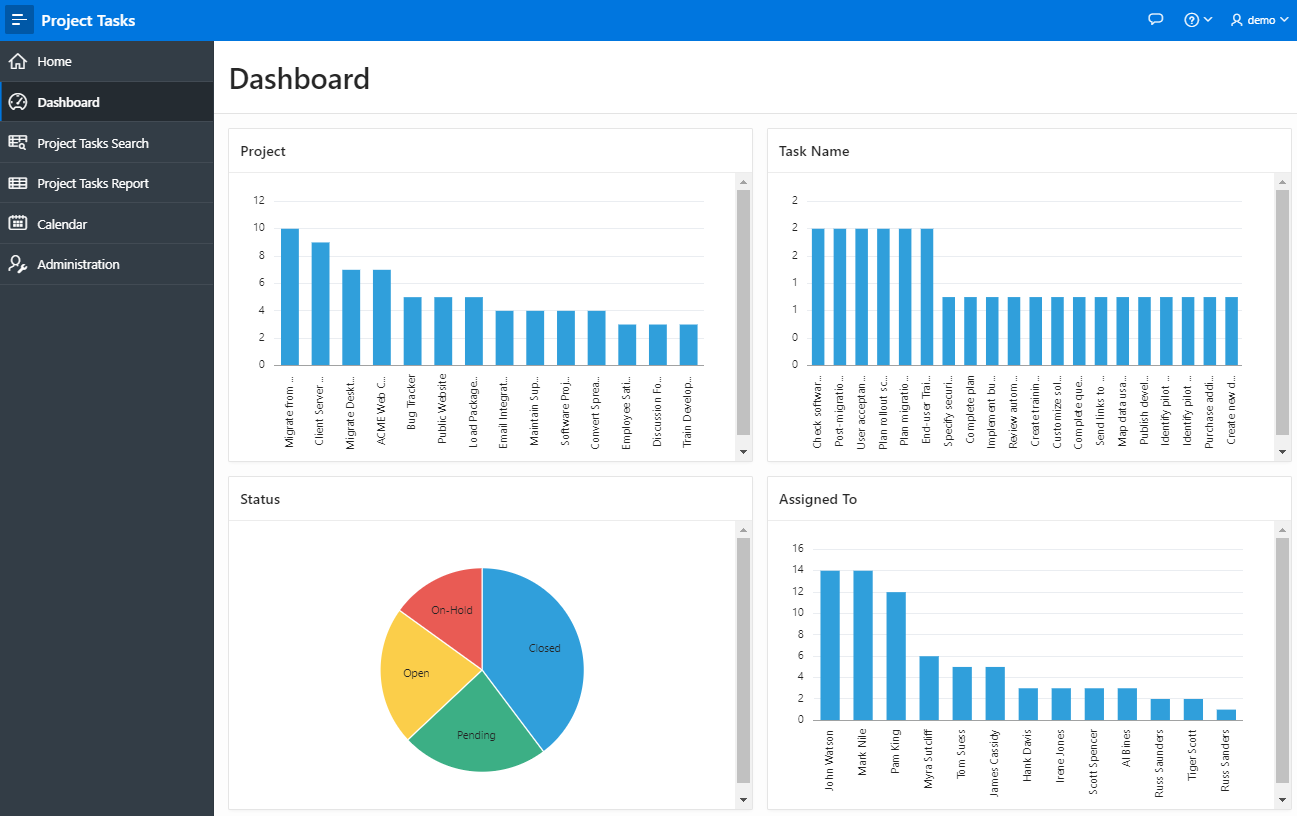
-
Click Dashboard (in the home menu or the navigation menu) to view the default charts that were automatically created.
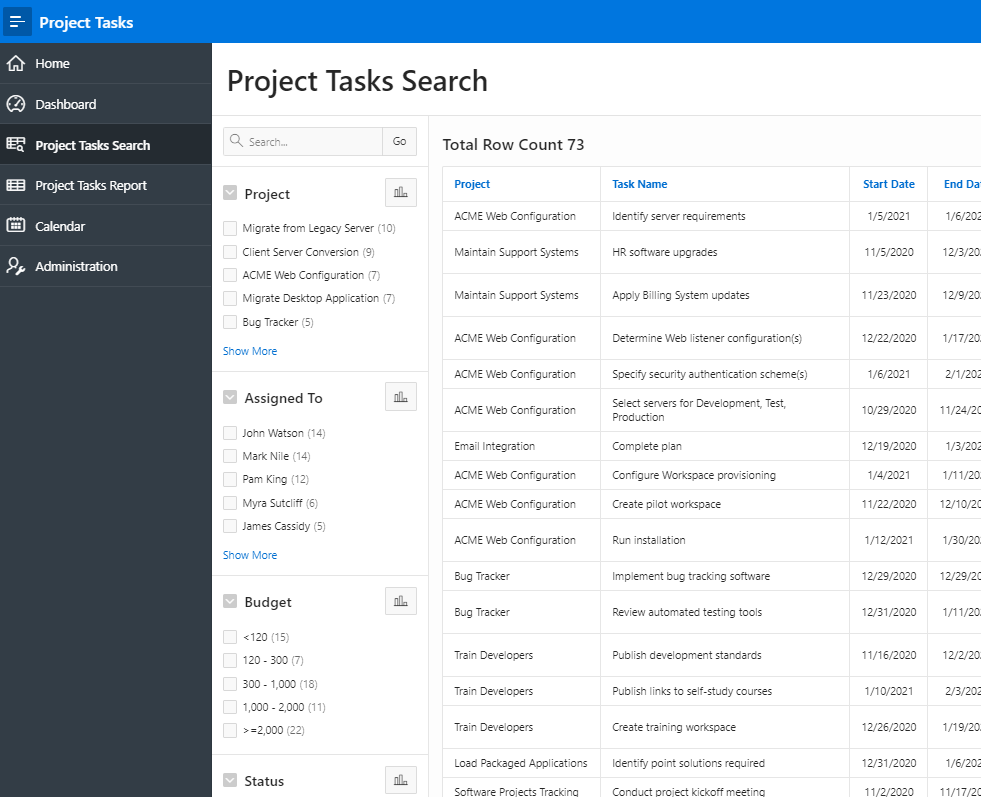
-
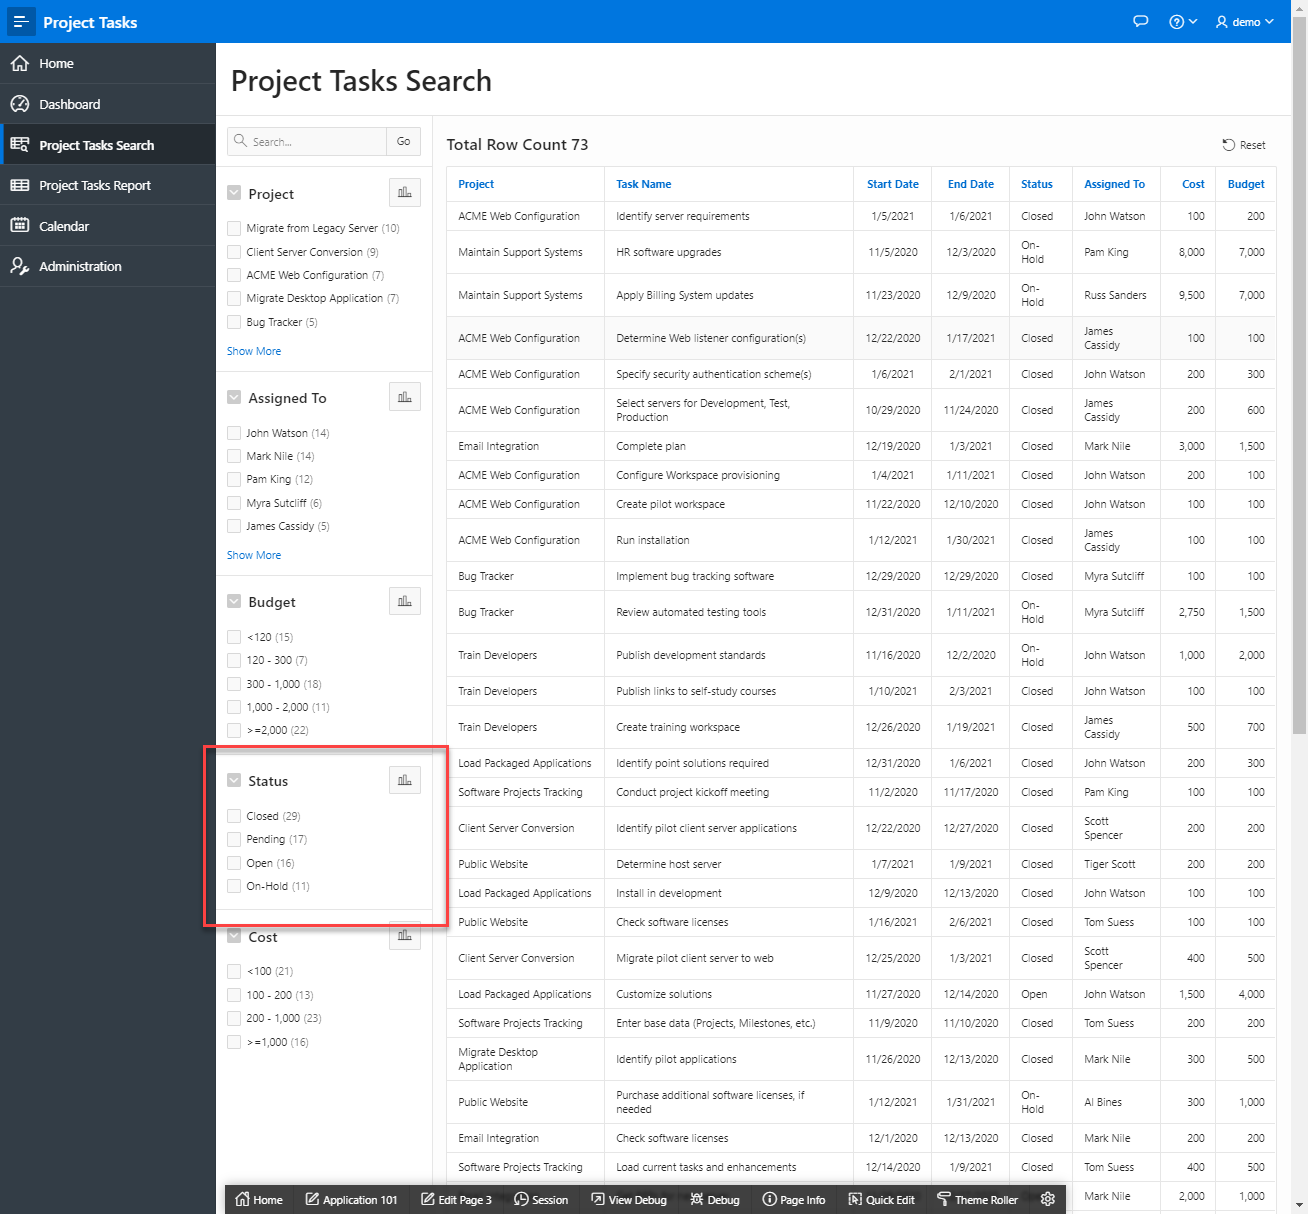
Click Project Tasks Search, in the navigation menu and experiment with the faceted search. Make a mental note about how the searches work, this is where you’ll be showing the customer where they can make improvements to the application and make the data more useful.
-
Click Project Tasks Report to view an interactive report, then click the edit icon for a record to display the details in an editable “form” page.

-
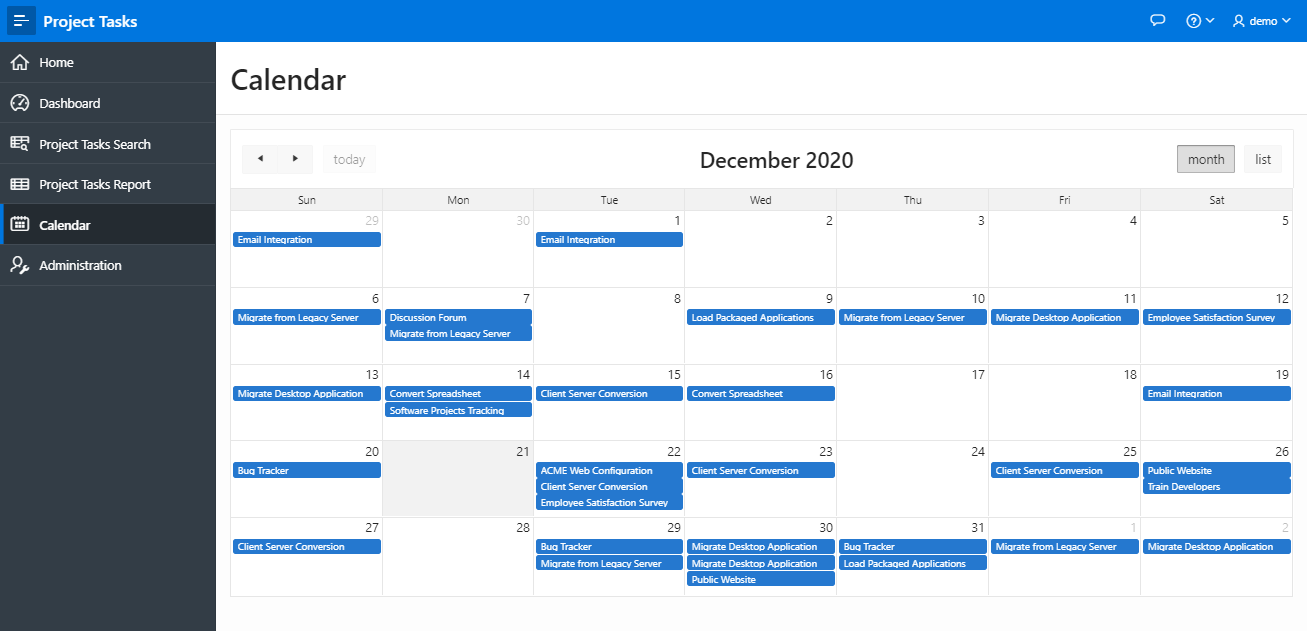
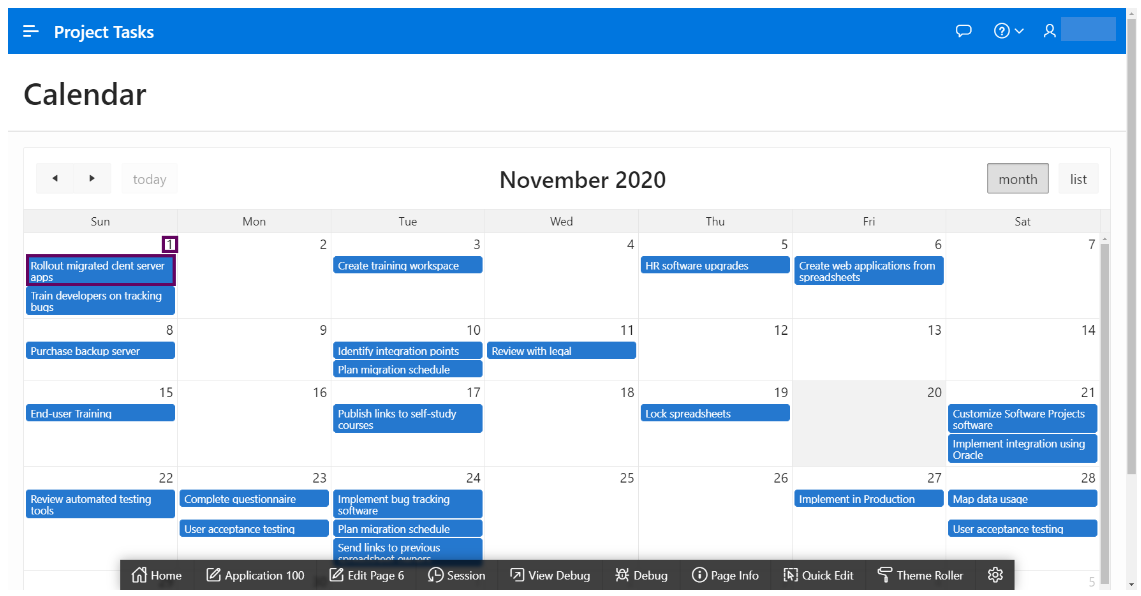
Next, navigate to the Calendar page and review the data displayed. Notice that default behavior allows information to be displayed when rolling the mouse over an event and clicking an event doesn’t do anything different.
Note: You may need to scroll back several months to see data.
-
Finally, review the options available under Administration.
Note: As a bonus, in the Administration screen, see if you can figure out how to change the Theme from the default Vita to the Redwood Light theme.

Improve the Faceted Search
In this section, you will get first-hand experience with customizing the application for specific use cases. You’ll start by changing the faceted search page to help clarify the data and make it more usable for the specific situation. Faceted search allows users to narrow down search results using filters based on item classification. The search page includes facets on the left which can easily be used to limit the data shown in the report on the right.
Overview Video
When reviewing the Project Tasks Search page in the application, you can check and uncheck various facets to create different views of the data. In the default view, when you check a facet, the counts on all of the remaining facets will be updated to show the number of records that meet the new criteria. We’ll customize some of the facets in the following steps.
In looking at the facets, you’ll notice that the Status section is down the page and you can use check boxes to choose multiple values, one or many.
-
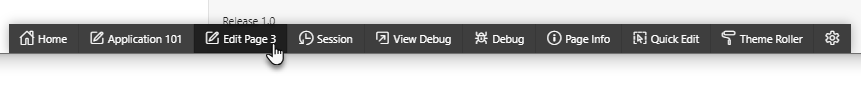
From the runtime application, go to the search page by clicking Project Tasks Search. Given you ran this app from the APEX App Builder, a Developer toolbar is displayed at the bottom of the screen.
Note: End users who log directly into the app will not see this toolbar.
-
In the Developer toolbar, click Edit Page 3.

-
Alternatively, you can also navigate back to the APEX App Builder tab in your browser manually by selecting the appropriate browser tab or window. Once in the App Builder click 3 - Project Tasks Search.

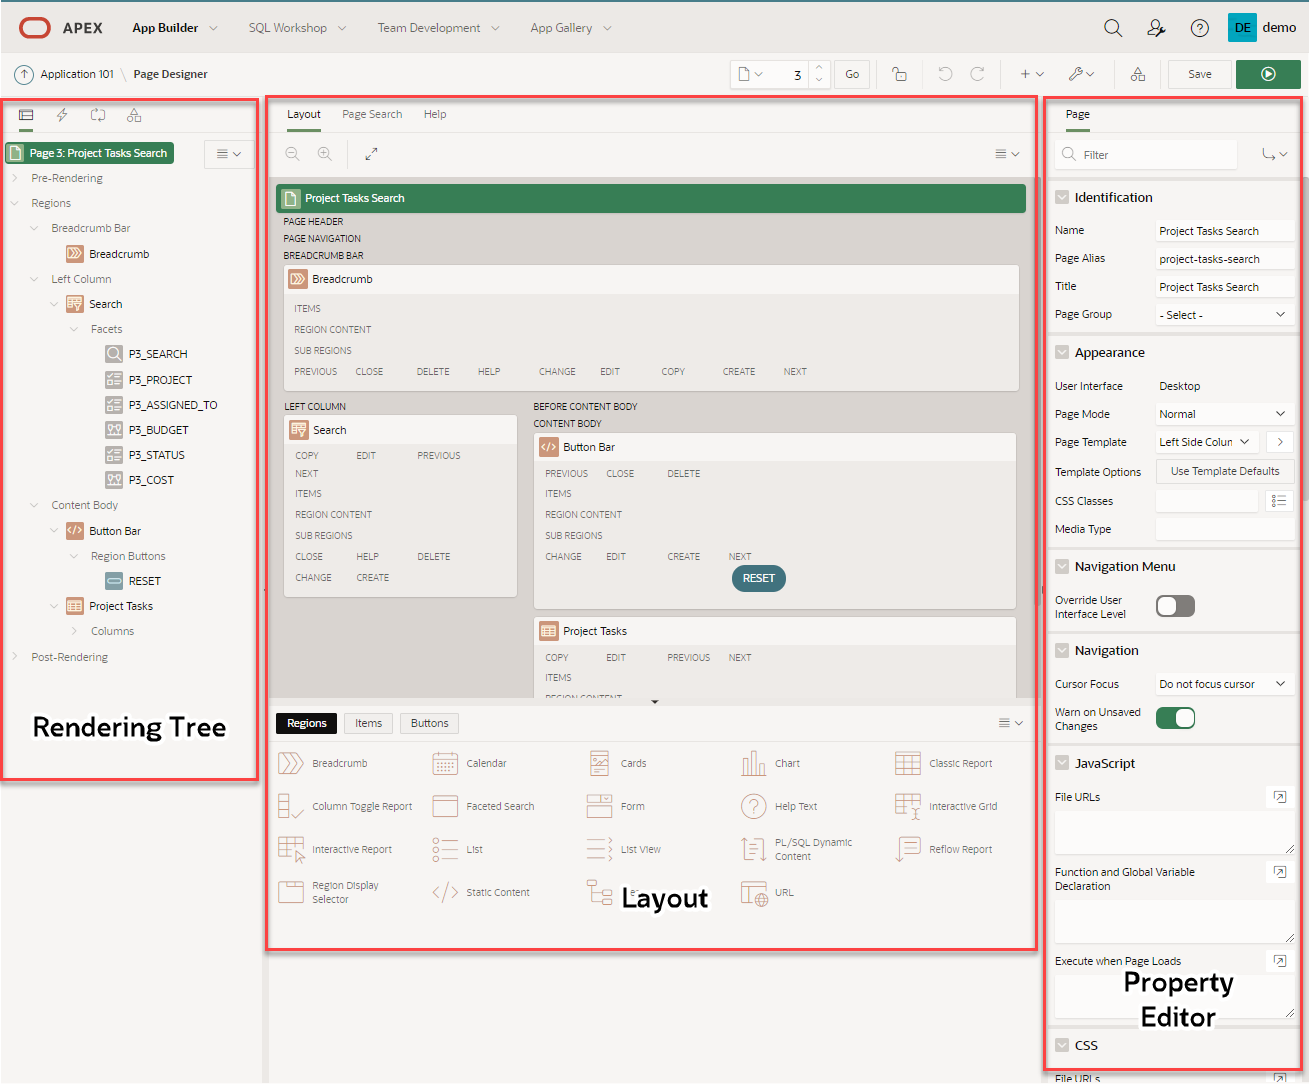
You should now be in Page Designer. Page Designer is where you will spend the majority of your time improving your application. There are three panes within Page Designer. The left pane initially displays the Rendering Tree, with a list of page components. The middle pane displays the Layout, a representation of the page, and Gallery, from which you can drag and drop new components into the Layout. The right pane is the Property Editor, where you can change attributes for the selected component.
Status is a very common search criteria, so in order to make the application more useful, you will want to reorder the facets so that Status is between Project and Assigned To, bringing it up in visibility for better ease of use.
-
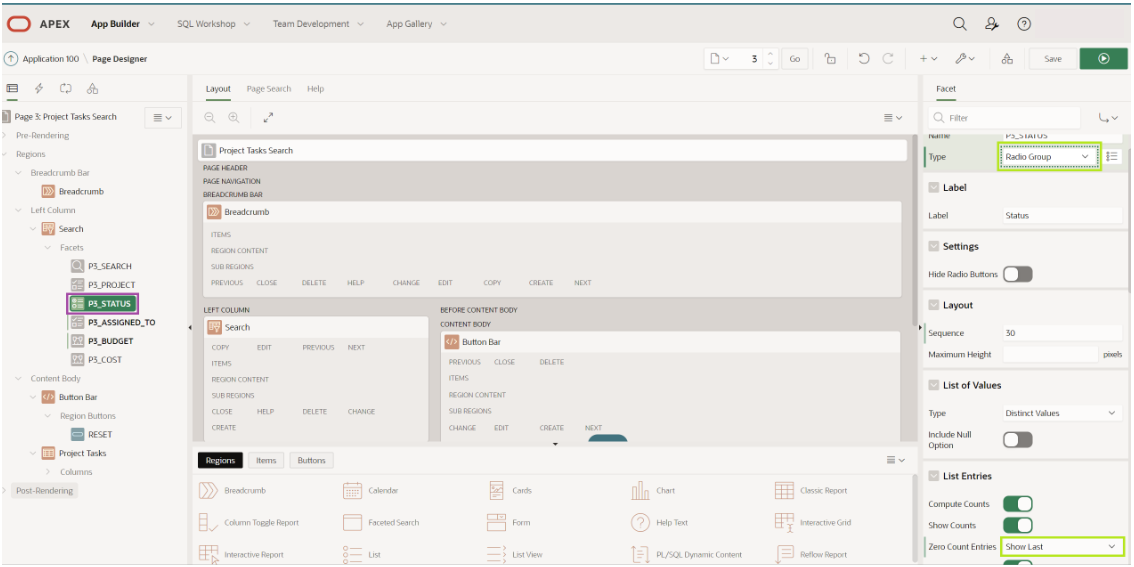
In the Rendering Tree (left pane), under Search, within Facets, click and hold P3_STATUS and drag it up until it is under P3_PROJECT then release the mouse.

Currently the Status facet is a series of check boxes. However, it is unlikely that users will want to select more than one at a time, so you will convert it to a radio group.
-
Continuing with P3_STATUS selected, within the Property Editor (right pane), locate Identification and then Type. Change the type from Checkbox Group to Radio Group.
-
Scroll further down the properties panel and find List Entries and then Zero Count Entries and change this field from Hide to Show Last.
-
At the top right of the page click Save and Run Page to save the changes made to the facets and review the app.

-
In the runtime environment, click one of the statuses. Review how the counts on the other facets are updated based on your selection. Also notice how you can still select one of the other statuses to quickly sort the data or click Clear to reset the options.

You may have noticed that the facets go off the bottom of the page. It would be preferable to collapse the last three facets to make easier to see all of the available choices. Let’s take care of that in the next few steps.
-
Navigate back to the development environment (APEX App Builder) by using the edit link in the Developer toolbar, or manually navigating to the appropriate browser tab.
-
In the Rendering Tree (left pane), under Search, within Facets, click P3_ASSIGNED_TO, hold down the Shift key and then click P3_COST, such that three facets are selected. In the Property Editor (right pane), within the filter at the top, enter collap, so that only two attributes are displayed. In Advanced and then Initially Collapsed, change the switch to selected.
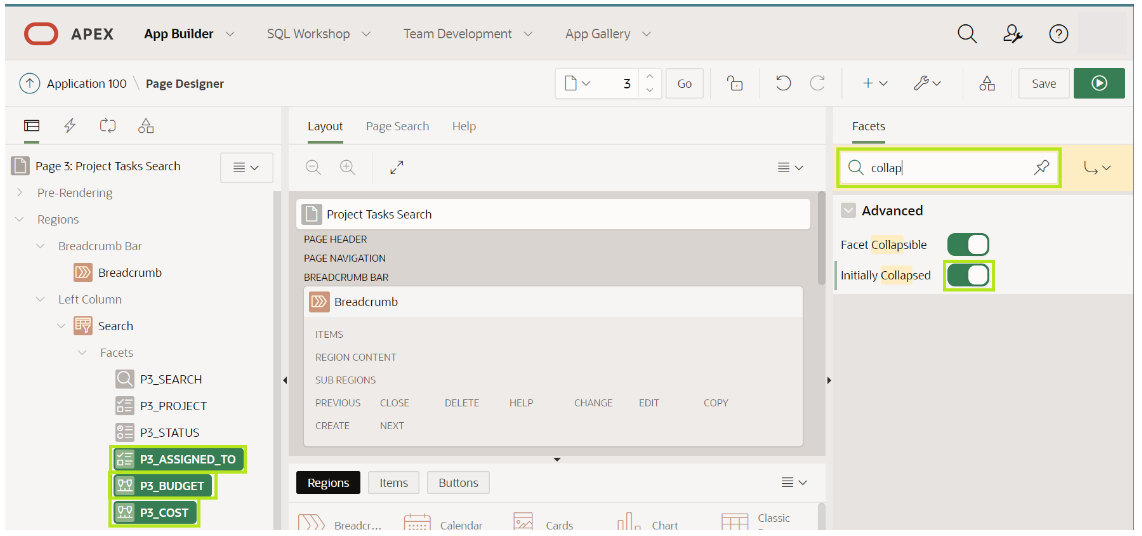
Note: Rather than entering a filter you can also scroll down the properties until you find the correct attribute to update.
-
Click Save and Run Page to see the improved search page.
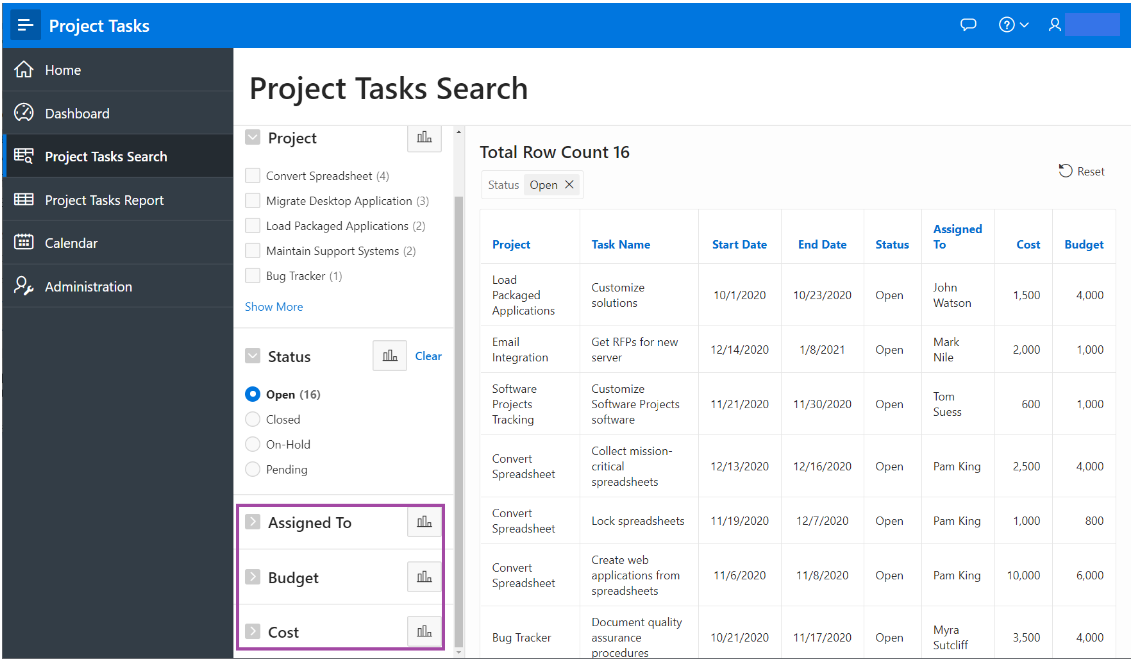
Great job! Now you’ve taken the customers basic spreadsheet application and added some functionality that helps improve its usability. In the next section you’ll add some enhancements to the report section.
Improve the Report and Form
In this section, you will gain insight into the abilities of Interactive Reports, and learn how to enhance a form page from an end users point of view. The Project Tasks Report page utilizes an Interactive Report to display the records. Interactive Reports are exceedingly powerful, as they allow end users to modify what data is displayed and change the display characteristics. For this report, you will add a column break, a computational column, an aggregate, and a chart. Then you will order the data and save the report for everyone to see.
Overview Video
Note: All of the steps below, except for saving Alternative Reports, can be performed by end users. There are many additional capabilities available to end users which are not covered below.
-
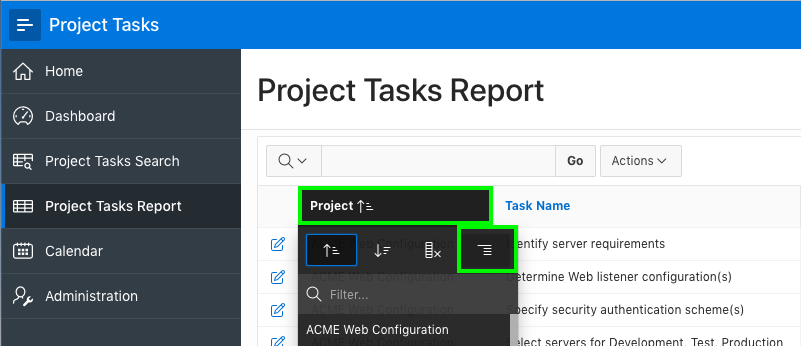
In the runtime environment, click Project Tasks Report.
-
Click the Project column heading, and then select Control Break which is the icon on the right under the project heading.
Here you’re going to add a computational column that compares the budget versus the cost of the project. APEX allows end users to define new columns based on existing columns in a report and the ability to add computations. Columns are selected within the computation using a letter associated with each column.
-
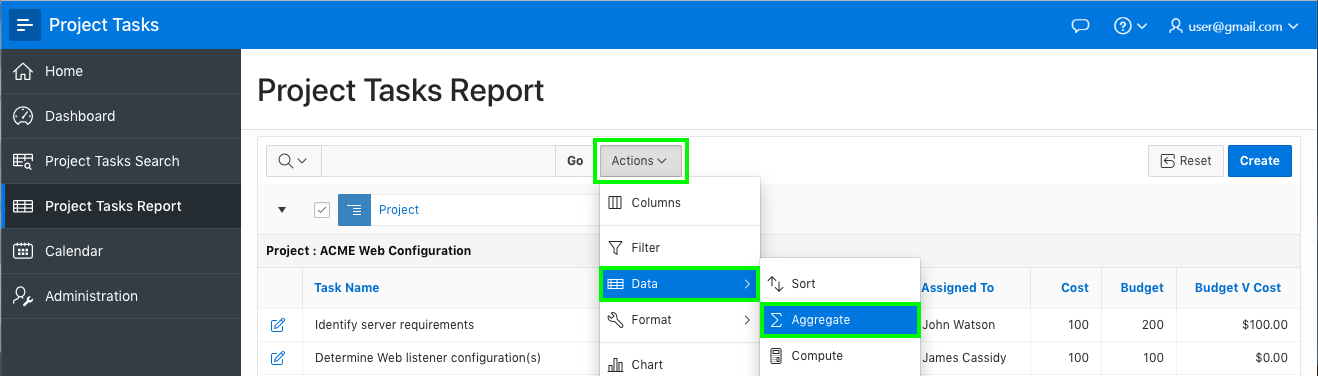
At the top of the report, click Actions, select Data, and then select Compute.

-
In the newly opened Compute dialog box, enter the name of the new column as Budget V Cost. Next, use the drop-down list on Format Mask to choose the mask of $5240.10, it will display as FML999G999G999G999G990D00. Than us the columns selector to choose the columns you want starting with I. Enter a space and a dash then select column H so your expression looks like the one in the example image. Click Apply.
Property Value Column Label Budget V Cost Format Mask $5234.10 Computation Expression I - H 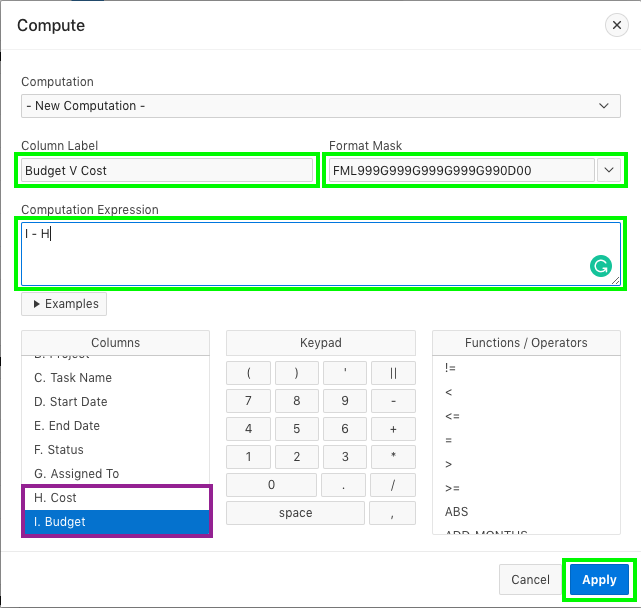
This adds a new column Budget V Cost to your interactive report.
-
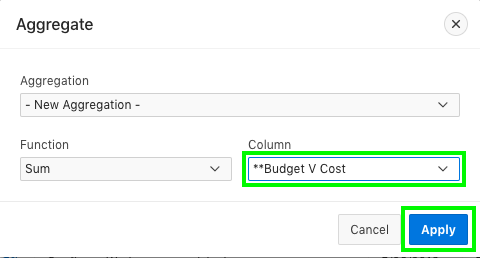
To add up the Budget versus Cost for each project, click Actions, select Data, and then select Aggregate.
-
In the Aggregate dialog box, select the Sum function and choose your new column from the drop-down list, Budget V Cost, then click Apply.
Even though you can see the total budget versus cost for each project, it would be much easier to view the totals on a chart to get an overall picture of all of the projects.
-
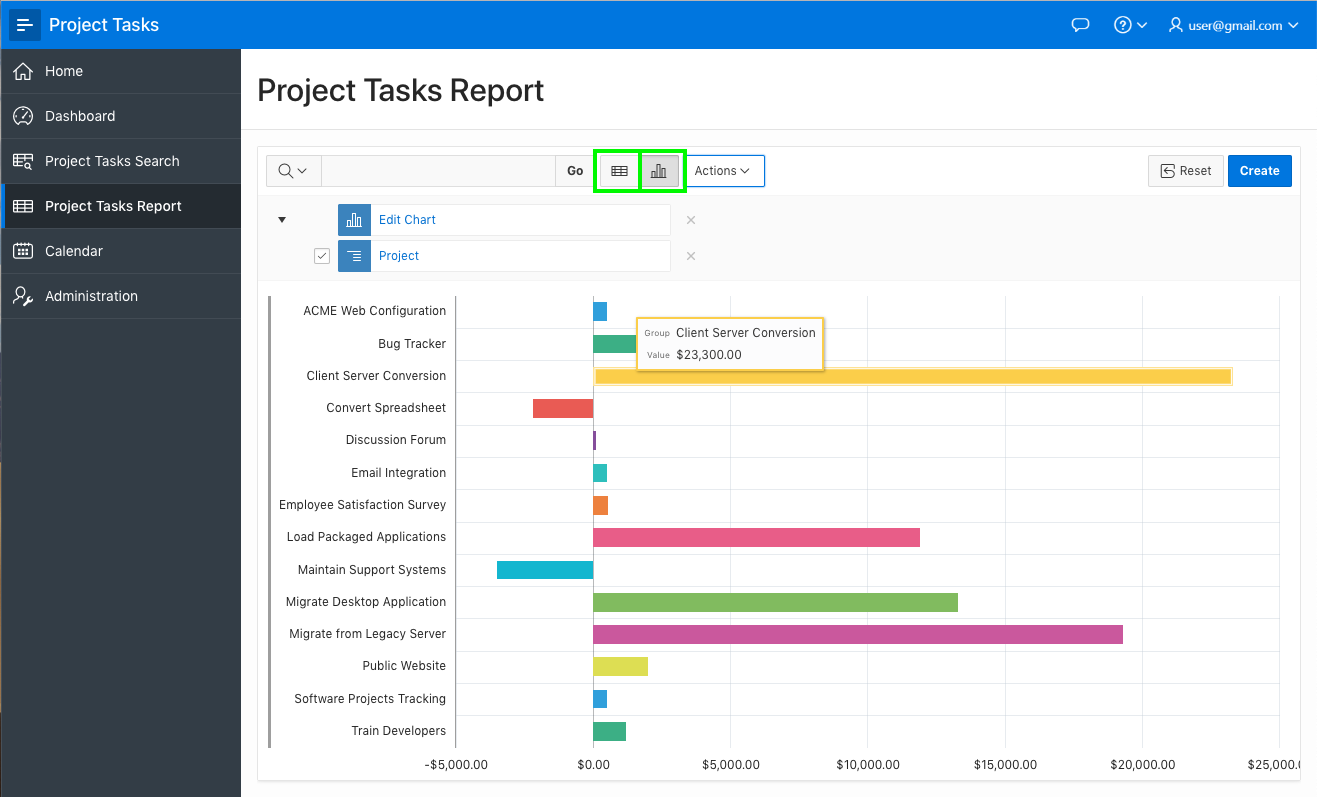
In the report click Actions, select Chart. Use the drop-down list to enter the following information using the Bar Chart selection and click Apply.
Property Value Label Project Value **Budget V Cost Function Sum Sort Label-Ascending Orientation Horizontal 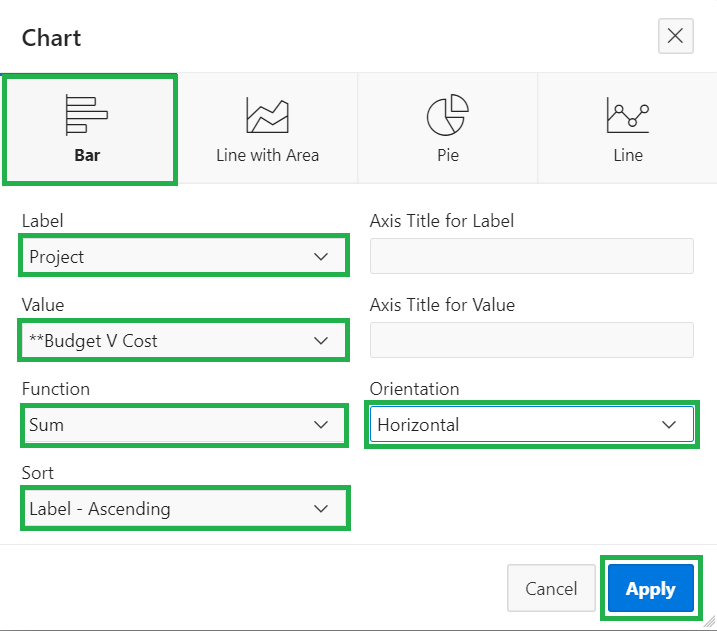
-
After you click Apply, the chart will be displayed. Hover over parts of the interactive chart to view the data. Toggle between the report view and chart view using the icons at the top of the report to the left of the Actions button.
-
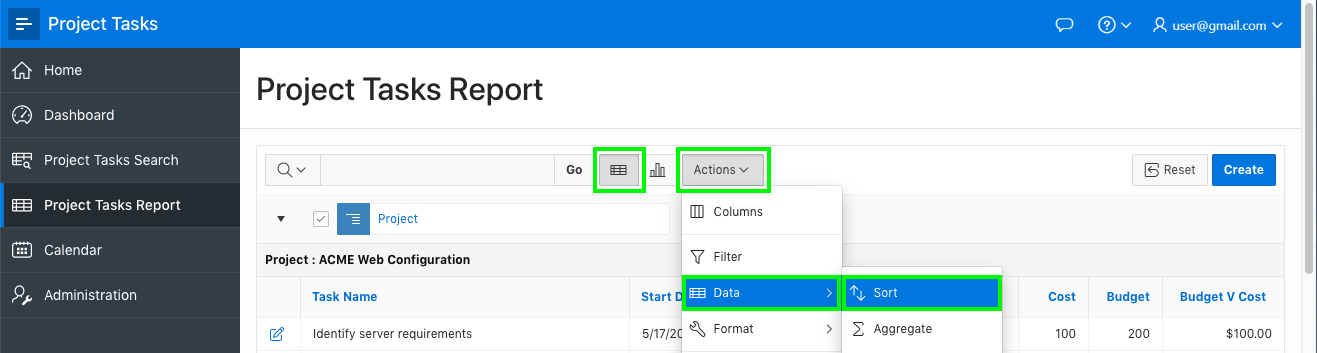
The make the data easier to digest, you’ll want to ensure that all of the records are ordered by start date and then end date within each project. At the top of the report, click the View Report icon, click Actions, select Data, and then select Sort.
-
On sort dialog box, enter the following information and click Apply.
Row Property Value 2 Column Start Date 3 Column End Date 3 Null Sorting Null Always Last 
Now that you have made modifications to the Interactive Report it is important to save the report layout. End users have the ability to save Private Reports only they can view, or Public Reports that other users can also view.
Note: Developers can remove the ability for end users to save Public Reports by changing the report attributes in Page Designer.
Developers have the ability to save the report as the Primary Report (default), or an Alternative Report so that different views of the data can be made available for different use cases. In the next steps, you will save the report as an Alternative Report.
-
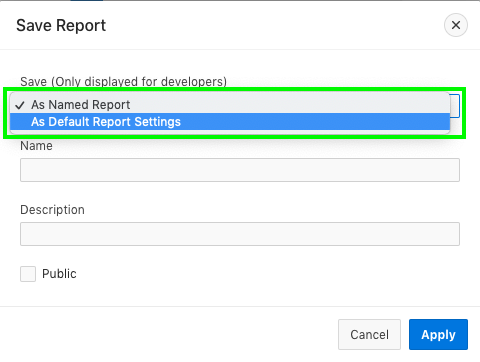
In the report, click Actions, select Report, and then select Save Report.
-
On Save Report, in the Save(Only displayed for developers) drop-down list, select As Default Report Settings.
Note: End users can save Private and Public reports; however, only developers (who have run the app from the App Builder) can save the Primary and Alternative reports.
-
On Save Default Report, select Alternative, in the Name field, enter Budget Review, and then click Apply.
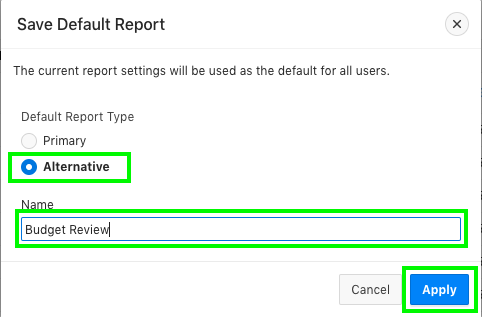
A new select list will be displayed at the top of the report which lists all of the saved reports available to the user.
-
Return to the initial report view and select 1. Primary Report, and then click Reset.

In the next section, we’ll improve the form pages. Form pages allow end users to easily update a single record of information. It is very common for these pages to be modal pages, whereby they display over the top of the original page, and the original page is greyed out and not accessible without first closing the modal page. Advantages of modal pages are that the same page can be called from numerous other pages. They include all of the processing, validations, and so forth within the page definition, they are user friendly, and make for a very straight forward user experience.
By default, the form pages generated by the Create Application Wizard are modal pages. The modal page for maintaining Project Tasks takes up significant real estate. This could easily be improved by placing the dates on the same line, and the cost and budget on the same line. Lastly, the status allows any values to be entered, so you should restrict data entry by adding a list of allowed statuses.
-
In the Runtime environment, on the Project Tasks Report page, click the edit icon for any record.
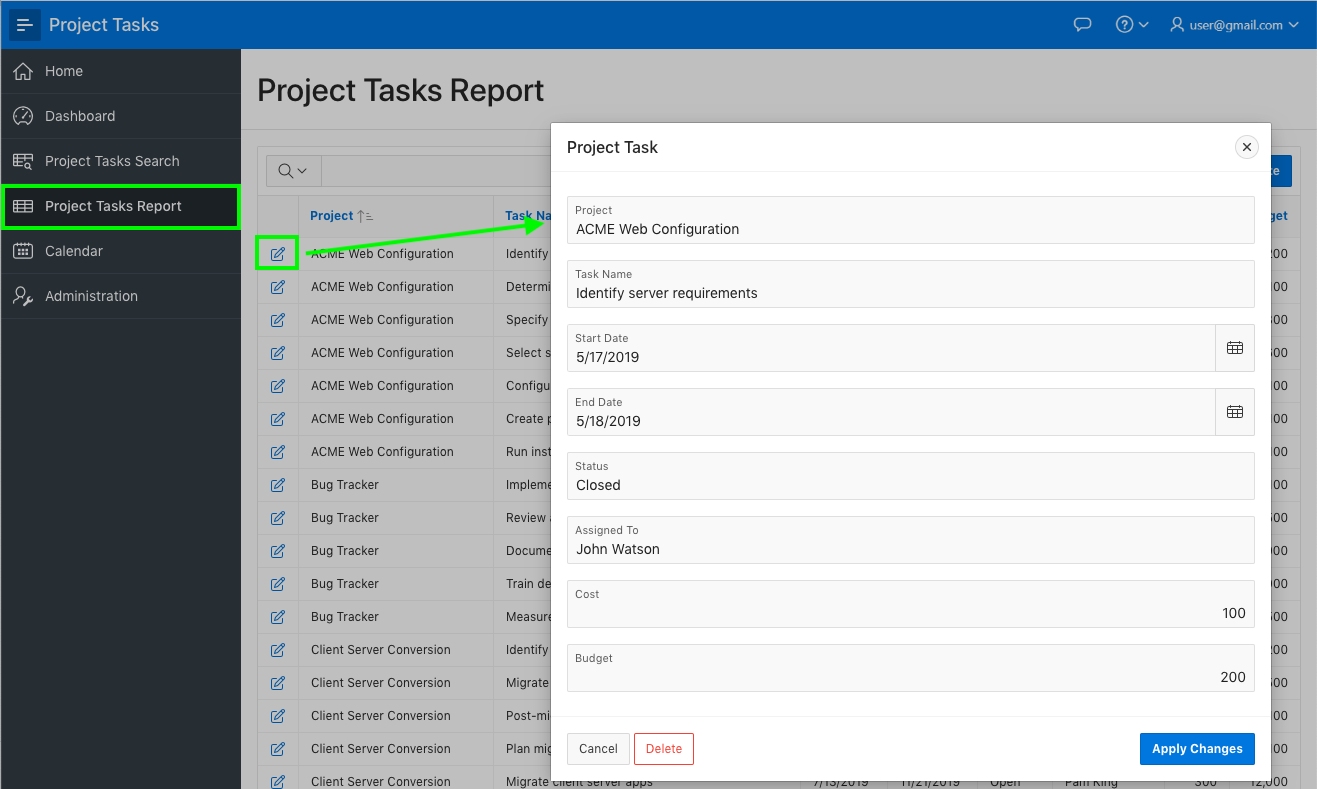
The modal form page for the selected record will be displayed.
-
In the Developer toolbar, at the bottom of the screen, click Edit Page 5.
Note: If you have difficulties navigating using the Developer toolbar, manually navigate to the browser tab for the APEX App Builder. If you are on the application home page, navigate to the page by clicking 5 - Project Tasks. If already on another page in Page Designer, use the page selector in the toolbar to navigate to page 5.
Items can be moved by dragging and dropping them within the Layout panel. You can also drag new components like regions, items, and buttons from the Gallery, below Layout, into the Layout.
-
In Page Designer, with Page 5 loaded, within Layout (middle pane), click P5_END_DATE and continue to hold the mouse down. Drag the item up and to the right, until it is directly after P5_START_DATE, and a dark yellow box is displayed. Release the mouse to drop the item in the new location.

As an alternative to using drag-and-drop you can also reposition items using attributes in the Layout Panel.
-
(Alternative method) In Page Designer, within Layout (or the Rendering Tree in the left pane), select P5_BUDGET. In the Property Editor (right pane), in Layout, deselect Start New Row.
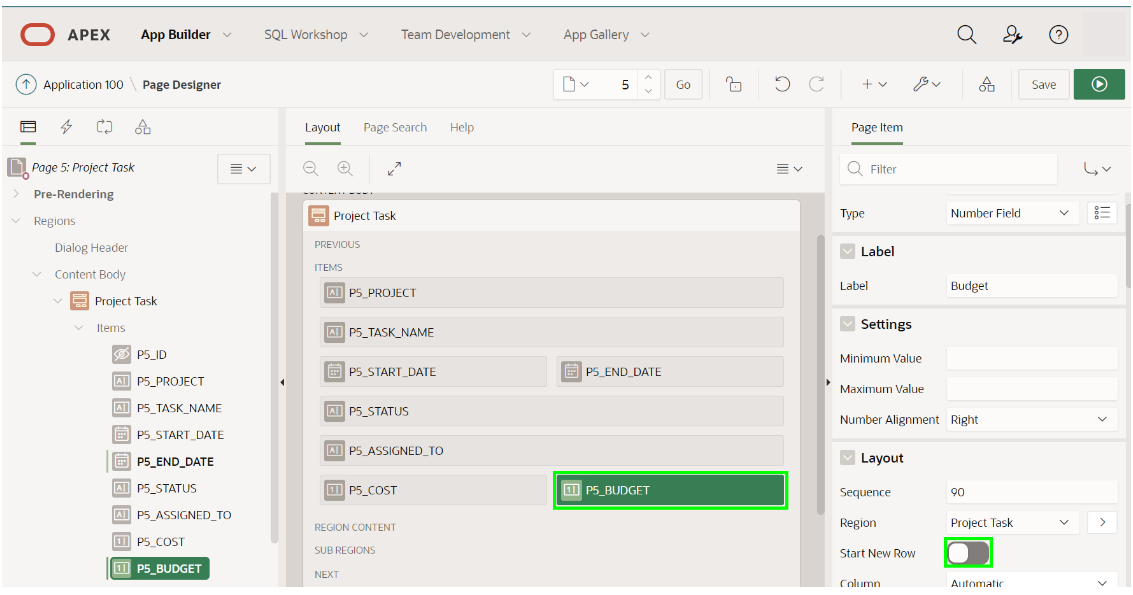
Note: As soon as you deselect Start New Row the item will move to be on the same line as the item above, within Layout.
Next you’ll enhance the report to limit data entry. To limit the data entry for an item one of the simplest techniques is to convert a text item, which allows any data to be entered, into a select list.
-
In Page Designer, within the Rendering Tree (left pane), select P5_STATUS. In the Property Editor (right pane), enter the following information:
Group Attribute Value Identification Type Select List List of Values Type SQL Query Display Extra Values Uncheck Null Display Value Type in - Select Status - 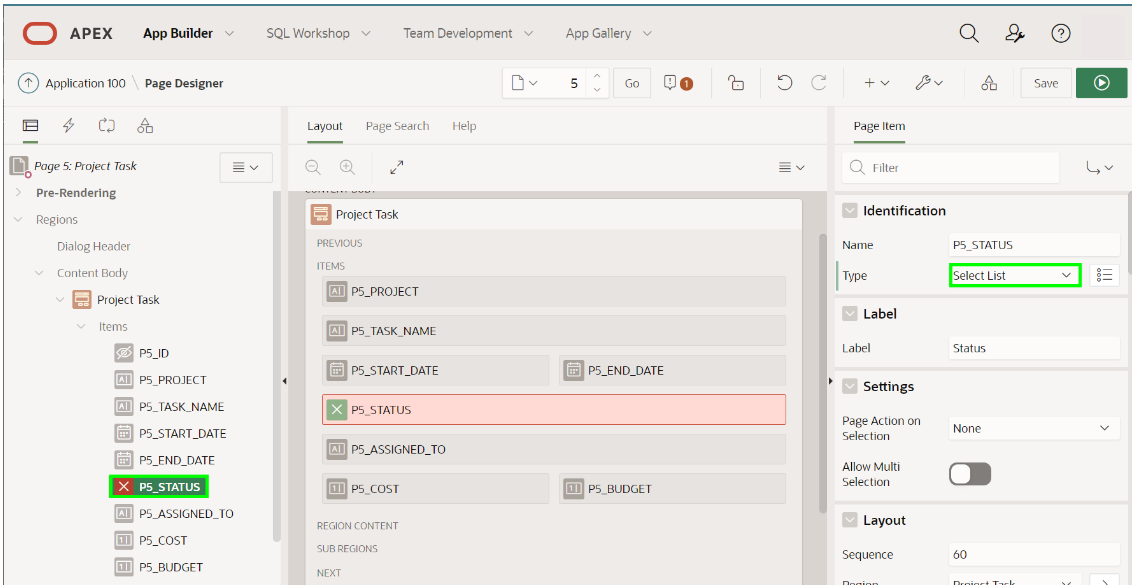

-
In List of Values and in the SQL Query field, enter the following code:
select distinct status d, status r
from project_tasks
order by 1
-
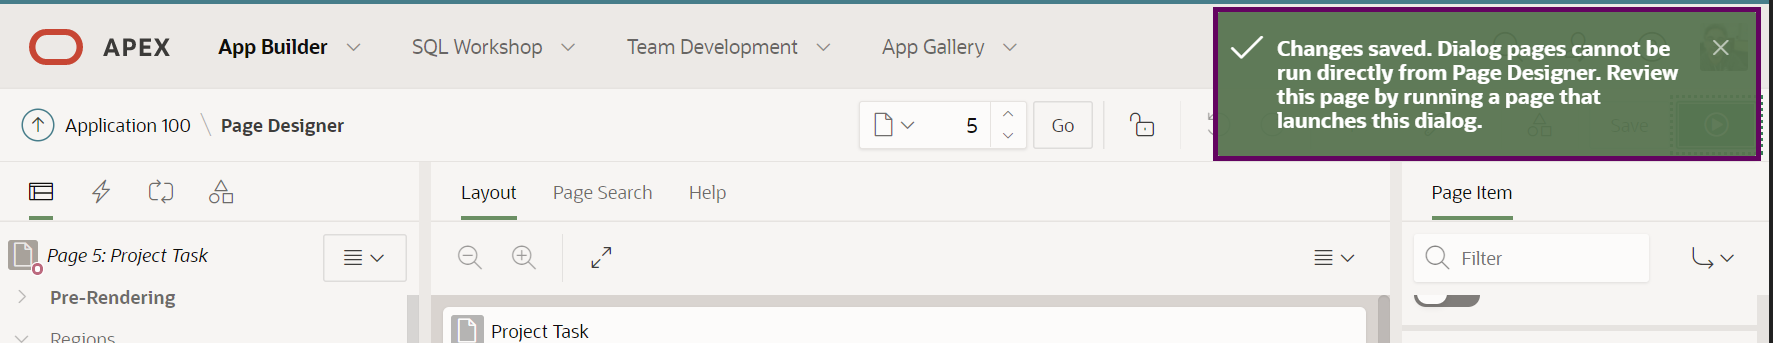
It is important to save your changes before testing. In Page Designer, within the toolbar (at the top), click Save.
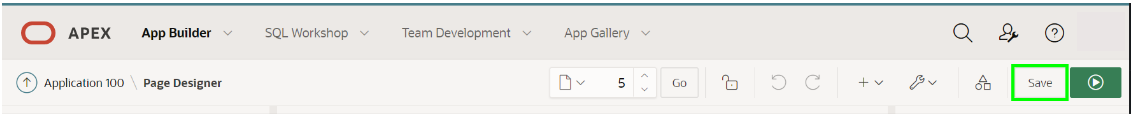
Note: If you press Save and Run in the toolbar a message will be displayed, rather than the page being run. This is expected behavior, as modal pages can not be run directly from Page Designer.
-
Navigate back to the runtime environment and refresh the browser, or click Cancel on the modal page to return to the Project Tasks Report page.
-
On the Project Tasks Report page, click the edit icon for any record. Review the improved layout and click Status to see the list of available statuses.

Well done! You’ve learned how to customize the basic reporting functionality in your simple APEX application. You’ve shown how to create simple data relationships and display them in graph form. You’ve also demonstrated that even end users can use the powerful functionality of APEX if that’s in the customers best interest. In the next section you’ll dive into the calendar application.
Improve the Calendar (Optional)
In this step, you will learn how to enhance the calendar for a customer use case. You’ll link an existing calendar page to a modal form page. The default Calendar page displays the project, rather than the task name, and only shows the start date, where the customer may want to see duration-based events. We’ll change these items to illustrate basic customizations to get you started with the calendar.
Video Overview
-
In the runtime environment, click Calendar.

Note: You may have to use the arrows at the top of the calendar to navigate backward or forward months to see data displayed.
-
In the Developer toolbar, click Edit Page 6. Alternatively, navigate back to the APEX App Builder browser tab and manually navigate to Page 6.
We will change the column that gets displayed in the calendar view and make the events duration based by updating the calendar attributes.
-
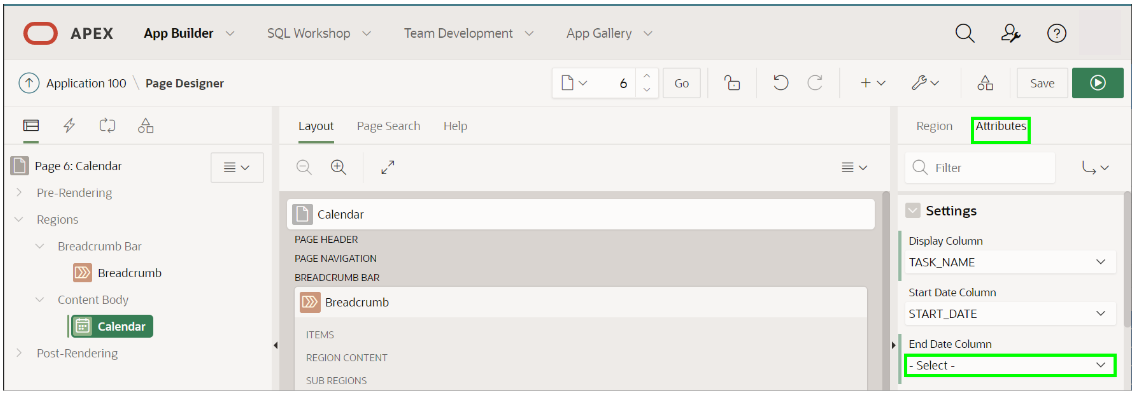
In Page Designer, within the rendering panel (left pane), click the Calendar entry, and then click the Attributes tab which you’ll find in the Property Editor as the second tab next to the Region tab.
-
Within the Property Editor (right pane), in Settings and then Display Column click the drop-down list for Display Column and select TASK_NAME, and from the End Date Column drop-down list, select END_DATE.

-
In Page Designer, within the toolbar, click Save and Run to review your changes.

Take a look at the revised calendar and you may realize that maybe changing to duration based events isn’t going to be as cool as you thought it would be. So let’s make a slight change and remove the End Date Column added above.
-
Navigate back to the APEX App Builder and in Page Designer, select Page 6. In the Rendering Tree (left pane) click Calendar, and click Attributes again in the far right page tab.
-
Within the Property Editor (right pane), for Settings and End Date Column select - Select - to clear the END_DATE entry and make your calendar a bit more user friendly.
-
In Page Designer, click Save and Run to see your enhanced calendar.
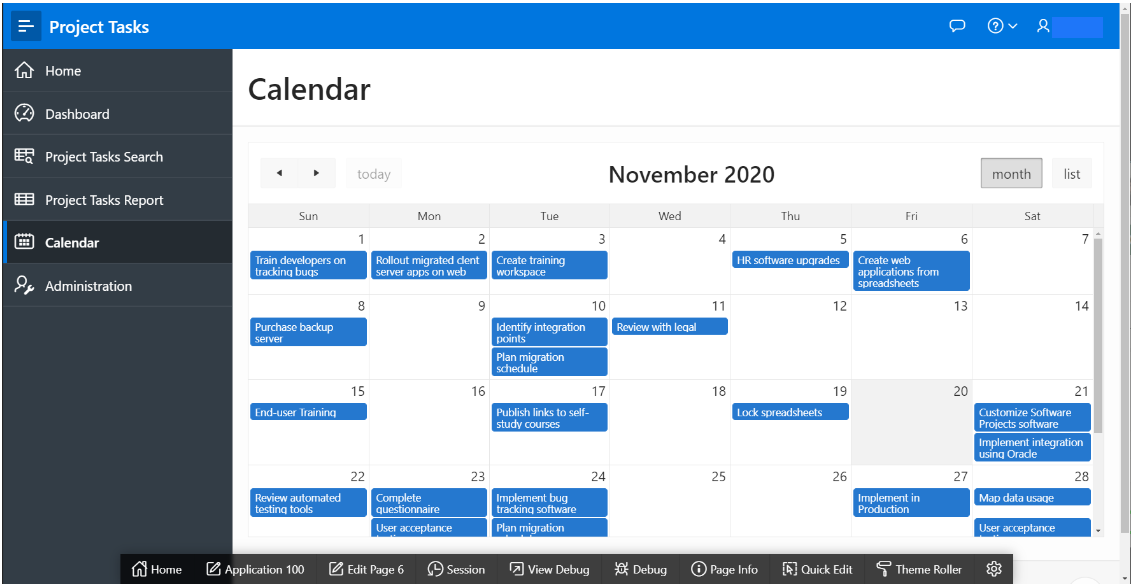
The next improvement we’ll make is to change what clicking on a calendar event does. Currently, when you click or hover on a calendar entry it shows event details. The customer believes it would be more useful to allow end users to link directly to the Project Task form so they can easily update the details. So we’ll link items in the calendar in the next steps.
-
Navigate to the APEX App Builder, and ensure Page Designer is displayed with Page 6 selected.
We’ll create a view / edit link from the Calendar region to Page 5, the Project Tasks form page you modified in the previous lab.
-
In Page Designer, within the Rendering Tree (left pane), click Calendar, and then click the Attributes tab in Property Editor (right pane). Within the Attributes Settings section, find the View / Edit Link entry. Click where it says No Link Defined.
-
Use the drop-down list and selection fields to enter the following information in the resulting form, and then click OK:
Property Value Type Page in this application Page 5 Set Items > Name P5_ID Set Items > Value &ID. Clear Cache 5 Action Reset Pagination 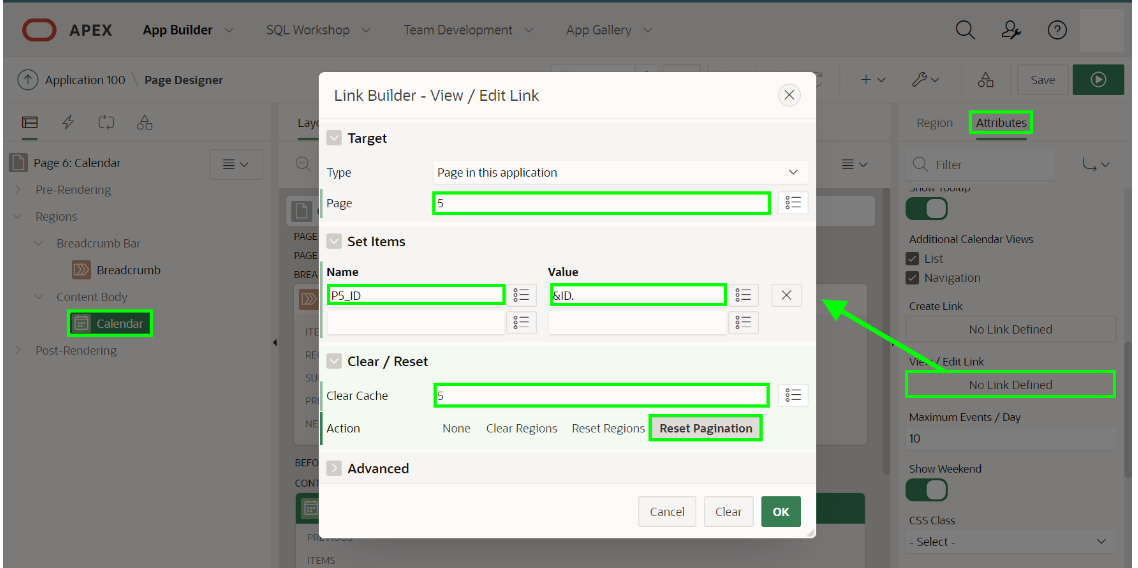
It is important that the calendar is updated whenever the Task Name or Start Date is changed using the new link. To ensure the page is updated appropriately you need to define a Dynamic Action to refresh the calendar region when the dialog box (modal page) is closed. A Dynamic Action is a declarative way to define client-side interactivity. Developers specify when an event fires, what actions are to be taken, and on what components the action is to be performed.
-
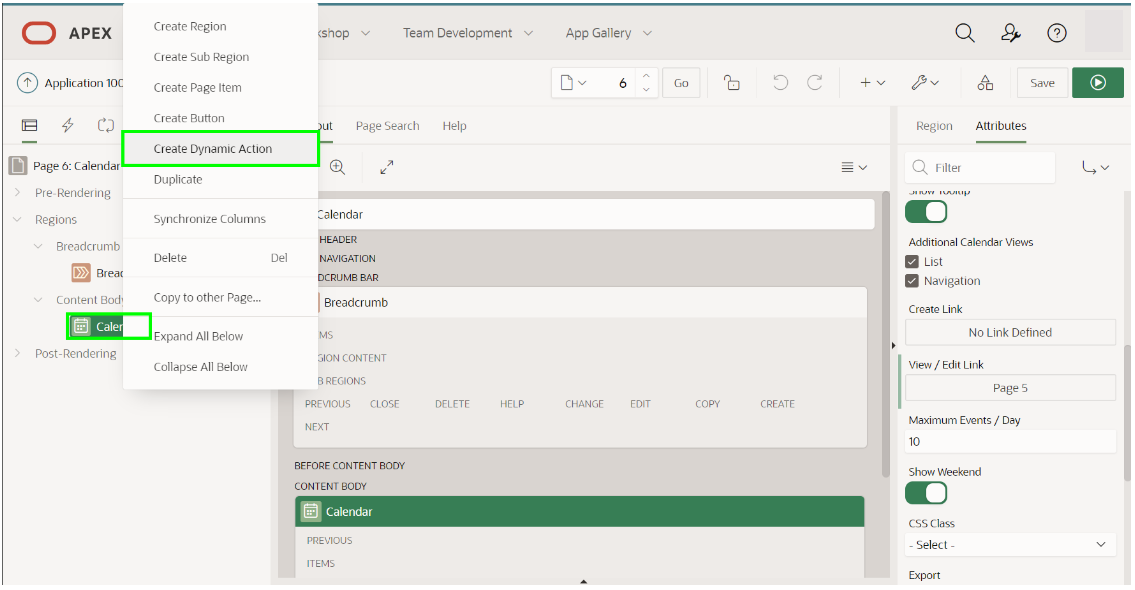
In Page Designer, within the Rendering Tree (left pane), right-click the Calendar region, choose Create Dynamic Action from the menu.
-
With the Dynamic Action selected, within the Property Editor (right pane), enter the following information:
Group Property Value Identification Name Refresh Calendar When Event Dialog Closed Selection Type Region Region Calendar 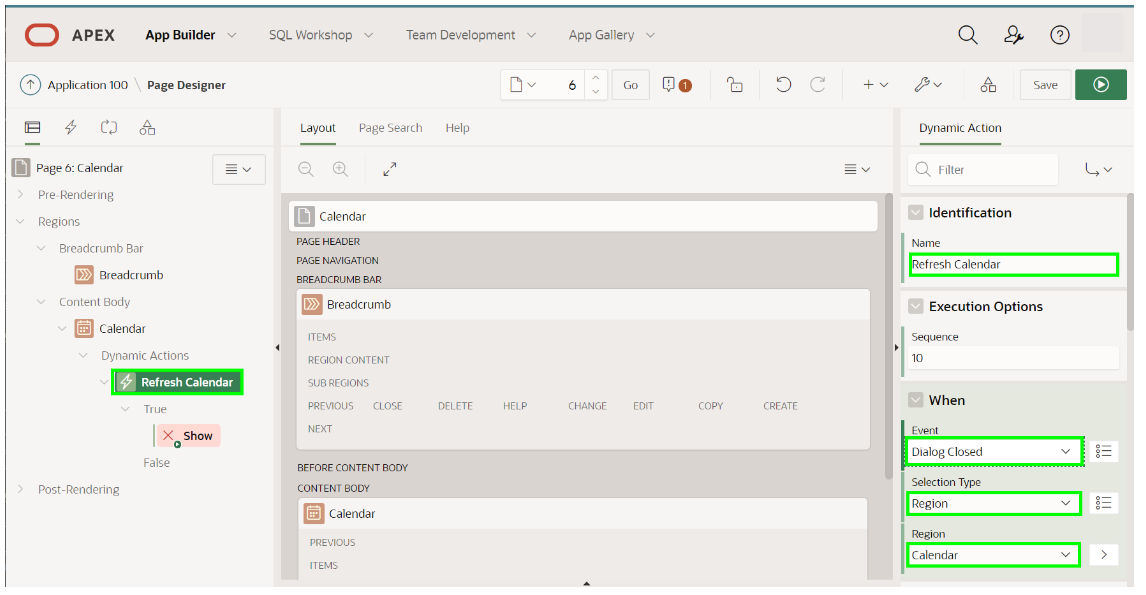
-
Within the Rendering Tree (left pane), under the True action for the Dynamic Action, select Show. In the Property Editor (right pane), enter the following information:
Group Property Value Identification Action Refresh Affected Elements Selection Type Region Region Calendar 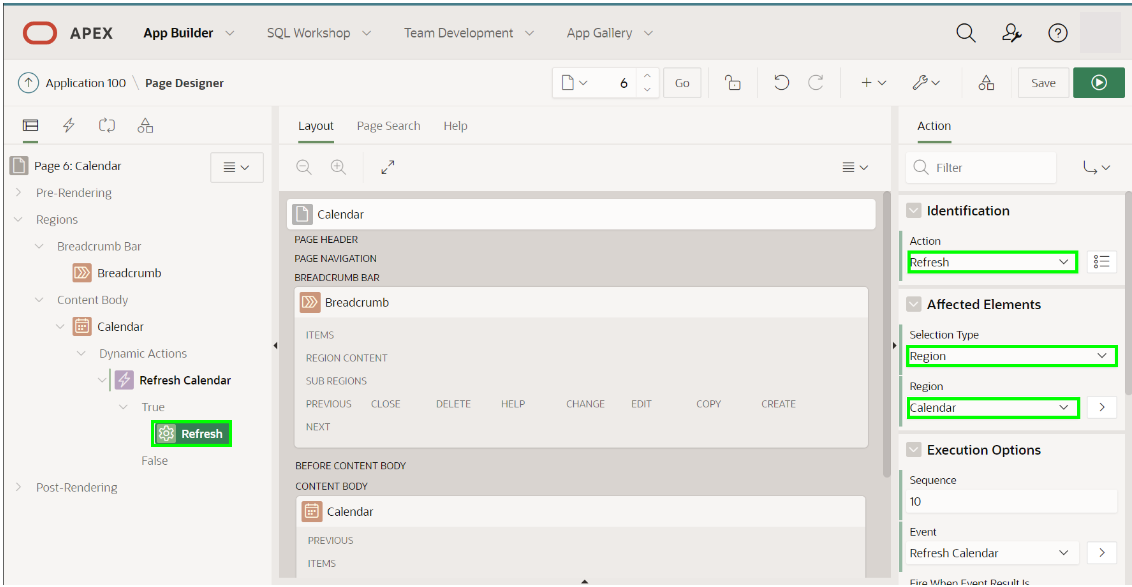
-
In Page Designer, within the toolbar, click Save and Run to review the completed application.
-
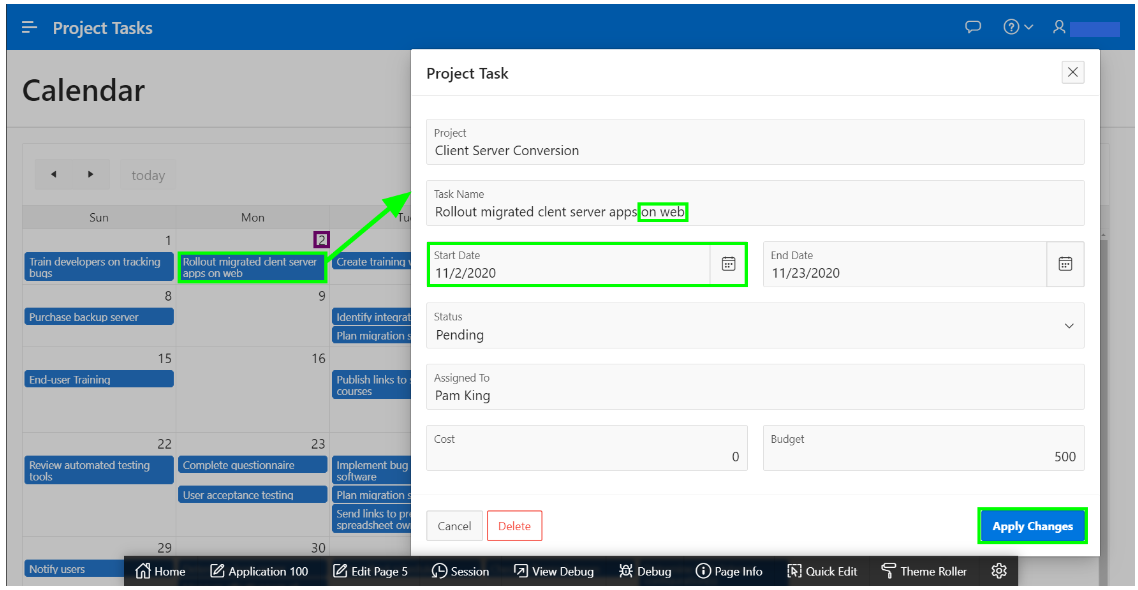
In the runtime environment, from the Calendar, select an event to view the enhanced calendar behavior. Choose an item the calendar and make an update. In the Project Task form page, update the Task Name and Start Date. Click Apply Changes.
-
Confirm that the calendar refreshes to show the updated details.
Nice! You have created an Oracle Autonomous Transaction Database and converted a typical business spreadsheet into a powerful application. You have refined the data and adjusted many of the defaults to show just a few of the customizations that customers can choose to make their applications even better. Feel free to run through this demo until you can comfortably do it without the instructions.
Now you can confidently show a customer the power of APEX and Oracle Autonomous Database!
Related Links
More Learning Resources
Explore other labs on docs.oracle.com/learn or access more free learning content on the Oracle Learning YouTube channel. Additionally, visit education.oracle.com/learning-explorer to become an Oracle Learning Explorer.
For product documentation, visit Oracle Help Center.
Use APEX to create an app from a spreadsheet
F40815-04
November 2021
Copyright © 2021, Oracle and/or its affiliates.