Note:
- This tutorial is available in an Oracle-provided free lab environment.
- It uses example values for Oracle Cloud Infrastructure credentials, tenancy, and compartments. When completing your lab, substitute these values with ones specific to your cloud environment.
Debugging GraalVM Native Image Generated Executables
Introduction
This lab introduces you to the debugging support provided by Visual Studio Code (VS Code) for Java applications compiled ahead-of-time using GraalVM Enterprise Native Image.
The use of GraalVM Native Image ahead-of-time compilation continues to grow and along with that growth comes the need for tooling. The GraalVM Tools for Java extension for VS Code includes debugging support for executables generated by GraalVM Native Image that provides:
- breakpoints
- watchpoints
- interactive step-by-step execution
- variable inspection for executables
This lab introduces these features (and more) in the context of a small example.
GraalVM Enterprise is available at no cost on Oracle Cloud Infrastructure (OCI)
Lab Contents
In this lab you will:
- Initialize the Lab environment
- Connect to a remote VM host in Oracle Cloud where you will perform the lab
- Build and compile a Java application into a native executable using GraalVM Native Image
- Configure native debugging for an application in VS Code
- Set breakpoints and step through Java source compiled into native machine code
Estimated lab time: 45 minutes
NOTE: Whenever you see the laptop icon you’ll need to perform an action such as entering a command or editing a file.

# The box under the icon will tell you what to do.
STEP 1: Connect to a VM Instance
When you start the lab the necessary compute resources are provisioned in the background (in this case a VM instance). It can take a few minutes to complete provisioning. You can tell when the resources are fully provisioned and ready by consulting the Resources tab on the Luna Lab webpage (see step 2, below).
-
Double-click the Luna Lab icon on the desktop to open the browser.

-
When the animated gear besides Resources turns into a checkmark, all the required compute and network resources are provisioned, and you can proceed.

-
Scroll down to Setup and copy the text from the Open VSCode and Connect text box. You many need to click on
View Details. This script will setup the environment needed for the lab and launch VS Code. You can use the Copy to clipboard button on the far right that appears when you hover over the box.
-
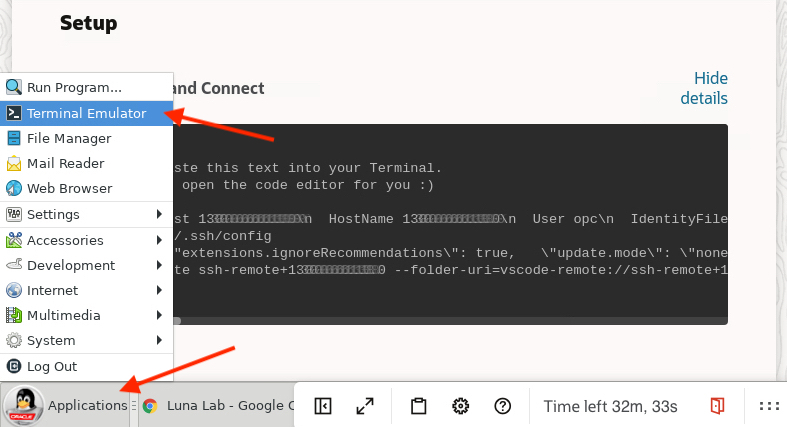
Click the Applications menu and open a Terminal Emulator.
-
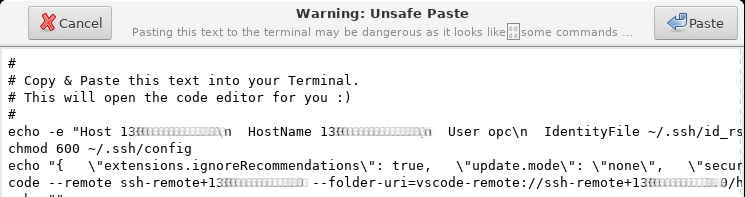
Place your cursor in the Terminal window and paste the lab init script you copied (Shift+Ctrl+V). A dialog box will warn you that you’re pasting multiple lines which looks suspicious, but click Paste to proceed.
-
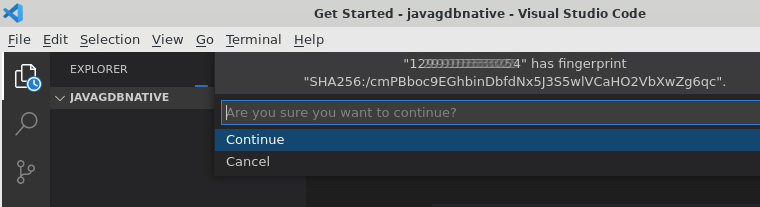
A VS Code window will open and automatically connect to the remote VM instance that has been provisioned for you. Click Continue to accept the machine fingerprint.
-
The green box at the lower left corner of VS Code will display
SSH: <REMOTE
VM IP ADDRESS>
to indicate you are connected over SSH.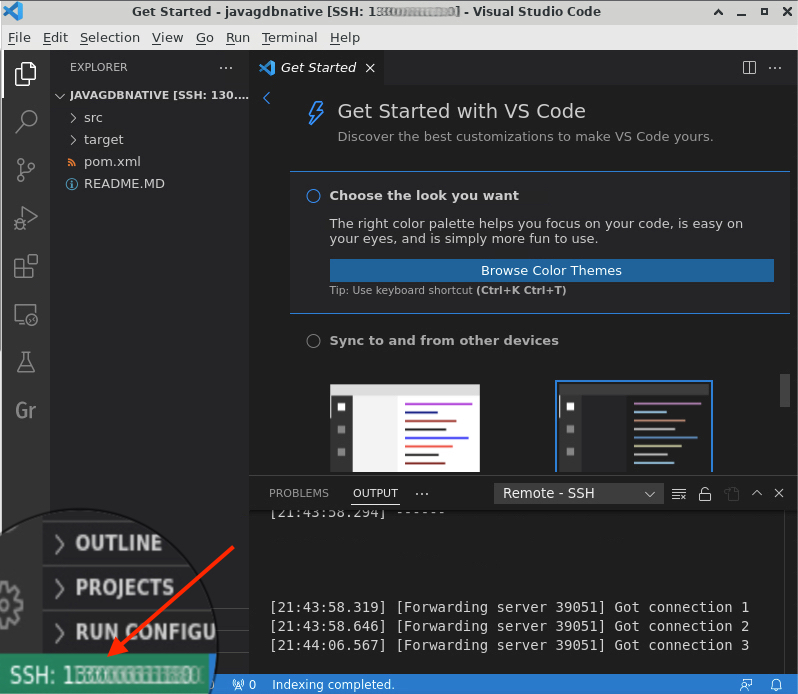
STEP 2: Building the Example Application
With the VS Code GraalVM Tools for Java you can build, test, and debug Java applications running on the JVM. However, our focus in this lab is on debugging native executables generated by GraalVM Native Image, so we won’t be using all the functionality the tools provide.
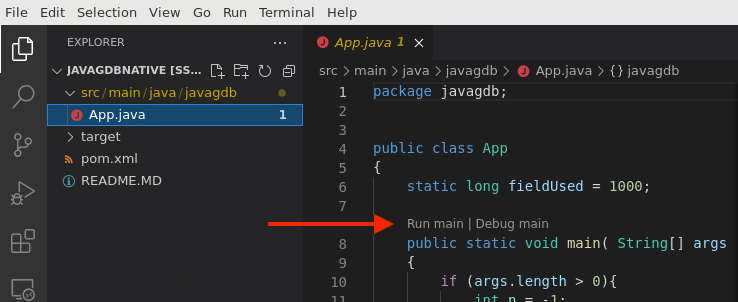
Open src/main/java/javagdb/App.java and look at the source. The application
calculates the factorial of the value passed as its input argument.
You can run or debug the application on the Java Virtual Machine (JVM) using the links overlaid in the source code (as shown). However, some additional setup is required before debugging a native executable.
Note that the call to neverCalledMethod() is underlined with a yellow wavy
line to indicate that this code is unreachable. This dead code is included
intentionally in the application. Later, we’ll see how GraalVM Native Image
deals with dead code in a native executable when we’re debugging.

Compile the application and generate a native executable. To do this, run the
application’s Maven build: it first compiles the application’s Java sources with
javac and then uses the GraalVM Native Build
Tools Maven plugin to generate a
native executable using the native-image utility.
-
Open a terminal using the Terminal>New Terminal menu at the top of the VS Code window.
-
In the terminal, run Maven to build the project.
mvn -Pnative -DskipTests packageThe time required to generate a native executable is highly dependent on the number of cores and the amount of available memory provided by your machine. It should take under a minutes on your lab machine.
-
You will find the generated executable named
javagdbin thetargetfolder. Note that it’s only a few MBs!ls -lh target
STEP 3: Creating a Debug Configuration in launch.json
Now that you have an executable generated with debug symbols, you can try out the GraalVM Tools for Java debugging support.
-
Click the Run and Debug icon in the
Activity Baron the left to open the debugSide Barpanel. -
Click the create a launch.json file link and select
Native Imagefrom the environment drop-down list.
-
The
launch.jsonfile contains a boilerplatenativeimageconfiguration for you to update. Edit the value of thenativeImagePathproperty to locate to thejavagdbexecutable in thetargetfolder and add anargsproperty to provide the input argument.{ // Use IntelliSense to learn about possible attributes. // Hover to view descriptions of existing attributes. // For more information, visit: https://go.microsoft.com/fwlink/?linkid=830387 "version": "0.2.0", "configurations": [ { "type": "nativeimage", "request": "launch", "name": "Launch Native Image", "nativeImagePath": "${workspaceFolder}/target/javagdb", "args": "100" } ] }
STEP 4: Debugging an Executable
With the code compiled and the launch configuration in place, you’re ready to debug the executable. Set a breakpoint and step through the code.
-
Return to
App.javaand set a breakpoint at line 10 by clicking in the margin to the left of the line number.
-
Click the green arrow at the top of the Debug Side Bar to run the application in debug mode.

Note that the status bar at the bottom of the VS Code window changes color to orange as an indication that debugging is taking place.

-
The application starts quickly, debug controls appear above the application source, and execution stops at the breakpoint you set at line 10.

-
Use the
Step Overbutton in the debugger controls to step down to line 17. Notice that the value of the local variablenis100.
-
Continue stepping down to line 21 and now the local variable
fis defined and is set to 100 factorial.
-
Scroll down in the source code so you can see lines 24 to 35. Notice that both the expression calling
neverCalledMethod()and the entire method definition are grayed out.GraalVM Native Image detects and eliminates dead or unreachable code from the executable that it generates. Neither the
if(false)expression nor theneverCalledMethodexist in the machine code of the executable. To illustrate this, the debugger grays out eliminated code.
-
Click the debugger control
Continuebutton to let the program run to completion or use theStep Overbutton to step through the rest of the program. Output is displayed in theDEBUG CONSOLE.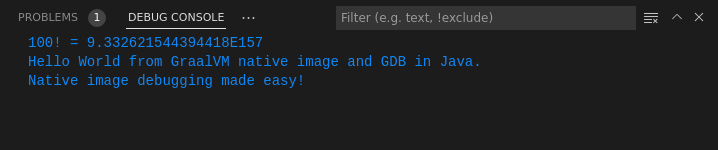
Conclusion
In this lab you used the GraalVM Tools for Java to debug an ahead-of-time compiled executable generated by GraalVM Native Image. You learned how to create a launch configuration, how to set a breakpoint and step debug an application, and how to recognize code that has been detected as unreachable and therefore not included in the executable.
To learn more about developing with GraalVM Native Image:
- Watch a short GraalVM Native Image Hello World video.
- Learn the basics of ahead-of-time compilation in the GraalVM Native Image Quick Start online lab.
- Watch a presentation by the Native Image architect Christian Wimmer: Java Ahead-of-Time Compilation with Oracle GraalVM
- Read the GraalVM Native Image reference documentation
More Learning Resources
Explore other labs on docs.oracle.com/learn or access more free learning content on the Oracle Learning YouTube channel. Additionally, visit education.oracle.com/learning-explorer to become an Oracle Learning Explorer.
For product documentation, visit Oracle Help Center.