Debug an Oracle JET web app
Introduction
This tutorial shows you how to debug an Oracle JET web app using browser developer tools.
Debugging in a browser is useful to quickly isolate problematic code and to test solutions. All browsers have developer tools that you can use to perform tasks, such as viewing and revising the HTML, Cascading Style Sheets (CSS), and JavaScript source. For example, when you run your Oracle JET web app in the Google Chrome web browser, you can use Google Chrome Developer Tools (Chrome DevTools) to examine the page source and CSS styles for each component.
Objectives
In this tutorial, you will learn how to use web developer tools in your browser to locate incorrect code in your Oracle JET web app, change a supplied sample project file, and review the changes live in the browser.
Prerequisites
- A development environment set up to create Oracle JET web apps that includes an installation of Node.js
- Google Chrome installed
- Completion of the previous tutorial in this learning path, Data Bind a Component in an Oracle JET Web Application
- The dashboard.html
sample downloaded to the
JET_Web_Application/src/ts/viewsdirectory
Task 1: Run the Web App
-
Navigate to the
JET_Web_Application/src/ts/viewsdirectory, create a backup copy of yourdashboard.htmlfile, and then download the provided dashboard.html sample file to the same directory. -
If the Oracle JET tooling server batch job is running in the terminal window, press Ctrl+C, and if prompted, enter
yto exit the server batch job. The server batch job only recognizes revisions that you make to existing app files. After you create new files, you must run the web app again. -
In the terminal window, from the
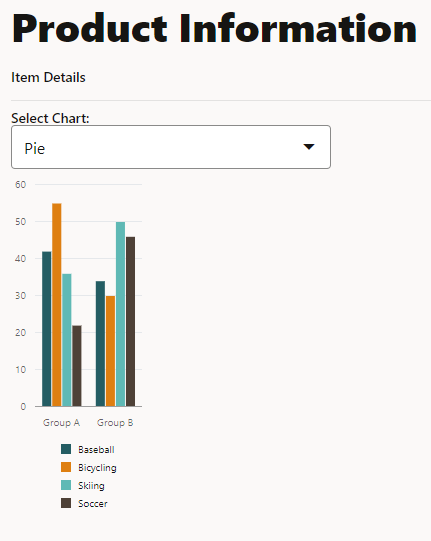
JET_Web_Applicationdirectory, run the app.npx ojet serveYour browser displays the sample with a compressed chart. The Select Chart dropdown list doesn’t work.

-
If your default browser isn’t Google Chrome, then open it and copy the open page’s address into the Google Chrome URL address field.
Task 2: Debug the Web App
-
In your Google Chrome browser, press Ctrl+Shift+I to display the Developer Tools window. Chrome DevTools displays the source code.
-
In the Elements panel, expand the nested tags until you locate the
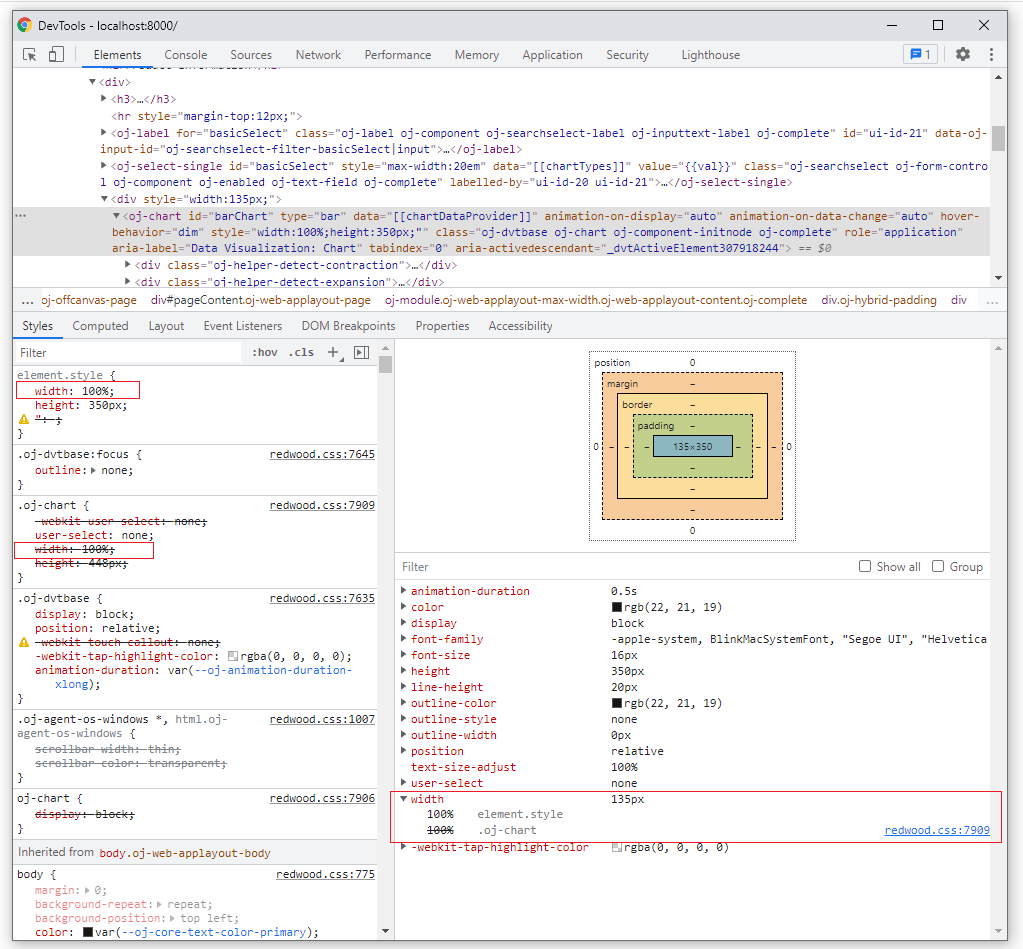
oj-chartcustom HTML element. Notice that thetypeattribute for theoj-chartcustom HTML element is hard-coded asbarinstead of using the value of theoj-select-singlecustom HTML element. In the Styles panel of Chrome DevTools, below the Chart component position diagram, notice also that the Chart componentwidthattribute is set to135pixels.
The
oj-chartcustom HTML element is contained by an HTML div element that sets the width to 135px and causes the Chart component to look compressed on the page. Thus, the Chart component inherits its width from a parent container and ignores the style width setting of 100%.
Task 3: Fix the Web App Code
-
Navigate to the
JET_Web_Application/src/ts/viewsdirectory and open thedashboard.htmlfile in an editor. -
Search for the
oj-chartcustom HTML element. Change the chart type to[[val]]and remove the<div>tags that surround thetag. . . . </oj-select-single> <oj-chart id="barChart" type="[[val]]" data="[[chartDataProvider]]" animation-on-display="auto" animation-on-data-change="auto" hover-behavior="dim" style='width:100%;height:350px;'> <template slot="itemTemplate" data-oj-as="item"> . . . -
If not already present, add a style class,
chartStyle, at the end of theappRootDir/src/css/app.cssfile:.chartStyle { max-width: 500px; width: 100%; height: 350px; } -
Replace the
styleattribute with theclassattribute that references style properties in yourapp.cssfile.<oj-chart id="barChart" type="[[val]]" . . . style='width:100%;height:350px;'>Becomes
<oj-chart id="barChart" type="[[val]]" . . . class="chartStyle">It is good practice to place styles that you want to apply to components in a separate CSS file rather than use the inline
styleattribute demonstrated in the previous example. - To verify the changes, save your file and view the live updated output of the web app in your browser.
- Replace the sample file with your original
dashboard.htmlfile. - Close the browser window or tab that displays your running web app.
- In the terminal window, press Ctrl+C, and if prompted, enter
yto exit the Oracle JET tooling batch job. - Leave the terminal window open for your next tutorial.
Next Step
Proceed to the next tutorial in this module.
This tutorial is part of the module Your First Oracle JET Web Application.
- Create an Oracle JET Web Application by Using a Starter Template
- Add Components to an Oracle JET Web Application
- Data Bind a Component in an Oracle JET Web Application
- Debug an Oracle JET Web Application
- Add Unit Tests to an Oracle JET Web Application
- Prepare to Deploy an Oracle JET Web Application
You can return to the learning path’s main page to access all the modules on building web apps.
More Learning Resources
Explore other labs on docs.oracle.com/learn or access more free learning content on the Oracle Learning YouTube channel. Additionally, visit education.oracle.com/learning-explorer to become an Oracle Learning Explorer.
For product documentation, visit Oracle Help Center.