Monitor Oracle Cloud Infrastructure with Dynatrace
Introduction
In today’s hybrid cloud environments, observability is the foundation of resilient, performant, and secure systems. As enterprises embrace Oracle Cloud Infrastructure (OCI) for critical workloads, having a single pane of glass to monitor infrastructure, services, and applications becomes crucial. Dynatrace, a leader in intelligent observability and Artificial Intelligence for IT Operations (AIOps), offers native integration with OCI to help businesses achieve exactly that.
Monitoring is no longer an afterthought, it is a strategic enabler. With Dynatrace and OCI working hand-in-hand, you can unlock end-to-end observability across your cloud estate, reduce Mean Time to Repair (MTTR) and improve digital experiences for your users.
Whether you are just starting with OCI or already running mission-critical workloads, integrating Dynatrace gives you a future-ready observability foundation powered by AI, automation, and intelligent insights.
OCI provides robust telemetry through metrics, logs, and events. However, the ability to correlate these signals across infrastructure and application tiers, apply AI for root cause analysis, and drive business decisions needs an advanced observability platform and that is where Dynatrace excels.
Benefits of the integration:
-
Full stack visibility into OCI compute, networking, storage, and managed services.
-
Davis AI to detect anomalies, automate root cause detection, and alerting.
-
Automatic topology mapping across OCI and hybrid environments.
-
Easy onboarding through Dynatrace Hub integrations.
-
Multicloud and hybrid-ready, suitable for enterprises running across OCI, other clouds and on-premises.
Dynatrace supports monitoring for the following OCI resources:
-
OCI Compute instances (VM and Bare Metal).
-
OCI Block Volumes and OCI Object Storage.
-
VCNs, Subnets, Gateways.
-
OCI Load Balancer.
-
Oracle Autonomous Database, database systems.
-
OCI Functions and containers (through Dynatrace OneAgent).
-
Alarms, Metrics, and Logs through OCI Monitoring and OCI Logging services.
-
Dynatrace can ingest data through OCI Monitoring APIs, and optionally, you can deploy the Dynatrace OneAgent for deep instrumentation.
In this tutorial, we will walk through how to integrate OCI with Dynatrace, benefits of the integration, and step-by-step guidance derived from both official resources and internal expertise.
Objective
Monitor OCI with Dynatrace.
Prerequisites
-
Active Dynatrace tenant.
-
OCI tenancy with administrative access.
-
Ability to create resources like compartments, users, groups, policies.
-
OCI API access from Dynatrace ActiveGate is required.
Task 1: Install an Environment ActiveGate
A Dynatrace ActiveGate acts as a secure proxy and can also perform monitoring. It optimizes traffic volume, reduces complexity and ensures the security of sealed networks. It uses API to query and monitor a wide range of cloud and data center technologies.
Note: To access and perform the installation of an Environment ActiveGate on Linux within Dynatrace managed, you need Admin user role, Cluster administrator role and Deployment admin role permissions. For more information, see Hardware and system requirements for routing/monitoring ActiveGates on Linux.
Also ensure that your firewall settings allow communication to Dynatrace. Depending on your firewall policy, you may need to explicitly allow certain outgoing connections. Environment ActiveGate normally listens (accepts incoming connections) on port
9999and talks to Dynatrace (makes outgoing connections) on port443.
-
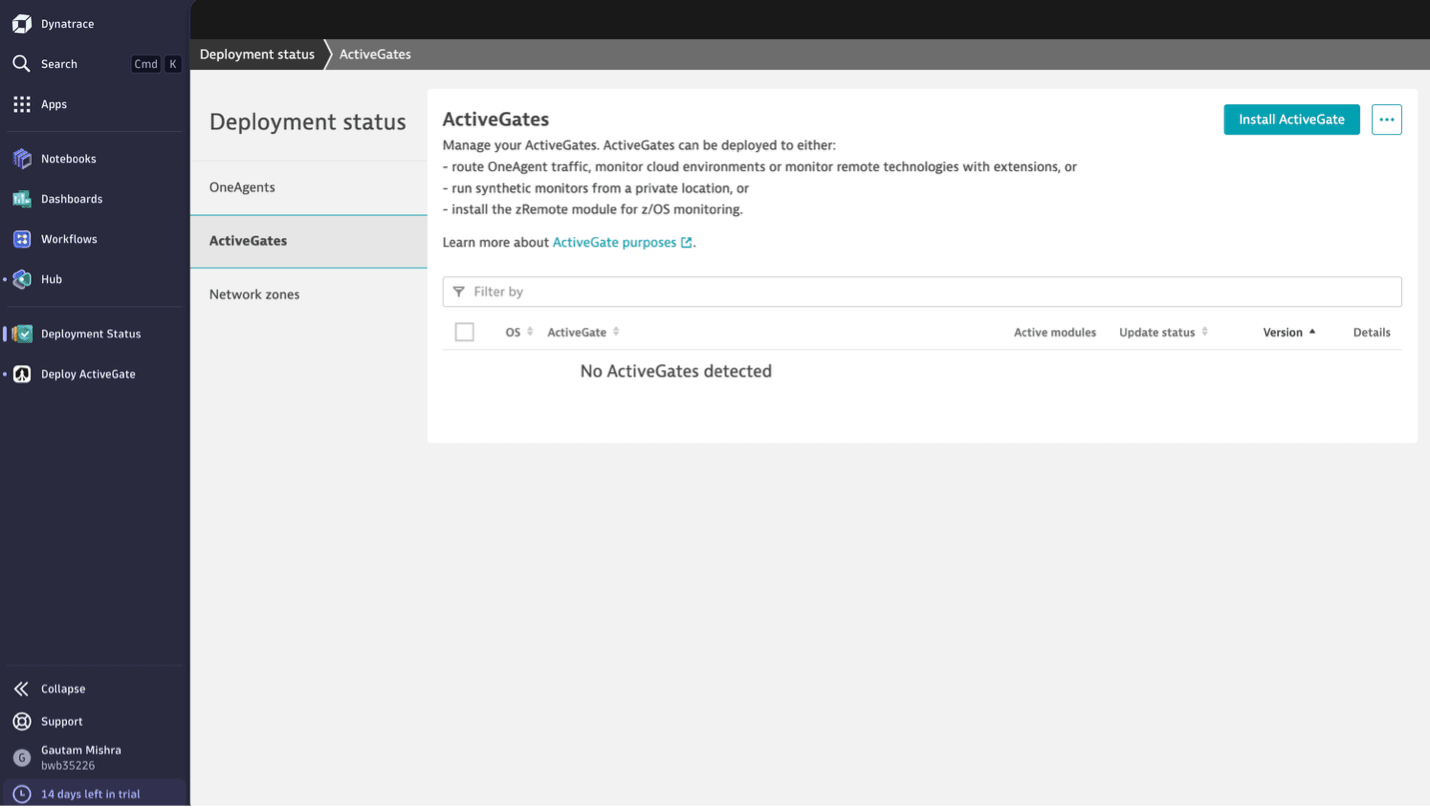
Go to the Dynatrace Hub Console, navigate to ActiveGate and click Install ActiveGate.
-
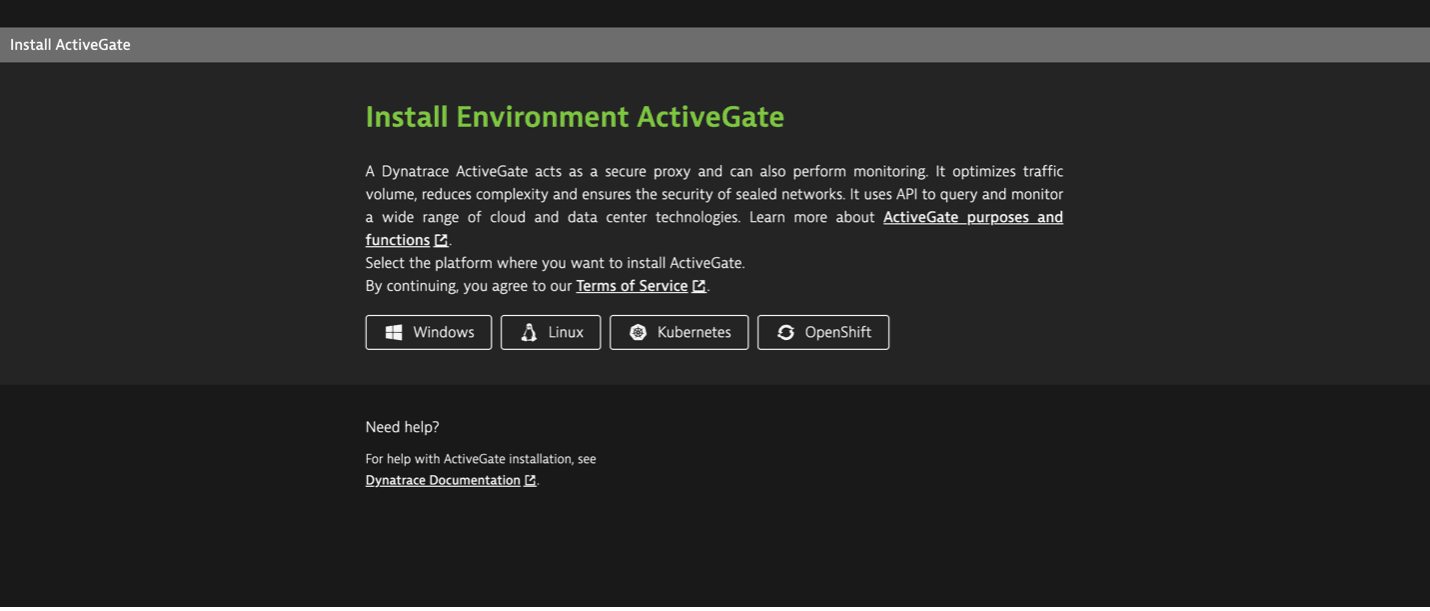
In the Install Environment ActiveGate page, select the appropriate OS, for this tutorial select Linux.
-
The method you use to download the installer depends on your deployment strategy. You can either download the installer directly onto the target server where Environment ActiveGate will be installed, or download it on another machine and securely transfer it to the intended server.
-
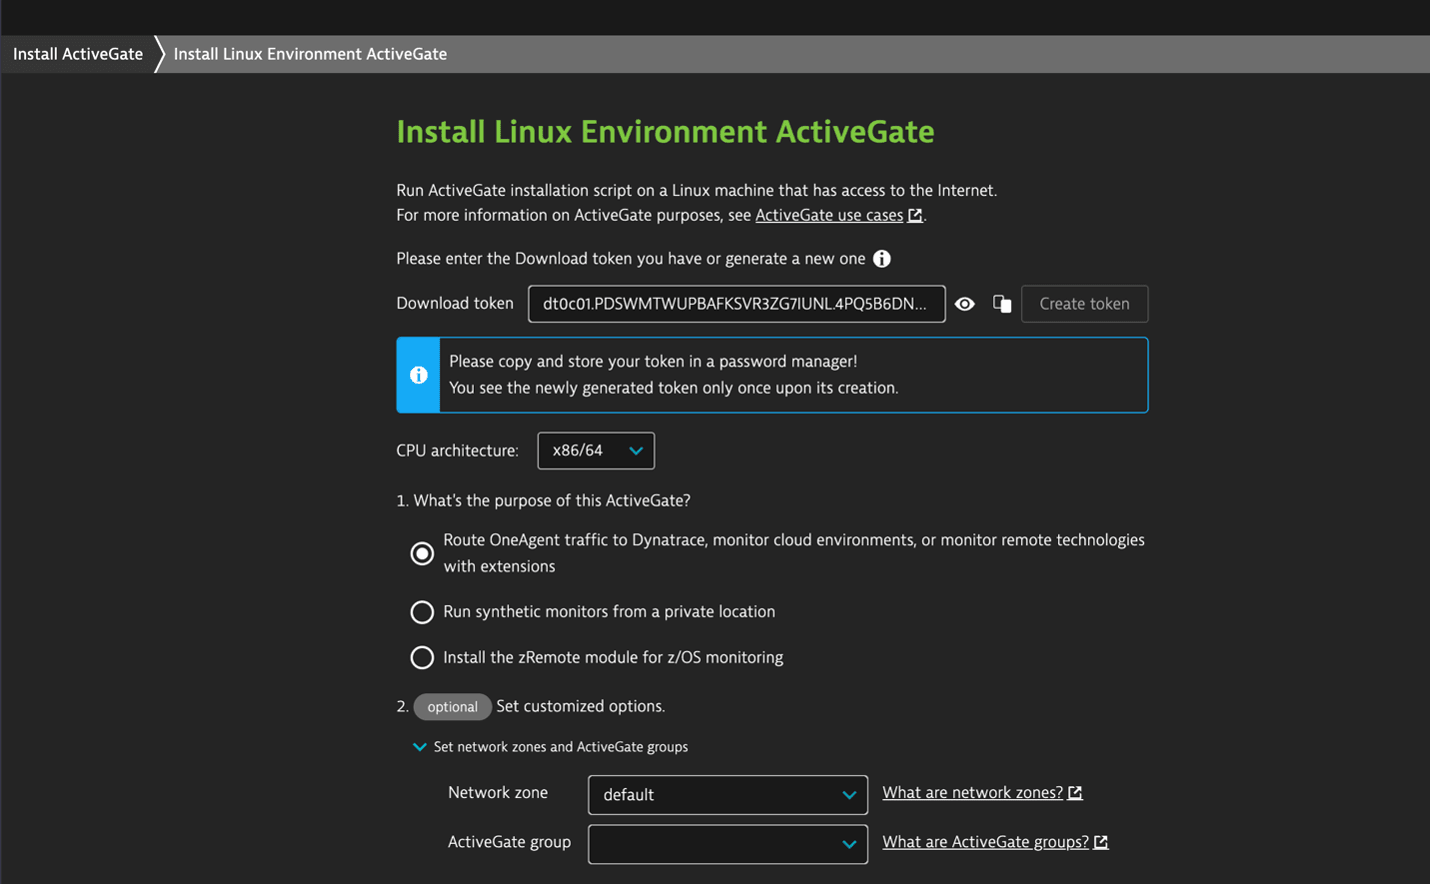
Click Create Token. This token is necessary for downloading the Environment ActiveGate installer from your Dynatrace environment. It will be automatically included in the download and installation commands you will execute later.
-
Select installer type. Environment ActiveGate supports the
x86-64ands390CPU architectures, selectx86-64for this tutorial. -
Select the Environment ActiveGate purpose.
-
Copy and run the
wgetcommand from the UI to download the installer.wget -O Dynatrace-ActiveGate-Linux-x86-1.313.24.sh "https://<domain>.live.dynatrace.com/api/v1/deployment/installer/gateway/unix/latest?arch=x86" --header="Authorization: Api-Token dt###.PDSWM########.4PQ5B6DNXFBFPCKDRQFVX#############"
-
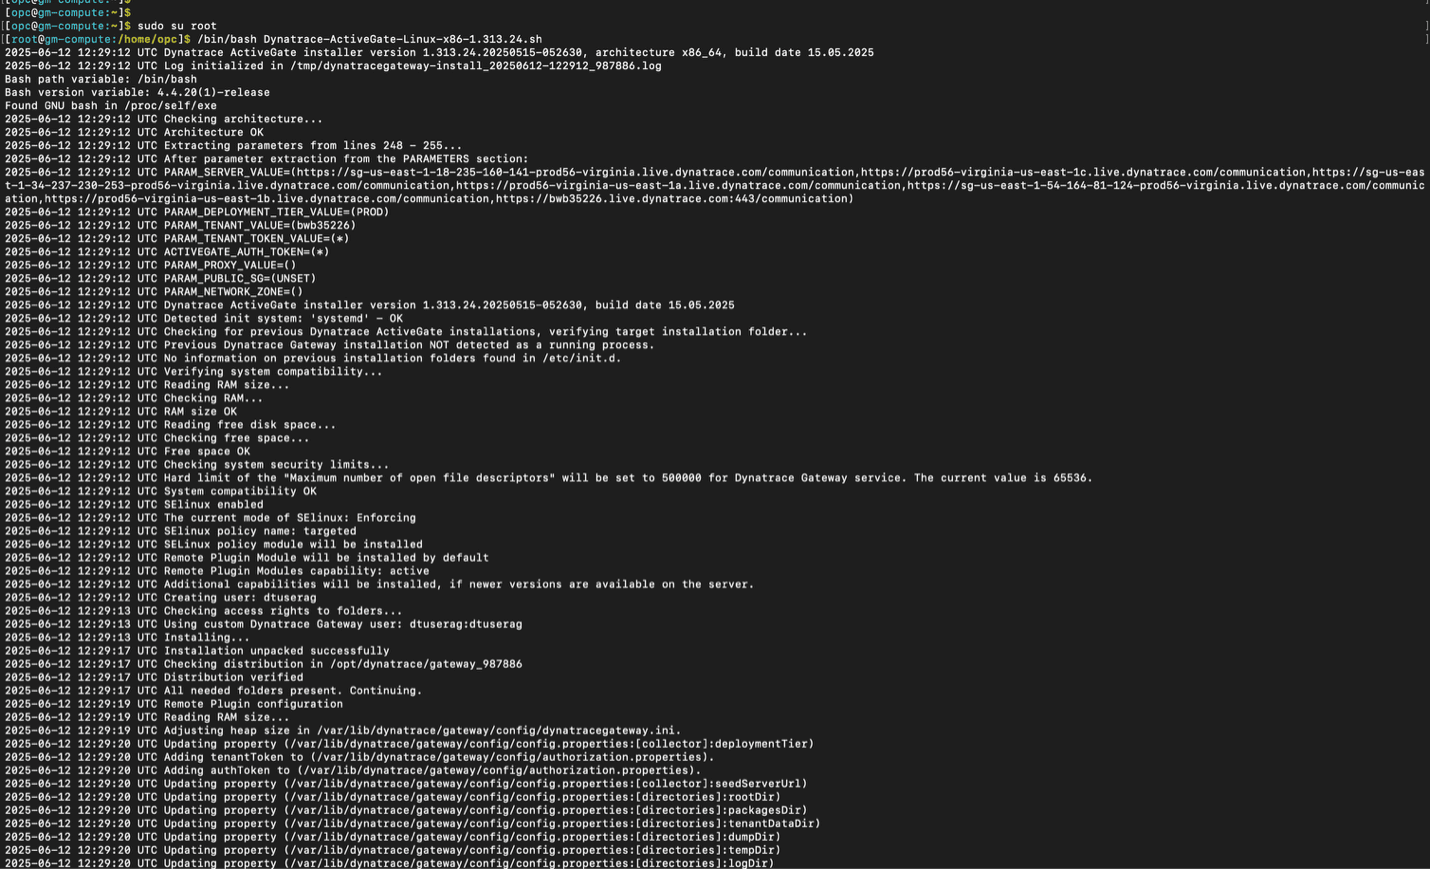
Wait for the download to complete. Then verify the signature by copying the command from the second verify signature text box and pasting the command into your terminal window.
wget https://ca.dynatrace.com/dt-root.cert.pem ; ( echo 'Content-Type: multipart/signed; protocol="application/x-pkcs7-signature"; micalg="sha-256"; boundary="--SIGNED-INSTALLER"'; echo ; echo ; echo '----SIGNED-INSTALLER' ; cat Dynatrace-ActiveGate-Linux-x86-1.313.24.sh ) | openssl cms -verify -CAfile dt-root.cert.pem > /dev/null
-
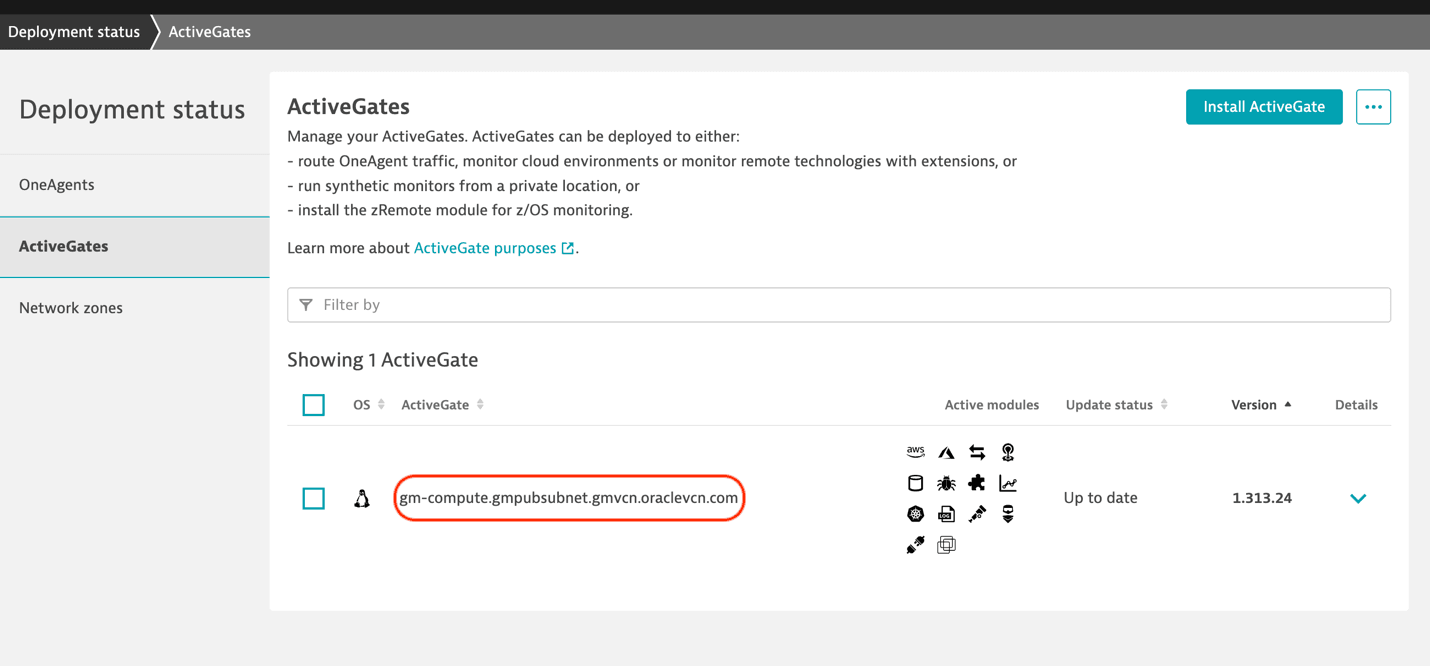
After successfully installing the Environment ActiveGate, confirm that it appears in the Dynatrace user interface for validation.
-
Task 2: Create a Dynatrace Identity and Access Management User in OCI
-
Log in to the OCI Console, navigate to Identity & Security, Domains, User Management and create a new user (
dynatrace-monitoring). For more information, see Creating a User. -
Create a group (
dynatrace-group) and add the user. For more information, see Creating a Group. -
Add the following OCI IAM policies.
Allow group <group name> to read metrics in compartment <compartment name>
Allow group <group name> to read buckets in compartment <compartment name>
Allow group <group name> to read objectstorage-namespaces in compartment <compartment name>
Allow group <group name> to inspect buckets in compartment <compartment name>
Allow group <group name> to inspect instances in compartment <compartment name>
Allow group <group name> to inspect load-balancers in compartment <compartment name>
Allow group <group name> to inspect vnic-attachments in compartment <compartment name>
Allow group <group name> to inspect objects in compartment <compartment name>
Allow group <group_name> to inspect alarms in tenancy
Note: These permissions allow Dynatrace to read necessary metrics and metadata from your OCI resources.
-
Add API keys for the newly created user. Open the user in the user management page. Navigate to API Keys and click Add API Key. Select Generate a new API key pair and click Add to copy the configuration file preview. We will use details later in the Dynatrace Console.
Task 3: Download and Configure the Dynatrace Extension
-
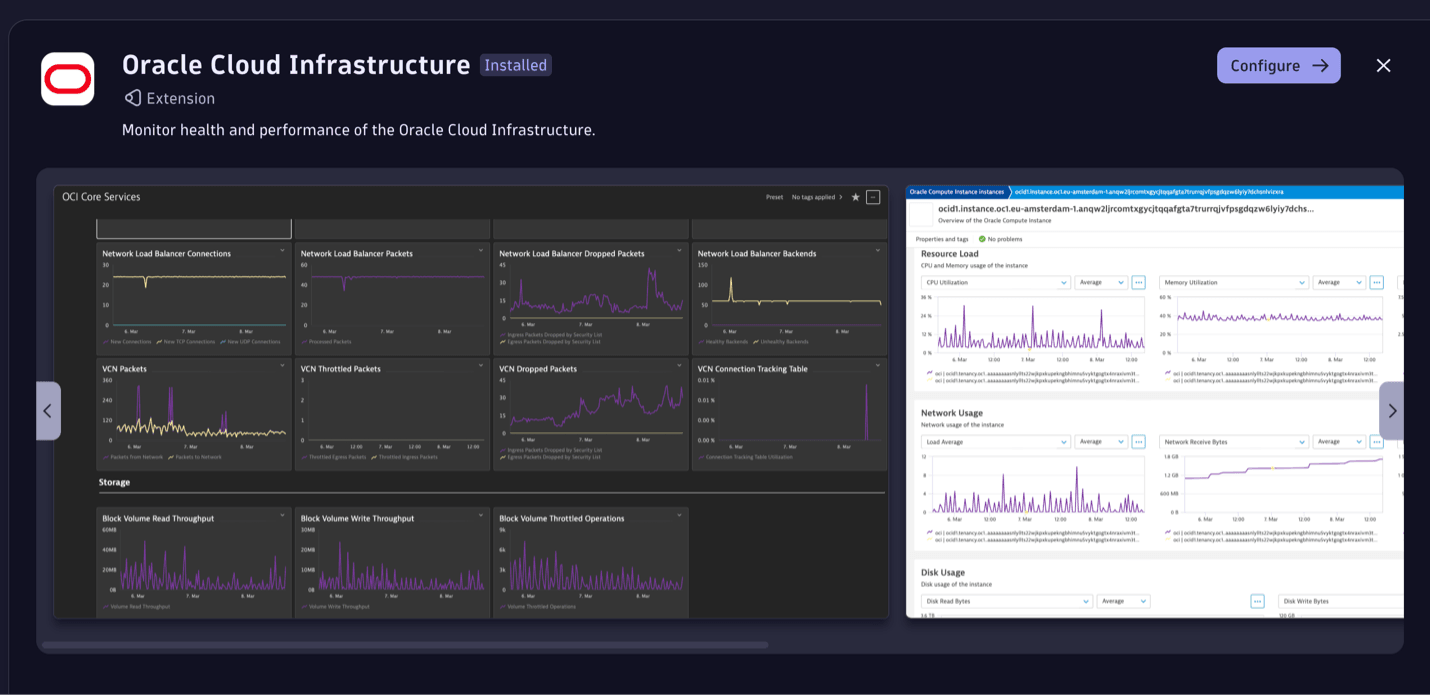
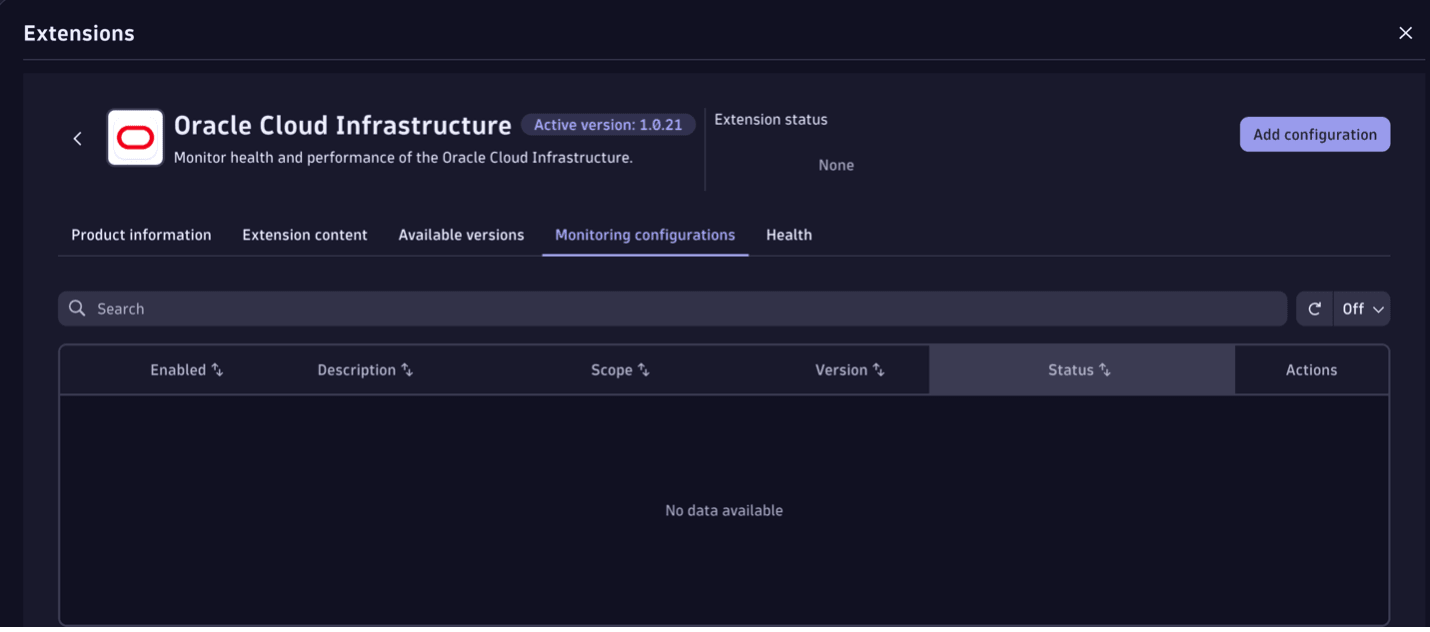
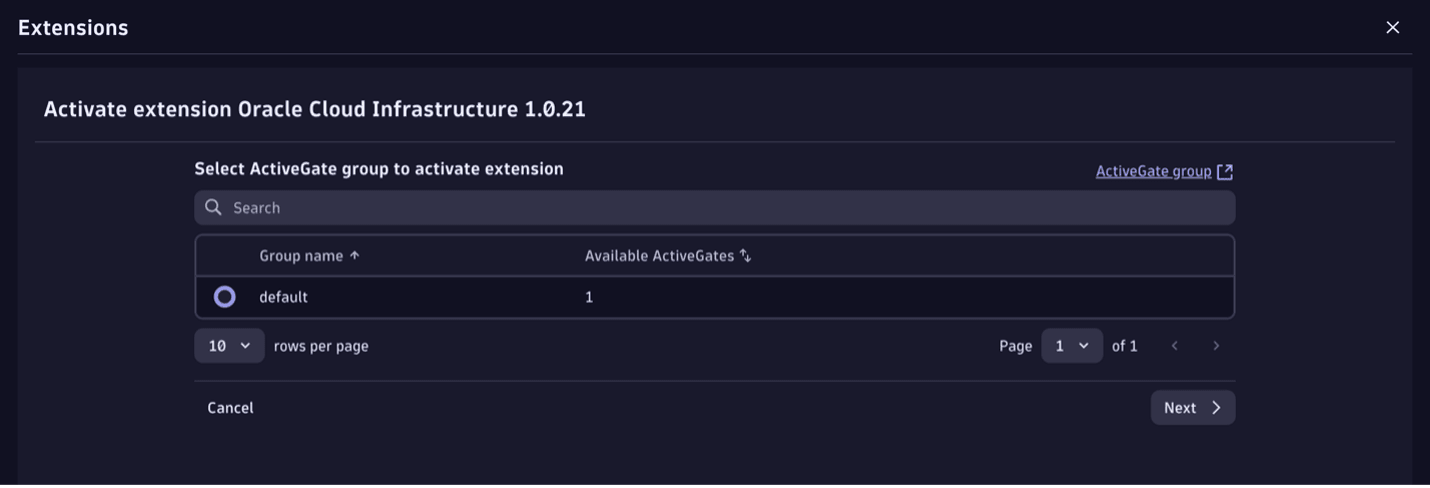
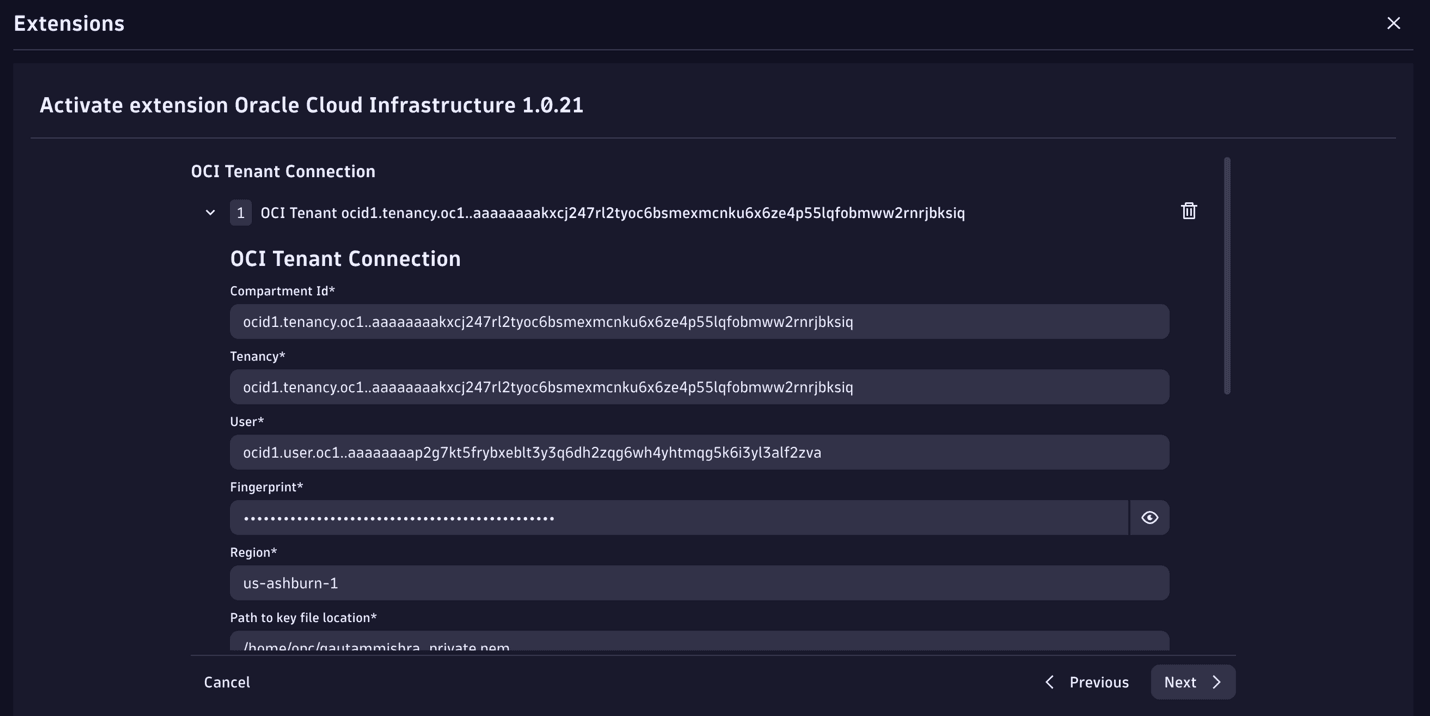
Go to the Dynatrace Hub Console, download the OCI Integration Extension 2.0 and click Configure to add OCI Monitoring configuration details.
-
Add a new configuration connection using details like OCI Tenancy OCID , Compartment Id, User OCID, Fingerprint, Region and Path to the private key file location.
-
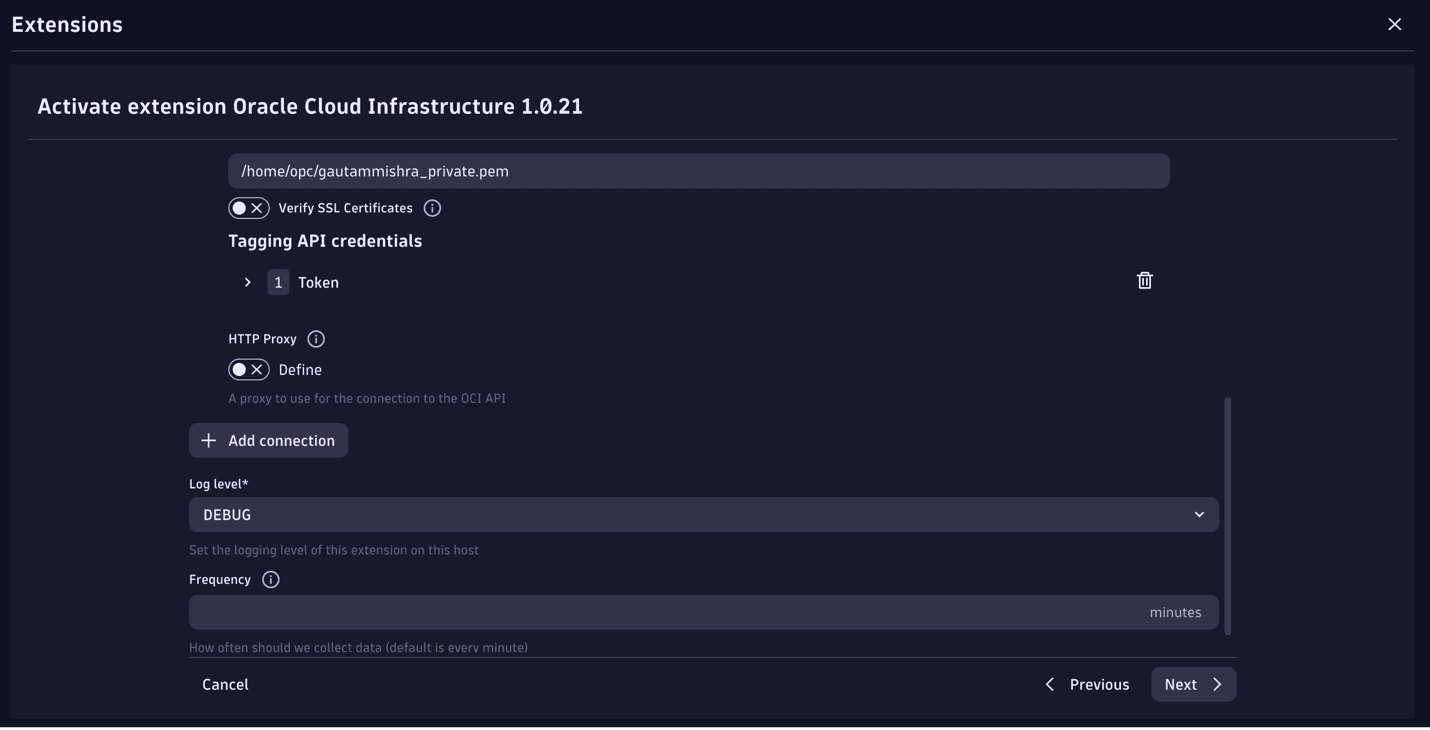
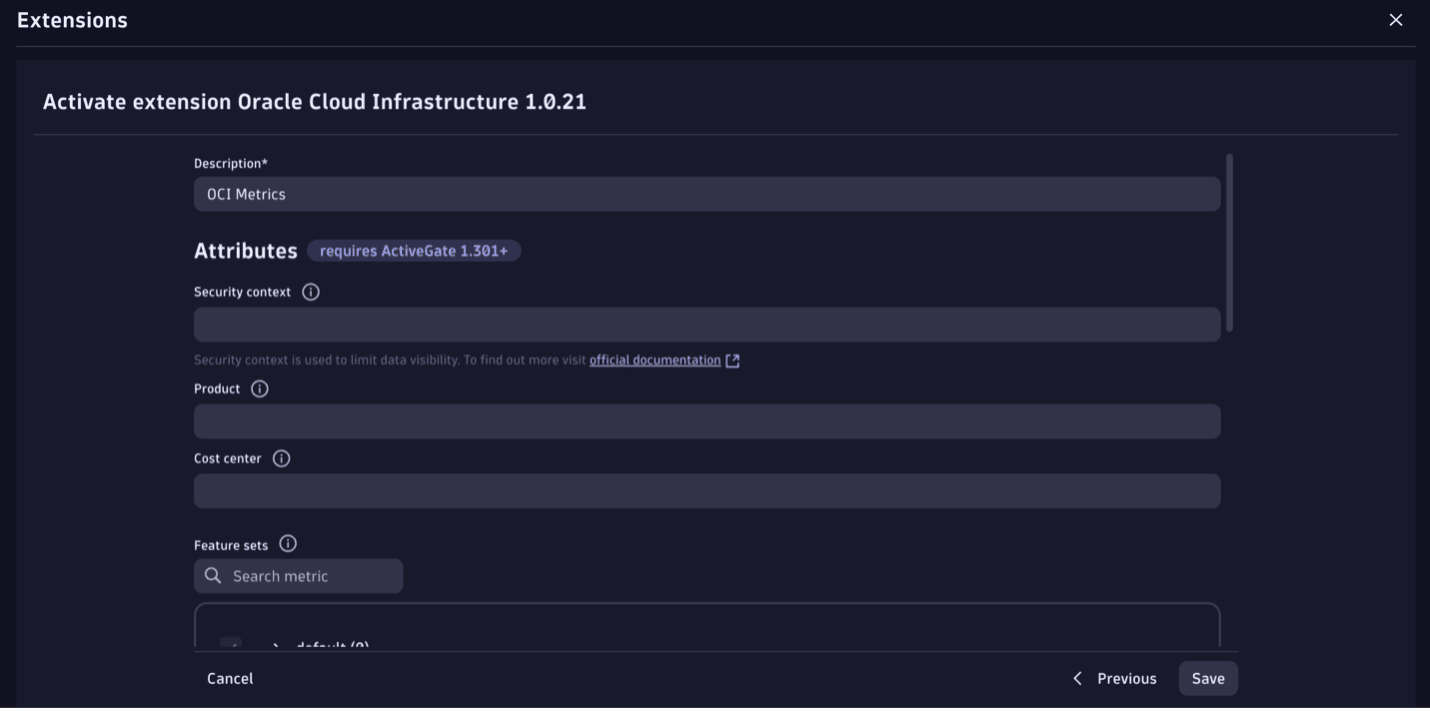
Keep the other fields as default. Enter an appropriate Description and keep the Log level as DEBUG.
-
Select all the recommended metrics which needs to be monitored and save it.
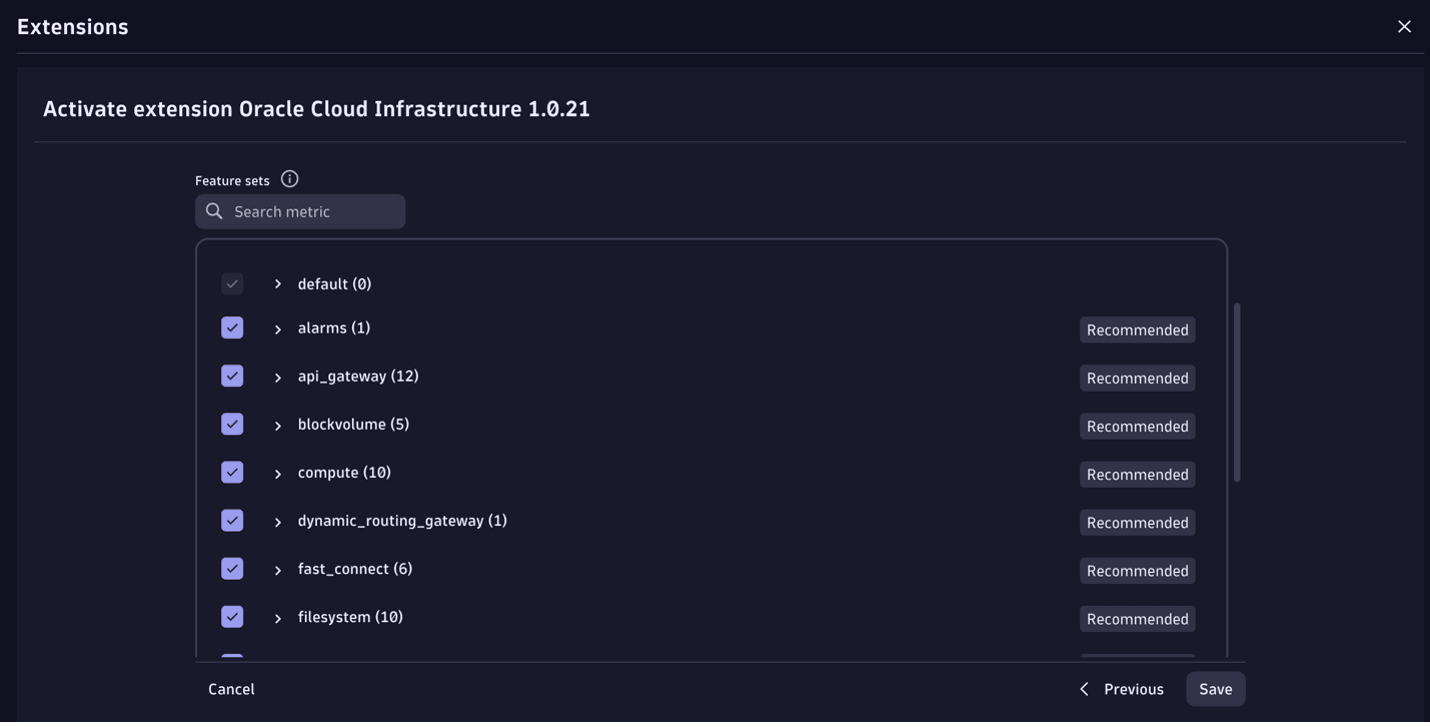

Note: This extension focuses on basic OCI services and does not look to monitor Oracle SaaS offerings like CX, HCM, ERP, SCM, EPM and alike.
Task 4: View Metrics and Create Dashboards
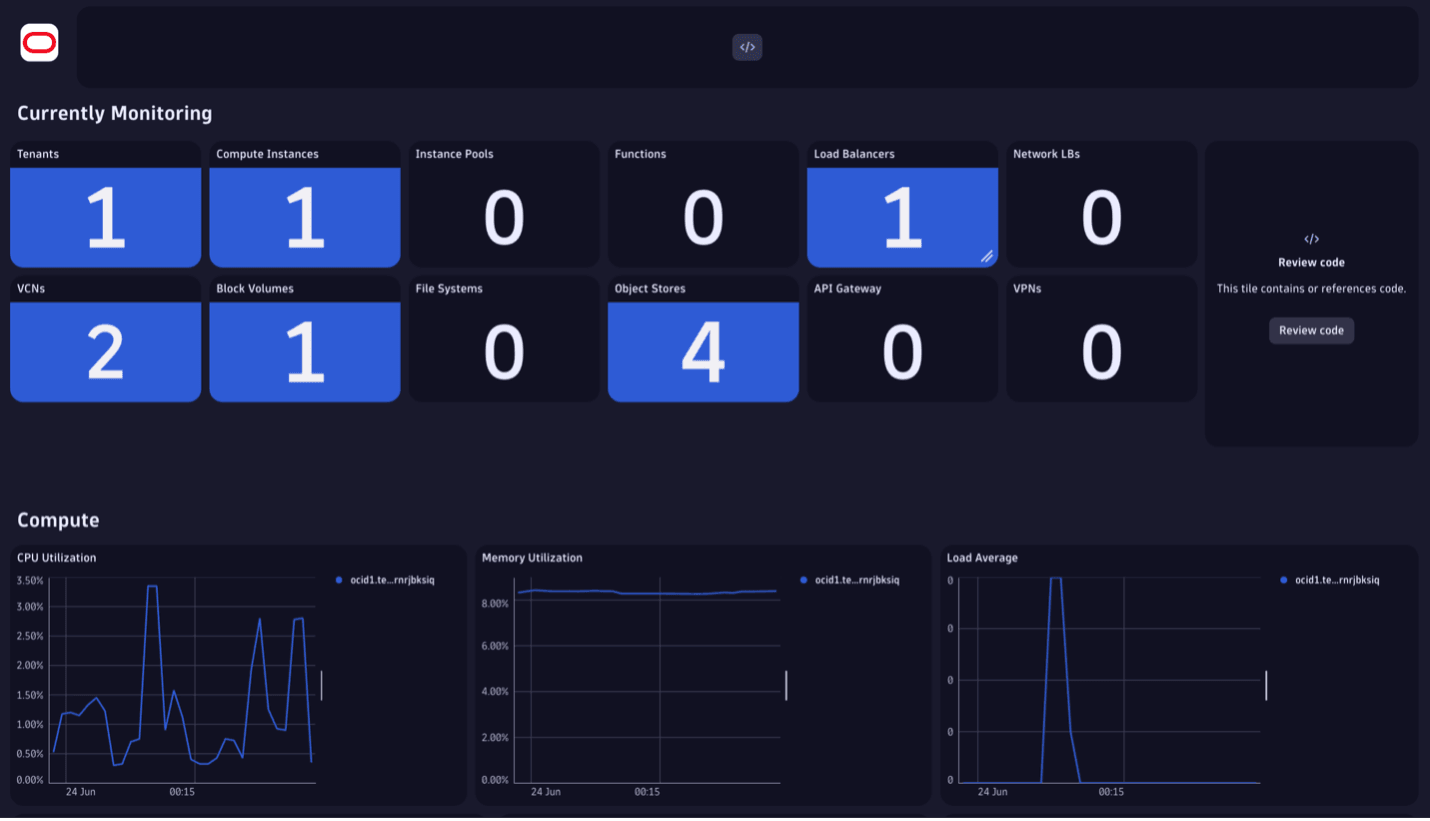
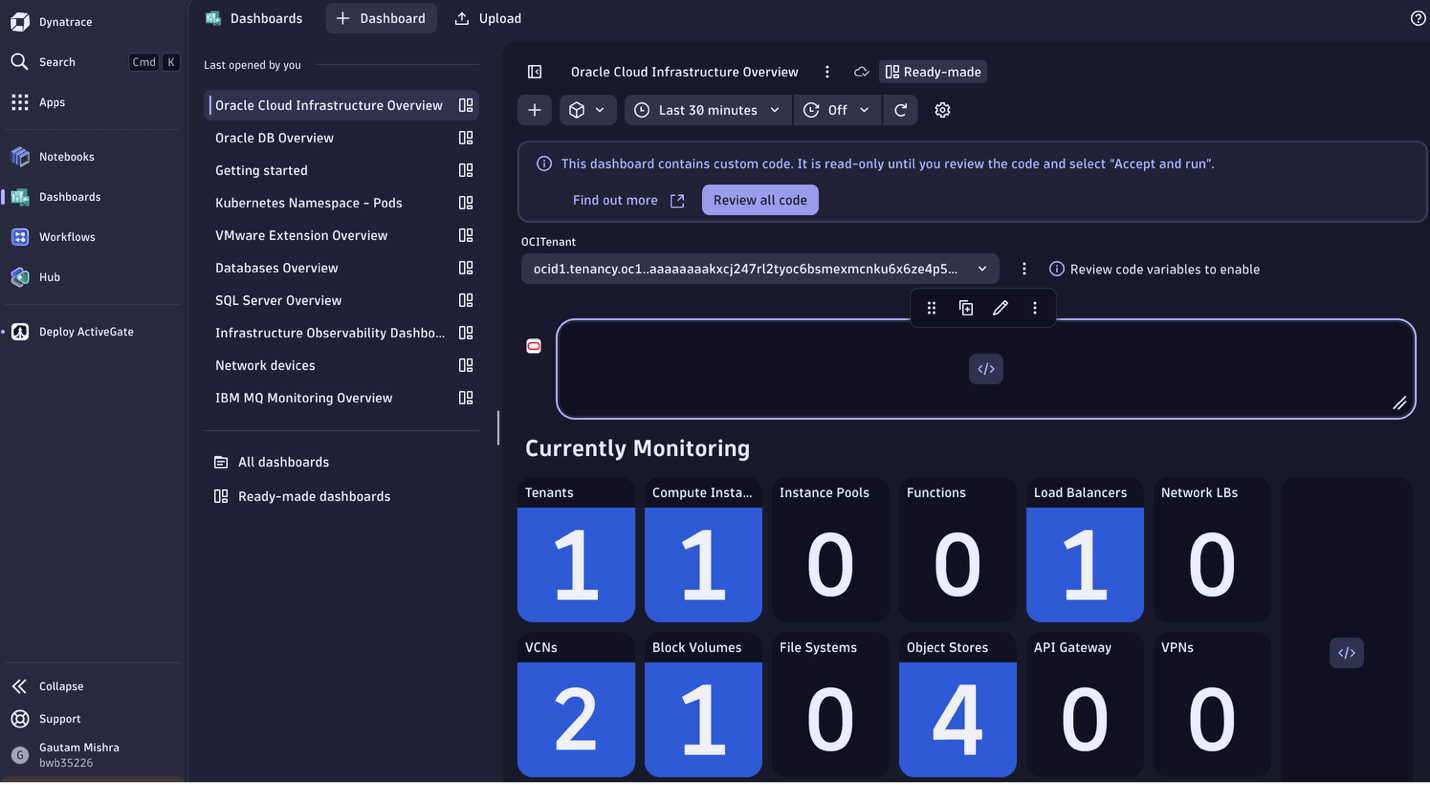
Once the extension is activated, data starts flowing into Dynatrace Smartscape and Dynatrace Auto-Discovery of resources begins. Dynatrace out-of-the-box (OOTB) dashboards gets created for views: Compute resource usage, Network throughput , Load balancer processed packets and so on. Navigate to Dashboards and OCI Overview to view the OOTB dashboard.
Note: Because the configuration requires the compartment Id and region, a new endpoint or monitoring configuration will need to be created to monitor a new region or compartment.
Related Links
Acknowledgments
- Author - Gautam Mishra (Principal Cloud Architect)
More Learning Resources
Explore other labs on docs.oracle.com/learn or access more free learning content on the Oracle Learning YouTube channel. Additionally, visit education.oracle.com/learning-explorer to become an Oracle Learning Explorer.
For product documentation, visit Oracle Help Center.
Monitor Oracle Cloud Infrastructure with Dynatrace
G38829-01
Copyright ©2025, Oracle and/or its affiliates.