Introduction
Fusion Applications Observability Overview
In a typical Fusion environment, it is essential to ensure that end user performance, availability, and reliability are taken care to maintain smooth business operations. Through OCI Application Performance Monitoring (APM), Fusion Apps can gain an in-depth understanding of user experience, API performance, integrations, and business processes.
Fusion Apps users rely on web-based UIs and Application performance monitoring helps to:
-
Track API response times, failures, and latency
-
Monitor third-party & internal API integrations
-
Track business transactions for delays and failures
-
Identify bottlenecks in approval flows and order processing
-
Use real-time alerts to detect anomalies early
-
Track transactions across Fusion SaaS, OCI, and on-prem systems by taking advantage of distributed tracing
-
Detects suspicious API activity and unauthorized access
-
Track user sessions, role changes, and security events
By utilizing APM Real User Monitoring, customers not only gain visibility of their Fusion Apps UI performance metrics, but they can also narrow down the area of the performance issue when troubleshooting with the Oracle Support. At the same time, Log Analytics, another Observability and Management service, can be used in Audit monitoring of the Fusion Apps.
For enterprises, Oracle Fusion SaaS applications are mission critical. The ability to monitor, analyze, and troubleshoot application behavior in real-time is vital for ensuring performance, reliability, and security. Since Fusion SaaS is fully managed by Oracle, direct access to system logs and infrastructure metrics is limited, making Observability and Management even more important in order to:
-
Ensure business continuity by proactively detecting and resolving issues
-
Improve performance by monitoring API response times, UI, and integration
-
Enhance security and compliance by tracking user activity, audit logs, and unauthorized actions
-
Optimize integrations by monitoring Oracle Integration Cloud and third-party connections
Oracle Fusion Cloud customers want to have observability and monitoring capabilities in order to have insights and be able to rule out performance issues caused by network, firewall, or even the issues from the browser version along with the auditing capability and monitoring the user activity for all the components of the Fusion Cloud. To monitor these, we can use Log Analytics and Application Performance Monitoring services of the Observability and Management platform.
OCI Log Analytics
OCI Log Analytics (LA) provides powerful exploration and analysis capabilities, enabling users to efficiently monitor and troubleshoot logs. It ingests, indexes, and analyzes logs from various components, helping users:-
Detect patterns and anomalies in log data
-
Correlate logs across multiple services for faster troubleshooting
-
Perform advanced searches and visualizations using a rich query language
-
Set up alerts and automated responses based on log insights
OCI Application Performance Monitoring
APM Real User Monitoring provides an understanding of the real user experience by doing the following:-
Record user interaction with websites and sends browser spans and Real User Monitoring metrics to Application Performance Monitoring
-
Provide an insight into the experience of the real user directly from the browser
-
Identify performance degradation by closely watching various aspects of an application such as page loads, page performance, and application performance index (Apdex), script errors, and AJAX calls
Benefits of Observability for Fusion Applications
-
Detect issues before they impact users
-
Get real-time alerts on performance bottlenecks, integration failures, or data load delays
-
Predict outages or anomalies
-
Meet compliance standards with audit logging and traceability
-
Optimize usage of OCI infrastructure behind Fusion Apps
Implementation Steps
Task 1: Configure Log Analytics
Prerequisites- Understand Fusion Apps Audit Logs APIs. Refer to the Fusion Applications REST API documentation for details on how to retrieve audit trail data. The API Documentation covers functionality and usage details.
- Ensure that Audit Trail API access is enabled and the required roles/privileges are assigned.
- You must have the Endpoints values identified for the properties: login_url and pod_url from the Fusion Applications instance.
- Create an entity and confirm the entity has the following properties:
- login_url: The base URL of your Fusion Applications instance
-
pod_url: The base URL of your Fusion Applications instance
- Add Credentials on the host where Management Agent is installed. Upsert HTTPSBasicAuthCreds type credentials with the correct username and password.
{ "source": "lacollector.la_rest_api", "name": "FA-CREDS", "type": "HTTPSBasicAuthCreds", "description": "These are HTTPS (BasicAuth) credentials.", "properties": [ { "name": "HTTPSUserName", "value": "*******" }, { "name": "HTTPSPassword", "value": "*******” } ] } - Restart the Management Agent after credential upsert.
- Configure out-of-the-box sources, and associate the source with the entity to schedule data collection. This uses Management Agent to periodically invoke the Fusion Audit APIs and to push data to Log Analytics.
Description of the illustration create_source.png
- Review and validate on Log Explorer.
- Verify that the logs are being collected and analyzed properly in OCI Log Analytics.
Description of the illustration log_explorer.png
- To set up custom sources for other Fusion Apps products that are not part of Oracle defined sources, follow the steps here. Once all the logs are collected, you can use this information for audit analysis and create an overview dashboard for high-level monitoring.

Description of the illustration overview_dashboard.png - The serviceName and WebApplication can be changed to any (non-empty) desired value. Once done, save your changes.

Task 2: Deploy the Application Performance Monitoring Browser Agent
You can deploy the APM browser agent by inserting a JavaScript in all your application pages and allowing Application Performance Monitoring to report on real user experience. For a generic UI page, see steps in Deploy the APM Browser Agent With Your Application.
In this section, learn how to apply the apmrum deployment steps in the context of a Fusion Application. The Fusion Application consists of Redwood and ADF pages:
- The redwood pages have the keyword
/redwood/in the url. - The adf pages have the keyword
/faces/in the url.
The fusion environment likely consists of a mixuture of ADF and Redwood pages. You might have to click around to identify a page that can be used as a starting point for the configuration steps mentioned in the sections below.
Deploy to Fusion Applications ADF Pages
Deploy the APM browser agent to Fusion Applications ADF pages by editing the global page template. This will ensure the agent monitors all pages. Follow these steps to add the required JavaScript snippet:- Create a sandbox and select the Page Template Composer tool.
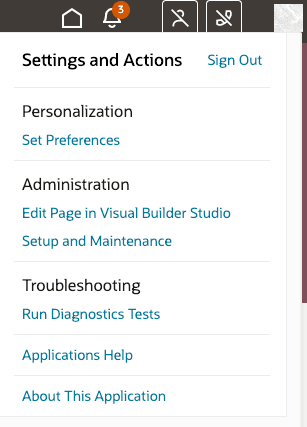
- Go to Settings and Actions, and under Administration, select Edit Global Page Template.
- Make sure the top left logo title in the black ribbon is selected (marked in blue).

Description of the illustration oracle_logo.png - From the Add Content menu, select HTML Markup.
 Description of the illustration html_markup.png
 - Open the Expression as shown in the below screenshots:

Description of the illustration expression.png
Description of the illustration expression_builder.png
Description of the illustration expression_builder_code.png - Paste the below script in the expression builder:
<script type="text/javascript" crossorigin="anonymous" src="https://static.oracle.com/cdn/apm/oci/1.1/1.1-1xx/1.1-139/apmrum.fus.base.combi.min.js"></script> <script type="text/javascript"> function initializeAPMRumConf() { const apmRumConfig = document.apmrum || window.apmrum || (document.apmrum = {}); apmRumConfig.custEP = apmRumConfig.custEP || {}; /* CUSTOMER SPECIFIC VALUES */ apmRumConfig.custEP.OracleAPMPublicDataKey = 'XXX'; apmRumConfig.custEP.ociDataUploadEndpoint = 'https://XXX.apm-agt.us-phoenix-1.oci.oraclecloud.com'; apmRumConfig.custEP.serviceName = 'Fusion'; apmRumConfig.custEP.webApplication = 'ADF-Page'; apmRumConfig.traceSupportingEndpoints = apmRumConfig.traceSupportingEndpoints || [ { headers: [], hostPattern: '.*' } ]; /* Uncomment the line below to get username values in plain text (by default the value will be hashed) */ // apmRumConfig.custEP.trackPlainUserId = true; /* END OF CUSTOMER SPECIFIC SETTINGS */ apmRumConfig.confInst = (apmRumConfig.confInst || new Set()).add('custEP'); } initializeAPMRumConf(); </script> - Replace the <APM data upload Endpoint> and <APM public data key> with the relevant APM domain parameters. For instructions, see Obtain Data Upload Endpoint and Data Keys in Application Performance Monitoring.
- The serviceName and WebApplication can be changed to any (non-empty) desired value.
- Next, save your changes.
 Description of the illustration expression_builder_save.png


Deploy to Fusion Applications Redwood Pages
- Create a (git) repository, or check if it exists already:
Go to Settings and Actions, and under Administration, click Edit Page in Visual Builder Studio. Check if the repository exists already. If the repository exists, then go to the project. If the repository doen't exist, when this link is clicked for the first time, a process is triggered that creates a (git)repository to preserve the code changes for the 'Oracle Application' or 'App Extension project'.
 Description of the illustration repo_access.png
- Workflow to create the project for the first time:
After triggering the creation of the project, the system automatically iterates through the creation flow. This is a one time activity, after this the project is created, and can be used directly.
- Update the extension:
The project (git repository) shows the page template when it is opened. The view also displays a unified module section that can be edited. This is the relevant area, since it will allow a single change to be applied to a larger area of the Fusion Application (not only the starting page). The change is intended for the area called PageModule.
The default PageModule template likely populates it similar to the following and is intended to define the basic logic:
define([], () => {
  'use strict';

  class PageModule {
  }

  return PageModule;
});
Below is the sample code to configure apmrum and initialize the apmrum library by updating the apmrum code with the above logic:
define([], () => {
  'use strict';

  function initializeAPMRumConf() {
      // eslint-disable-next-line no-restricted-syntax
      const apmRumConfig = document.apmrum || window.apmrum || (document.apmrum = {});

      apmRumConfig.custEP = apmRumConfig.custEP || {};

      /* CUSTOMER SPECIFIC VALUES */
      apmRumConfig.custEP.OracleAPMPublicDataKey = 'XXX';
      apmRumConfig.custEP.ociDataUploadEndpoint = 'https://XXX.apm-agt.us-phoenix-1.oci.oraclecloud.com';
      apmRumConfig.custEP.serviceName = 'Fusion';
      apmRumConfig.custEP.webApplication = 'RedwoodPage';

      apmRumConfig.traceSupportingEndpoints = apmRumConfig.traceSupportingEndpoints || [
        { headers: [], hostPattern: '.*' }
      ];

      // Uncomment the line below to get username values in plain text (by default the value will be hashed)
      // apmRumConfig.custEP.trackPlainUserId = true;

      /* END OF CUSTOMER SPECIFIC SETTINGS */

      apmRumConfig.confInst = (apmRumConfig.confInst || new Set()).add('custEP');

  }

  function initializeAPMRumLib() {
      const apmRumScript = document.createElement("script");
      apmRumScript.crossOrigin = 'anonymous';
      apmRumScript.type = "text/javascript";
      /* use one location for apmrum library
       * static.oracle.com requires maintenance (to update the version) the region specific script might need update to
       * content-security-policy header to ensure the script-src tag allows the location
       */
      apmRumScript.src = "https://static.oracle.com/cdn/apm/oci/1.1/1.1-1xx/1.1-139/apmrum.fus.base.combi.min.js";
      /* the example below uses eu-paris-1 as region, it is recommended to choose the location that matches the region where the
       * target apm domain is hosted.
       *   apmRumScript.src = "https://ingest-rum.apm-agt.eu-paris-1.oci.oraclecloud.com/static/jslib/apmrum.fus.base.combi.min.js";
       */

      document.head.appendChild(apmRumScript);
  }


  class PageModule {
    constructor() {
      initializeAPMRumLib();
      initializeAPMRumConf();
    }
  }

  return PageModule;
});
Set Content-Security-Policy Header
The browser uses the CSP standard to enhance security. The use of apmrum library from either static.oracle.com OR the region specific ingest-rum.apm-agt.<region>.oci.oraclecloud.com means that the script needs to be added to the list of locations where code is allowed to be loaded from, that is, ALLOWED_ORIGINS parameter. This requires configuration of ADF as documented in the following locations:
- ADF Faces Configuration
- Content Security Policy (CSP) Error Correction
Note that in both the above examples, the value of the parameter ALLOWED_ORIGINS is set to the domain.
Configure APM Domain Admin Enrichment Rule
For complete coverage of Fusion Applications, it is important to also enable the enrichment rules that add additional dimensions and apply mapping on relevant locations.
This can be done by creating an Oracle provided span rule and adding the FUS rule. For steps, see Span Enrichment.
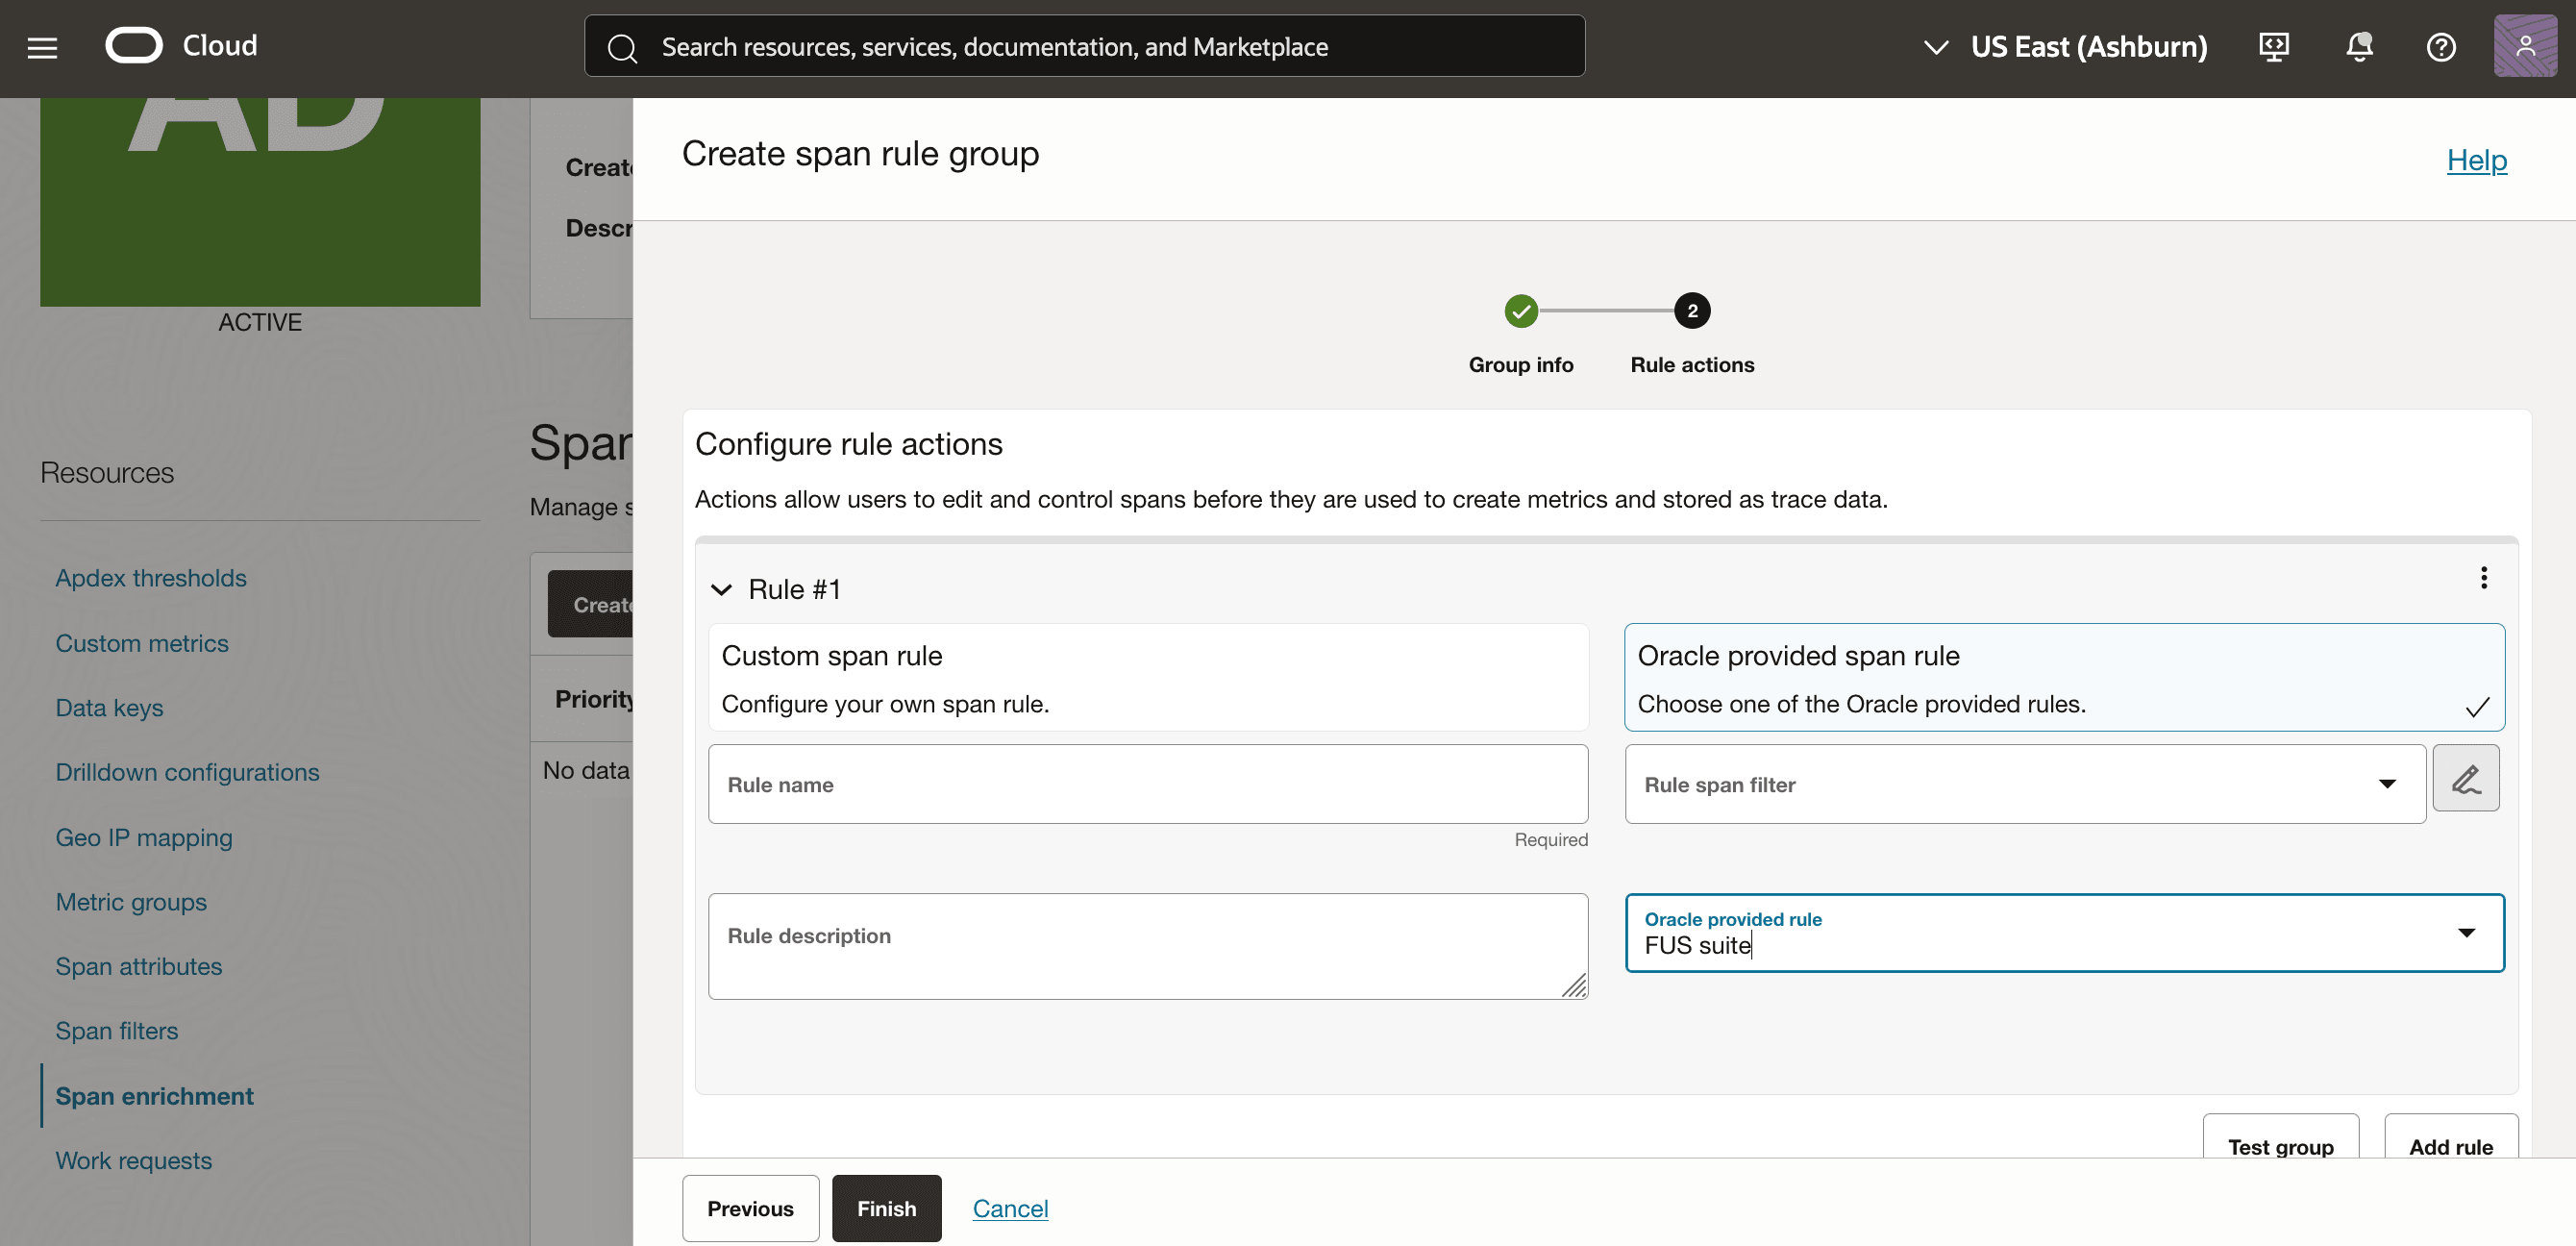
Description of the illustration APM_domain_enrichment_rule.png
The Rule creates RwApplication, RwPath, and RwContainer attributes, in addition to FusFamily to describe the area where Fusion activity takes place.
Task 3: Verify Application Performance Monitoring Browser Agent Deployment
- To generate some monitoring data, use the application you are setting up the monitoring for.
- Go to the APM Trace explorer page to see the data loaded. For example, see APM screenshots below.
- The user-name dimension is collected and hashed by default. If you want to have the user name in plain text, uncomment the relevant line in the example code:
apmRumConfig.custEP.trackPlainUserId = true; - If needed, verify that the APM data upload url (window.apmrum.ociDataUploadEndpoint) is reachable by doing the following:
- Go to your application and use the Developer Tools in your browser to go to the Developer console. In most browsers, you can start the Developer Console by pressing the F12 key.
- Select the Network tab and filter the URL list by observations/public-span, if required.
- The Collector URL should be displayed with the 200 or 204 HTTP response code. If you do not see a 200 or 204 HTTP response code, then the browser is not able to access the Collector URL.
To verify the complete setup end-to-end, you can check if relevant data is showing up in the trace explorer. This ensures that the data flows through and is captured.
The data in redwood pages is reported different from ADF pages and the validation is best done separately.


Use cases
-
Log Correlation Across Tiers
-
Business Process Observability
-
Application Performance Troubleshooting
-
Audit and Compliance Tracking
Next steps
Observability & Management for Fusion Apps is very critical for an organization to ensure that users have a smooth and efficient experience by identifying and addressing performance issues before they impact end-users. To get the maximum value of Fusion Apps, set up Log Analytics and Application Performance Monitoring today. Access Log Analytics and APM through the Observability and Management menu in the Oracle Cloud Infrastructure Console. The service is accessible through the Console, CLI, and REST API. These services are available in all OCI commercial regions. For more details and availability in US and other government regions, please check the OCI service availability page. Not yet a customer? Sign up for an Oracle Cloud Infrastructure free trial account!
-
Leverage OCI’s Observability & Monitoring ecosystem
-
Set up alerts for metrics that are emitted by the various O&M services.
-
Create custom dashboards with trace, log, and metric data.
-
Enable Weekly News Reports in Ops Insights
Related Links
Documentation
Blog
Acknowledgements
- Primary Author: Jayaprakash Subramanian
- Contributors: Avi Huber, Kumar Varun, Shivam Shishodia, Shaickmohamed Sirajudeen
More Learning Resources
Explore other solutions on Oracle Learn or access more free learning content on the Oracle Learning YouTube channel. Additionally, visit Oracle Education to become an Oracle Learning Explorer.
For product documentation, visit Oracle Help Center.
Observability and Management Solution: Oracle Fusion Applications and OCI Observability Services
G33041-03
February 2026
Copyright © 2026 Oracle and/or its affiliates.