Note:
- This tutorial is available in an Oracle-provided free lab environment.
- It uses example values for Oracle Cloud Infrastructure credentials, tenancy, and compartments. When completing your lab, substitute these values with ones specific to your cloud environment.
Work With Performance Co-Pilot on Oracle Linux
Introduction
Performance Co-Pilot (PCP) collects OS and network metrics that you can use to diagnose performance issues. PCP is a distributed architecture with collector hosts and monitor hosts.
-
PCP refers to the monitored hosts as collector hosts. These hosts require a Performance Metrics Domain Agent (PMDA), which is responsible for collecting performance measurements. The Performance Metrics Collector Daemon or
pmcdcontrols all PMDAs on the same hosts. -
PCP monitor hosts display data collected from hosts, or archives, that have the PCP collector installed. The core PCP package includes many monitor tools.
Objectives
In this tutorial, you will learn:
- Configure one Oracle Linux host as a PCP collector and monitor
- Use PCP monitoring tools on a single host
- Configure remote monitoring of a second Oracle Linux host
- Monitor performance with pmchart GUI
Prerequisites
- Two (2) Oracle Linux 9 systems
Deploy Oracle Linux
Note: If running in your own tenancy, read the linux-virt-labs GitHub project README.md and complete the prerequisites before deploying the lab environment.
-
Open a terminal on the Luna Desktop.
-
Clone the
linux-virt-labsGitHub project.git clone https://github.com/oracle-devrel/linux-virt-labs.git -
Change into the working directory.
cd linux-virt-labs/ol -
Install the required collections.
ansible-galaxy collection install -r requirements.yml -
Update the Oracle Linux instance configuration.
cat << EOF | tee instances.yml > /dev/null compute_instances: 1: instance_name: "ol-node-01" type: "server" 2: instance_name: "ol-node-02" type: "server" passwordless_ssh: true update_all: true use_vnc: true use_pcp: true EOF -
Deploy the lab environment.
ansible-playbook create_instance.yml -e localhost_python_interpreter="/usr/bin/python3.6" -e "@instances.yml" -e os_version="9"The free lab environment requires the extra variable
local_python_interpreter, which setsansible_python_interpreterfor plays running on localhost. This variable is needed because the environment installs the RPM package for the Oracle Cloud Infrastructure SDK for Python, located under the python3.6 modules.The default deployment shape uses the AMD CPU and Oracle Linux 8. To use an Intel CPU or Oracle Linux 9, add
-e instance_shape="VM.Standard3.Flex"or-e os_version="9"to the deployment command.Important: Wait for the playbook to run successfully and reach the pause task. At this stage of the playbook, the installation of Oracle Linux is complete, and the instances are ready. Take note of the previous play, which prints the public and private IP addresses of the nodes it deploys and any other deployment information needed while running the lab.
Setup the PCP Environment
-
Open a terminal and connect via SSH to the ol-node-01 instance.
ssh oracle@<ip_address_of_ol-node-01> -
Install the
pcp,pcp-system-tools, andpcp-guipackages.sudo dnf install pcp pcp-system-tools pcp-gui -yWhere:
- The
pcppackage provides the essential PCP tools and services for collecting performance data. - The
pcp-system-toolsandpcp-guipackages are optionally installed on the monitoring host to extend the set of monitoring tools from the basepcppackage.
- The
-
Enable and start the Performance Metrics Collector Daemon (
pmcd) and the Performance Metrics Logger (pmlogger) collector host services.sudo systemctl enable --now pmcd pmlogger
Use PCP Monitoring on a Single Host
-
Run the
pcputility.sudo pcpThe default output summarizes the PCP installation on the local host.
Example Output:
[oracle@ol-node-01 ~]$ sudo pcp Performance Co-Pilot configuration on ol-node-01: platform: Linux ol-node-01 5.15.0-305.176.4.el9uek.x86_64 #2 SMP Tue Jan 28 20:15:04 PST 2025 x86_64 hardware: 4 cpus, 1 disk, 1 node, 31636MB RAM timezone: GMT services: pmcd pmcd: Version 6.2.2-7, 12 agents, 6 clients pmda: root pmcd proc pmproxy xfs linux nfsclient mmv kvm jbd2 dm openmetrics pmlogger: primary logger: /var/oled/pcp/pmlogger/ol-node-01/20250214.10.51 pmie: primary engine: /var/oled/pcp/pmie/ol-node-01/pmie.log -
Summarize the amount of free and used physical memory.
sudo pcp freeExample Output:
[oracle@ol-node-01 ~]$ sudo pcp free
               total        used        free      shared  buff/cache   available
Mem:        32592652     1357328    23443732       27712     7791592    30732656
Swap         6291452           0     6291452
Where:
- The free parameter invokes the
pcp-freeexecutable in the/usr/libexec/pcp/bin/directory.
- The free parameter invokes the
-
List all the available
pcp-commands available.sudo ls /usr/libexec/pcp/bin/pcp-*Example Output:
[oracle@ol-node-01 ~]$ sudo ls /usr/libexec/pcp/bin/pcp-* /usr/libexec/pcp/bin/pcp-atop /usr/libexec/pcp/bin/pcp-numastat /usr/libexec/pcp/bin/pcp-atopsar /usr/libexec/pcp/bin/pcp-pidstat /usr/libexec/pcp/bin/pcp-buddyinfo /usr/libexec/pcp/bin/pcp-ps /usr/libexec/pcp/bin/pcp-check /usr/libexec/pcp/bin/pcp-python /usr/libexec/pcp/bin/pcp-dmcache /usr/libexec/pcp/bin/pcp-reboot-init /usr/libexec/pcp/bin/pcp-dstat /usr/libexec/pcp/bin/pcp-shping /usr/libexec/pcp/bin/pcp-free /usr/libexec/pcp/bin/pcp-slabinfo /usr/libexec/pcp/bin/pcp-htop /usr/libexec/pcp/bin/pcp-ss /usr/libexec/pcp/bin/pcp-iostat /usr/libexec/pcp/bin/pcp-summary /usr/libexec/pcp/bin/pcp-ipcs /usr/libexec/pcp/bin/pcp-tapestat /usr/libexec/pcp/bin/pcp-lvmcache /usr/libexec/pcp/bin/pcp-uptime /usr/libexec/pcp/bin/pcp-meminfo /usr/libexec/pcp/bin/pcp-verify /usr/libexec/pcp/bin/pcp-mpstat /usr/libexec/pcp/bin/pcp-vmstat /usr/libexec/pcp/bin/pcp-netstat /usr/libexec/pcp/bin/pcp-zoneinfo -
View detailed performance metrics focussing on the per-process utilization.
sudo pcp atopNote: Press
qto exit. -
View the PCP Advanced System Activity Report.
sudo pcp atopsar -
View the memory fragmentation report.
sudo pcp buddyinfo -
View system resource statistics.
sudo pcp dstat -
View all the files in the
/usr/libexec/pcp/bin/directory.ls /usr/libexec/pcp/binExample Output:
oracle@ol-node-01 ~]$ ls /usr/libexec/pcp/bin
chkhelp        pcp-netstat      pmfind_check           pmlogger_rewrite
discover       pcp-numastat     pmgetopt               pmlogredact
find-filter    pcp-pidstat      pmhostname             pmlogreduce
indomcachectl  pcp-ps           pmie_check             pmlogrewrite
install-sh     pcp-python       pmie_daily             pmnewlog
mkaf           pcp-reboot-init  pmie_dump_stats        pmnsadd
newhelp        pcp-shping       pmie_email             pmnsdel
pcp-atop       pcp-slabinfo     pmie_farm              pmnsmerge
pcp-atopsar    pcp-ss           pmiestatus             pmpause
pcp-buddyinfo  pcp-summary      pmie_webhook           pmpost
pcp-check      pcp-tapestat     pmlock                 pmproxy
pcp-dmcache    pcp-uptime       pmlogconf              pmsignal
pcp-dstat      pcp-verify       pmlogextract           pmsleep
pcp-free       pcp-vmstat       pmlogger               pmsnap
pcp-htop       pcp-zoneinfo     pmlogger_check         pmwtf
pcp-iostat     pmcd             pmlogger_daily         runaspcp
pcp-ipcs       pmcd_wait        pmlogger_daily_report  telnet-probe
pcp-lvmcache   pmcheck          pmlogger_farm
pcp-meminfo    pmconfig         pmlogger_janitor
pcp-mpstat     pmcpp            pmlogger_merge
There is a manual page for most of these commands that describes their usage, purpose, and options.
Use PCP Monitoring Tools on a Single Host
The pcp package installs many performance monitoring utilities in the /usr/bin directory.
-
View all the performance monitoring tools installed by the PCP package.
rpm -ql pcp | grep /usr/binExample Output:
[oracle@ol-node-01 ~]$ rpm -ql pcp | grep /usr/bin /usr/bin/dbpmda /usr/bin/pcp /usr/bin/pmafm /usr/bin/pmdate /usr/bin/pmdiff /usr/bin/pmdumplog /usr/bin/pmevent /usr/bin/pmfind /usr/bin/pmgenmap /usr/bin/pmie /usr/bin/pmie2col /usr/bin/pmieconf /usr/bin/pmiectl /usr/bin/pminfo /usr/bin/pmjson /usr/bin/pmlc /usr/bin/pmlogcheck /usr/bin/pmlogconf /usr/bin/pmlogctl /usr/bin/pmlogdump /usr/bin/pmlogextract /usr/bin/pmlogger /usr/bin/pmloglabel /usr/bin/pmlogmv /usr/bin/pmlogpaste /usr/bin/pmlogredact /usr/bin/pmlogreduce /usr/bin/pmlogrewrite /usr/bin/pmlogsize /usr/bin/pmlogsummary /usr/bin/pmprobe /usr/bin/pmpython /usr/bin/pmrepconf /usr/bin/pmsearch /usr/bin/pmseries /usr/bin/pmsocks /usr/bin/pmstat /usr/bin/pmstore /usr/bin/pmtrace /usr/bin/pmval -
List all the available performance metrics with a short description of their purpose.
pminfo -tExample Output:
[oracle@ol-node-01 ~]$ pminfo -t jbd2.njournals [Count of active JBD2 (Journal Block Device v2) devices] jbd2.transaction.count [Total transactions committed per journal] jbd2.transaction.requested [Total journal transactions requested per journal] jbd2.transaction.max_blocks [Maximum transaction blocks (buffers) per journal] jbd2.transaction.total.blocks [Total transaction blocks per journal] jbd2.transaction.total.blocks_logged [Total logged blocks per journal] ... proc.psinfo.age [time in seconds since process was started] proc.io.total_bytes [total bytes read and written by process] proc.hog.cpu [average percentage CPU utilization of each process] proc.hog.mem [sum of resident and swapped memory used by the process] proc.hog.disk [average I/O rate of each process since it was started] -
View network interface information.
The following command examples require you to press
CTRL-Cto exit.pmrep network.interface.hw_addrExample Output:
[oracle@ol-node-01 ~]$ pmrep network.interface.hw_addr n.i.hw_addr n.i.hw_addr lo ens3 00:00:00:00 02:00:17:0b 00:00:00:00 02:00:17:0b 00:00:00:00 02:00:17:0b ^C -
View outgoing metrics from the ens3 network interface in real time.
pmrep -i ens3 -v network.interface.outExample Output:
[oracle@ol-node-01 ~]$ pmrep -i ens3 -v network.interface.out n.i.o.bytes n.i.o.packets n.i.o.errors n.i.o.drops n.i.o.fifo n.i.o.carrier n.i.o.compressed ens3 ens3 ens3 ens3 ens3 ens3 ens3 byte/s count/s count/s count/s count/s count/s count/s N/A N/A N/A N/A N/A N/A N/A 279.594 1.997 0.000 0.000 0.000 0.000 0.000 ^C -
View live disk write operations per partition.
pmval disk.partitions.writeExample Output:
[oracle@ol-node-01 ~]$ pmval disk.partitions.write

metric:    disk.partitions.write
host:      ol-node-01
semantics: cumulative counter (converting to rate)
units:     count (converting to count / sec)
samples:   all

              sda1                  sda2                  sda3
               0.0                   0.0                   0.0
               0.0                   0.0                   0.0
               0.0                   0.0                   0.9993
^C
Run PCP Tools Against PCP Archives
The pmlogger service generates archives of performance metrics. The /var/oled/pcp/pmlogger/<hostname> directory stores the PCP archives.
-
View the locally stored archive.
ls -l /var/oled/pcp/pmlogger/ol-node-01/Example Output:
[oracle@ol-node-01 ~]$ ls -l /var/oled/pcp/pmlogger/ol-node-01/
total 63684
-rw-r--r--. 1 pcp pcp  5927024 Feb 14 10:50 20250214.10.42.0
-rw-r--r--. 1 pcp pcp      872 Feb 14 10:50 20250214.10.42.index
-rw-r--r--. 1 pcp pcp   344884 Feb 14 10:50 20250214.10.42.meta
-rw-r--r--. 1 pcp pcp 44183724 Feb 14 11:43 20250214.10.51.0
-rw-r--r--. 1 pcp pcp     4372 Feb 14 11:43 20250214.10.51.index
-rw-r--r--. 1 pcp pcp   801360 Feb 14 11:41 20250214.10.51.meta
-rw-r--r--. 1 pcp pcp      278 Feb 14 10:51 Latest
-rw-r--r--. 1 pcp pcp    29001 Feb 14 10:51 pmlogger.log
-rw-r--r--. 1 pcp pcp    29283 Feb 14 10:50 pmlogger.log.prev
Note: In this example, the archive name is
20250214.10.42.0. Substitute the actual archive name for your environment in the following steps. -
View the host, timezone, and time period of the archive.
pmdumplog -L /var/oled/pcp/pmlogger/ol-node-01/<your-archive-name>Example Output:
[oracle@ol-node-01 ~]$ pmdumplog -L /var/oled/pcp/pmlogger/ol-node-01/20250214.10.42.0
Log Label (Log Format Version 2)
Performance metrics from host ol-node-01
    commencing Fri Feb 14 10:42:20.661017 2025
    ending     Fri Feb 14 10:50:30.243829 2025
Archive timezone: GMT
PID for pmlogger: 3097
You can run almost any PCP command against the archive by including the
-aoption and providing the archive name as an argument. -
Run the
pcputility on the archive.sudo pcp -a /var/oled/pcp/pmlogger/ol-node-01/<your-archive-name>Example Output:
[oracle@ol-node-01 ~]$ sudo pcp -a /var/oled/pcp/pmlogger/ol-node-01/20250214.10.42.0 Performance Co-Pilot configuration on ol-node-01: archive: /var/oled/pcp/pmlogger/ol-node-01/20250214.10.42.0 platform: hardware: 4 cpus, 1 disk, 1 node, 31828MB RAM timezone: GMT pmcd: Version unknown, -
List all performance metrics enabled when creating the archive.
pminfo -a /var/oled/pcp/pmlogger/ol-node-01/<your-archive-name> -
View disk write operations per partition from the archive.
pmval disk.partitions.write -a /var/oled/pcp/pmlogger/ol-node-01/<your-archive-name> | less -
View outgoing metrics from the ens3 network interface from the archive.
pmrep -i ens3 -v network.interface.out -a /var/oled/pcp/pmlogger/ol-node-01/<your-archive-name> | less
Configure Remote Monitoring of a PCP Collector Host
Next, you will configure the ol-node-02 instance as a remote PCP collector. Then, you will configure the ol-node-01 instance to monitor performance metrics on the remote host.
-
Open a new terminal and connect via SSH to the ol-node-02 instance.
ssh oracle@<ip_address_of_ol-node-02> -
Install the
pcppackage.sudo dnf install pcp -y -
Enable and start the Performance Metrics Collector Daemon (
pmcd) and the Performance Metrics Logger (pmlogger) collector host services.sudo systemctl enable --now pmcd pmlogger -
Enable the PCP client tools to connect to a remote PMCD.
sudo sed -i "s/PMCD_LOCAL=1/PMCD_LOCAL=0/g" /etc/sysconfig/pmcd -
Restart
pmcd.sudo /usr/libexec/pcp/lib/pmcd start -
The PCP client tools communicate with PMCD over the network using TCP port 44321 by default. Use the
firewall-cmdcommand to add port44321/tcp.sudo firewall-cmd --add-port=44321/tcp --permanent sudo firewall-cmd --reload -
Return to the terminal for the ol-node-01 instance.
Note: Perform all of the remaining tasks in this tutorial from the ol-node-01 instance.
-
Use the
firewall-cmdcommand to add port44321/tcp.sudo firewall-cmd --add-port=44321/tcp --permanent sudo firewall-cmd --reload -
Add the ol-node-02 instance to the pmlogger configuration file.
sudo sed -i '/#remote/a\ol-node-02 n n PCP_ARCHIVE_DIR/ol-node-02 -r -T24h10m -c config.ol-node-02' /etc/pcp/pmlogger/controlThis change enables centralized archive collection on the monitoring host by fetching performance metrics from collector hosts.
-
Restart the
pmloggerservice.sudo systemctl restart pmlogger -
Verify that you now have ol-node-01 and ol-node-02 directories in the
/var/log/pcp/pmloggerdirectory.ls -l /var/oled/pcp/pmloggerExample Output:
[oracle@ol-node-01 ~]$ ls -l /var/log/pcp/pmlogger total 12 drwxrwxr-x. 2 pcp pcp 4096 Feb 14 20:26 ol-node-01 drwxrwxr-x. 2 pcp pcp 119 Feb 14 20:26 ol-node-02 -rw-r--r--. 1 pcp pcp 131 Feb 14 20:26 pmlogger_check.log -rw-r--r--. 1 pcp pcp 315 Feb 14 18:31 pmlogger_check.log.prev -
Verify that you can view PCP services on remote host ol-node-02.
sudo pcp -h ol-node-02Example Output:
[oracle@ol-node-01 ~]$ sudo pcp -h ol-node-02 Performance Co-Pilot configuration on ol-node-02: platform: Linux ol-node-02 5.15.0-305.176.4.el9uek.x86_64 #2 SMP Tue Jan 28 20:15:04 PST 2025 x86_64 hardware: 4 cpus, 1 disk, 1 node, 31636MB RAM timezone: GMT services: pmcd pmcd: Version 6.2.2-7, 12 agents, 6 clients pmda: root pmcd proc pmproxy xfs linux nfsclient mmv kvm jbd2 dm openmetrics pmlogger: primary logger: /var/oled/pcp/pmlogger/ol-node-02/20250214.11.17 pmie: primary engine: /var/oled/pcp/pmie/ol-node-02/pmie.log -
View the locally stored PCP information which is stored locally.
ls -l /var/oled/pcp/pmlogger/ol-node-02/Example Output:
[oracle@ol-node-01 ~]$ ls -l /var/oled/pcp/pmlogger/ol-node-02/
total 1580
-rw-r--r--. 1 pcp pcp 654508 Feb 14 13:31 20250214.13.29.0
-rw-r--r--. 1 pcp pcp    252 Feb 14 13:31 20250214.13.29.index
-rw-r--r--. 1 pcp pcp 314408 Feb 14 13:31 20250214.13.29.meta
-rw-r--r--. 1 pcp pcp    278 Feb 14 13:29 Latest
-rw-r--r--. 1 pcp pcp  35283 Feb 14 13:29 pmlogger.log
Note: In this example, the archive name is
20250214.13.29.0. Substitute the actual archive name for your environment in the following command. -
View PCP services from the archive for remote host ol-node-02.
sudo pcp -a /var/oled/pcp/pmlogger/ol-node-02/<your-archive-name>Example Output:
[oracle@ol-node-01 ~]$ sudo pcp -a /var/oled/pcp/pmlogger/ol-node-02/20250214.13.29.0 Performance Co-Pilot configuration on ol-node-02: archive: /var/oled/pcp/pmlogger/ol-node-02/20250214.13.29.0 platform: Linux ol-node-02 5.15.0-305.176.4.el9uek.x86_64 #2 SMP Tue Jan 28 20:15:04 PST 2025 x86_64 hardware: 4 cpus, 1 disk, 1 node, 31636MB RAM timezone: GMT services: pmcd pmcd: Version 6.2.2-7, 12 agents, 1 client pmda: root pmcd proc pmproxy xfs linux nfsclient mmv kvm jbd2 dm openmetrics pmie: primary engine: /var/oled/pcp/pmie/ol-node-02/pmie.log -
View a real-time, one-line summary of a remote host.
pmstat -h ol-node-02Note: You can run almost any PCP command against the remote host by including the
-hoption and providing the host name as an argument.Example Output:
[oracle@ol-node-01 ~]$ pmstat -h ol-node-02 @ Fri Feb 14 12:34:24 2025 loadavg memory swap io system cpu 1 min swpd free buff cache pi po bi bo in cs us sy id 0.00 0 29667m 4204 1539m 0 0 0 17 114 170 0 0 100 0.00 0 29666m 4204 1540m 0 0 0 4 117 164 0 0 100 ^C -
View live disk write operations per partition for remote host ol-node-02.
pmval disk.partitions.write -h ol-node-02Example Output:
[oracle@ol-node-01 ~]$    pmval disk.partitions.write -h ol-node-02

metric:    disk.partitions.write
host:      ol-node-02
semantics: cumulative counter (converting to rate)
units:     count (converting to count / sec)
samples:   all

              sda1                  sda2                  sda3
               0.0                   0.0                   1.999
               0.0                   0.0                   0.0
               0.0                   0.0                   0.0
               0.0                   0.0                   0.0
^C
Chart Performance Metrics Visually
pmchart is a graphical utility provided by the pcp-gui package. pmchart plots PCP performance metrics from a live host or the PCP archives. You can display multiple charts simultaneously, and many aspects of pmchart can be customized through the interface.
Before you continue, ensure you have two terminal windows open, one logged into the ol-node-01 instance and the other intool-node-02.
-
Log off from both Oracle Linux instances so that you are at the
[luna.user@lunabox Desktop]$prompt in both terminal windows.exit -
Use one of the terminal sessions to open an SSH tunnel for a VNC session on the ol-node-01 instance.
ssh -L 5910:localhost:5901 oracle@<ip_address_of_ol-node-01> -
From the second terminal, open vncviewer and then provide the password of
oracleat the prompt.vncviewer localhost:5910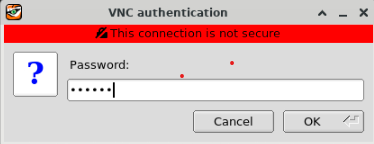
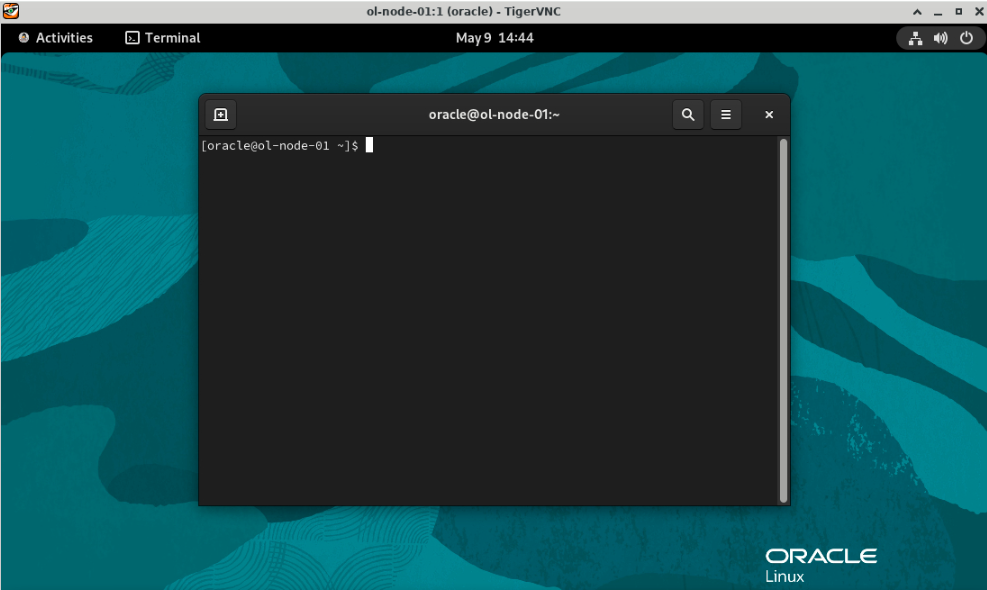
The Oracle Linux desktop appears on the ol-node-01 instance.
-
Click on Activities and open a Terminal window.
-
Enter the command
pmchartto open the graphical interface.pmchart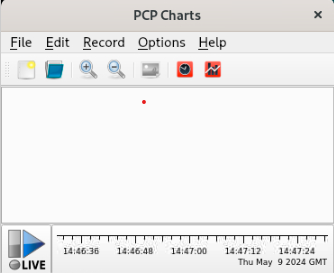
-
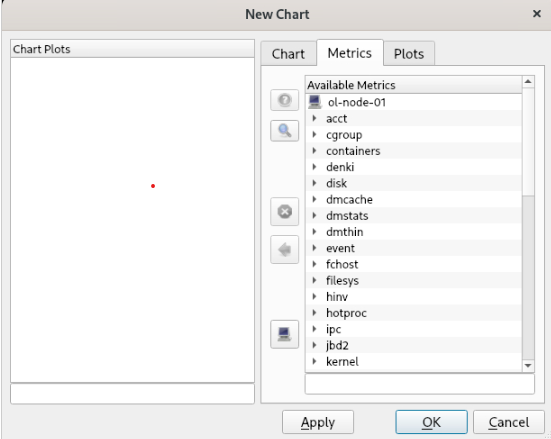
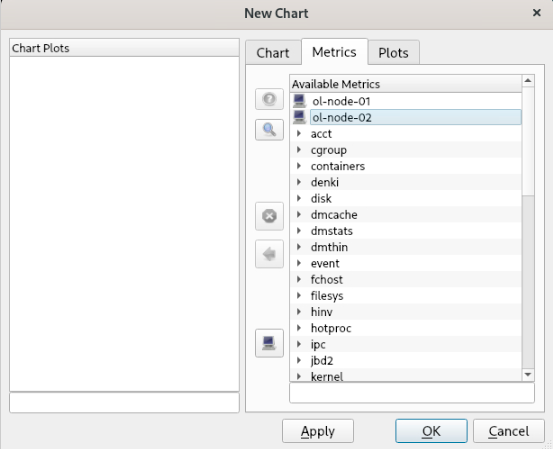
Select the ‘New Chart’ option from the File menu.
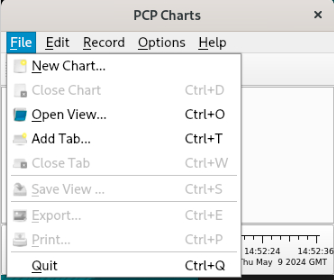
The New Chart dialog box appears. The three tabs on the right side of the window provide the following settings:
- Chart: Properties related to the entire chart (Title, Legend settings, Y-Axis scaling, etc.)
- Metrics: Available metrics (performance data) for plotting in the chart
- Plots: Properties related to each chart plot (color, label)
-
From the Metrics tab, select a performance metric, for example,
kernel.cpu.util.sys, by drilling down as shown.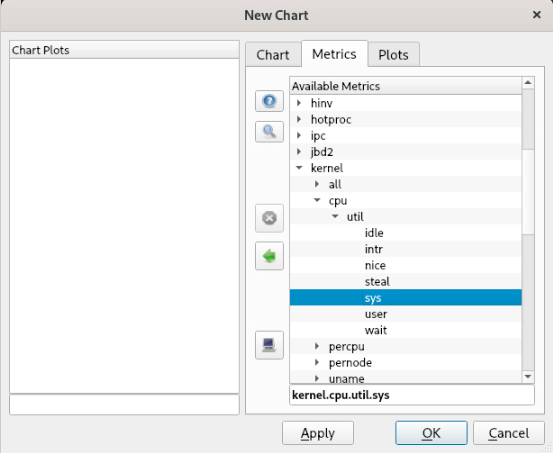
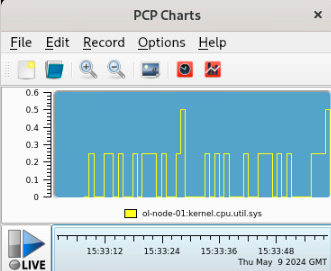
-
Click OK, and data will appear on the chart after a few seconds.
Hint: Click the ‘Zoom In’ button to change the scale for better viewing.
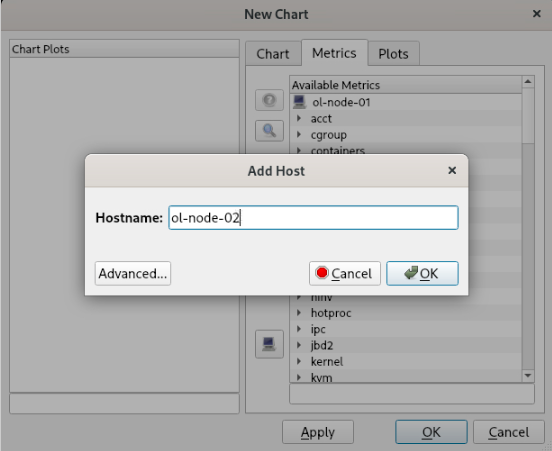
-
Add the ol-node-02 instance by clicking ‘New Chart’, then click the ‘Add a host’ button on the New Chart dialog box. Enter ol-node-02 as the Hostname and click OK.
-
You can now select available performance metrics from ol-node-02. You can scroll down to view available metrics for ol-node-02, or double-click the ol-node-01 entry from the Metrics tab to collapse the metrics for ol-node-01 and view metrics for ol-node-02.
-
From the Metrics tab, select
kernel.cpu.util.sysfor ol-node-02 and click OK. You now have a second chart showing the same performance metrics for each host.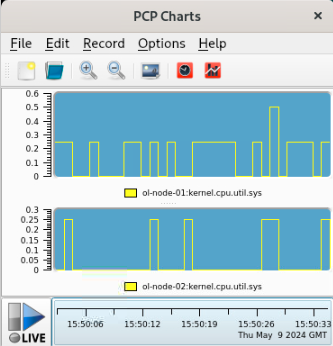
Next Steps
This tutorial introduced you to the Performance Co-Pilot (PCP) and how it can help you monitor and manage overall system-level performance. It also showed you how Oracle Linux hosts could be configured as PCP collectors, which collate performance data from various sources, or as PCP monitors that display the data collected from hosts with the PCP collectors installed. Check out the documentation in the provided links for more details.
Related Links
- Oracle Linux Performance Co-Pilot Documentation
- Oracle Linux Documentation
- Oracle Learning Library
- Oracle Linux Training Station
More Learning Resources
Explore other labs on docs.oracle.com/learn or access more free learning content on the Oracle Learning YouTube channel. Additionally, visit education.oracle.com/learning-explorer to become an Oracle Learning Explorer.
For product documentation, visit Oracle Help Center.
Work With Performance Co-Pilot on Oracle Linux
F98303-02
February 2025
Copyright ©2024, Oracle and/or its affiliates.