Add Custom Map Layers

You can add custom map layers to use in map visualizations.

You add a custom map layer using a geometric data file with the .json extension that conforms to GeoJSON schema https://en.wikipedia.org/wiki/GeoJSON. You then use the custom map layer to view geometric map data in a workbook. For example, you might add a Mexico_States.json file to enable you to visualize geometric data in a map of Mexico States.

The maximum upload size for an individual GeoJSON file is 100 MB (compressed). The overall limit for GeoJSON files is 200 MB (compressed). Compressed GeoJSON files are smaller (up to half the original size) than uncompressed GeoJSON. Oracle Analytics compresses files that you upload by stripping out whitespace and truncating precision to 6 decimal points.

  • Map layer files containing polygons with 12 or more decimal points might reduce in size by 50%.

  • Map layer files that contain point geometries might reduce in size by 15-20%.

If preferred, you can compress your map layer files before you upload them to Oracle Analytics using tools such as mapshaper.org.

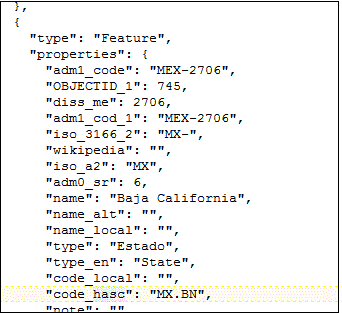
When creating a custom map layer, you must select layer keys that correspond with data columns that you want to analyze in a map visualization. For example, if you want to analyze Mexican States data on a map visualization, you might start by adding a custom map layer for Mexican States, and select HASC code layer key from the Mexican_States.json file. Here's an extract from the Mexican_States.json file that shows some of the geometric data for the Baja California state.

Description of mexstatesjsonbajasnap.gif follows
Description of the illustration mexstatesjsonbajasnap.gif

If you wanted to use the Mexican_States.json file, the layer keys that you select must match columns that you want to analyze from the Mexican States Data tables. For example, if you know there's a data cell for the Mexican state Baja California then select the corresponding name field in the JSON file to display state names in the Map visualization. When you create a workbook and select column (such as State, and HASC), then Mexican states are displayed on the map. When you hover the mouse pointer over a state, the HASC code (such as MX BN) for each state is displayed on the map.
  1. On the Home page, click Navigator, and then select Console to display the Console page.
  2. Click Maps to display the Map Layers page.

    You can enable and disable System Map Layers but you can't create or delete them.

  3. To add a custom map layer, click Add Custom Layer or drag and drop a JSON file from File Explorer to the Custom Maps area.
  4. Browse the Open dialog, and select a JSON file (for example, Mexico_States.json).

    The JSON file must be a GeoJSON file that conforms to the standard specified in https://en.wikipedia.org/wiki/GeoJSON (the maximum file size allowed is 20MB).

    Custom layers that use the Line String geometry type aren't fully supported. The Color and Size section on Visualization Grammar pane doesn't apply to line geometries.

  5. Click Open to display the Map Layer dialog.
  6. Enter a Name and an optional Description.
  7. Select the layer keys that you want to use from the Layer Keys list.
    The layer keys are a set of property attributes for each map feature, such as different codes for each state in Mexico. The layer keys originate from the JSON file. Where possible, select only the layer keys that correspond with your data.
  8. Click Add. A success message is displayed when the process is complete and the layer is added.