About Brushing Between Visualizations on a Canvas
You can configure brushing on a canvas so that when a user selects data points in a visualization, those datapoints are automatically highlighted in other visualizations.
Brushing can only work when visualizations share the same dataset.
You can set the Brushing
![]() canvas property to be on or off,
for a selected canvas. See Update Canvas Properties.
canvas property to be on or off,
for a selected canvas. See Update Canvas Properties.
- On - If you select one or more data points in a visualization, then corresponding data points are highlighted in the other visualizations on the canvas that use the same dataset.
- Off - If you select one or more data points in a visualization, then corresponding data points are not highlighted in other visualizations on the canvas.
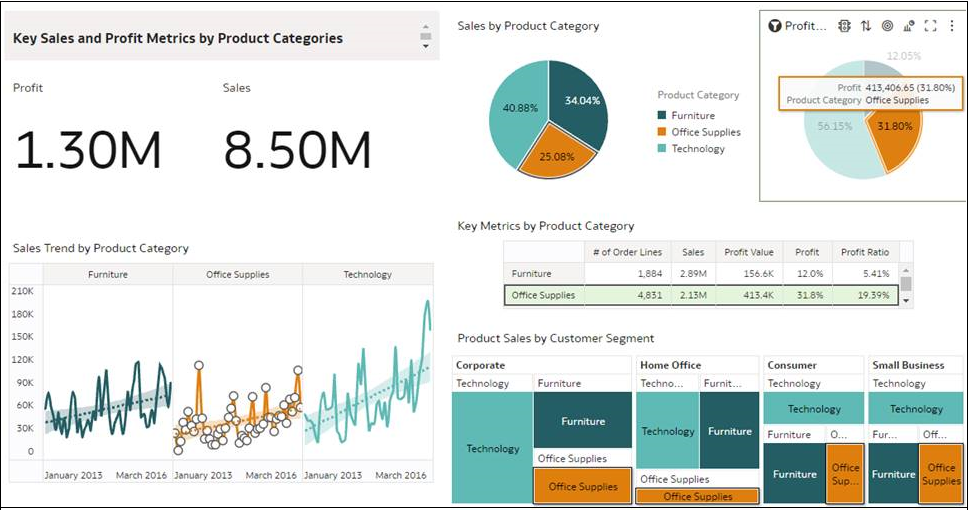
For example, if you select Office Supplies in the Pie chart and Brushing
is set to On, then Office Supplies data points are also
highlighted in the other visualizations on the canvas.
Description of the illustration brushing-example.png
In tables and pivots, if you select a single cell and brushing is turned on, it acts based on the entire row, not the individual cell.