About the Dataset Editor
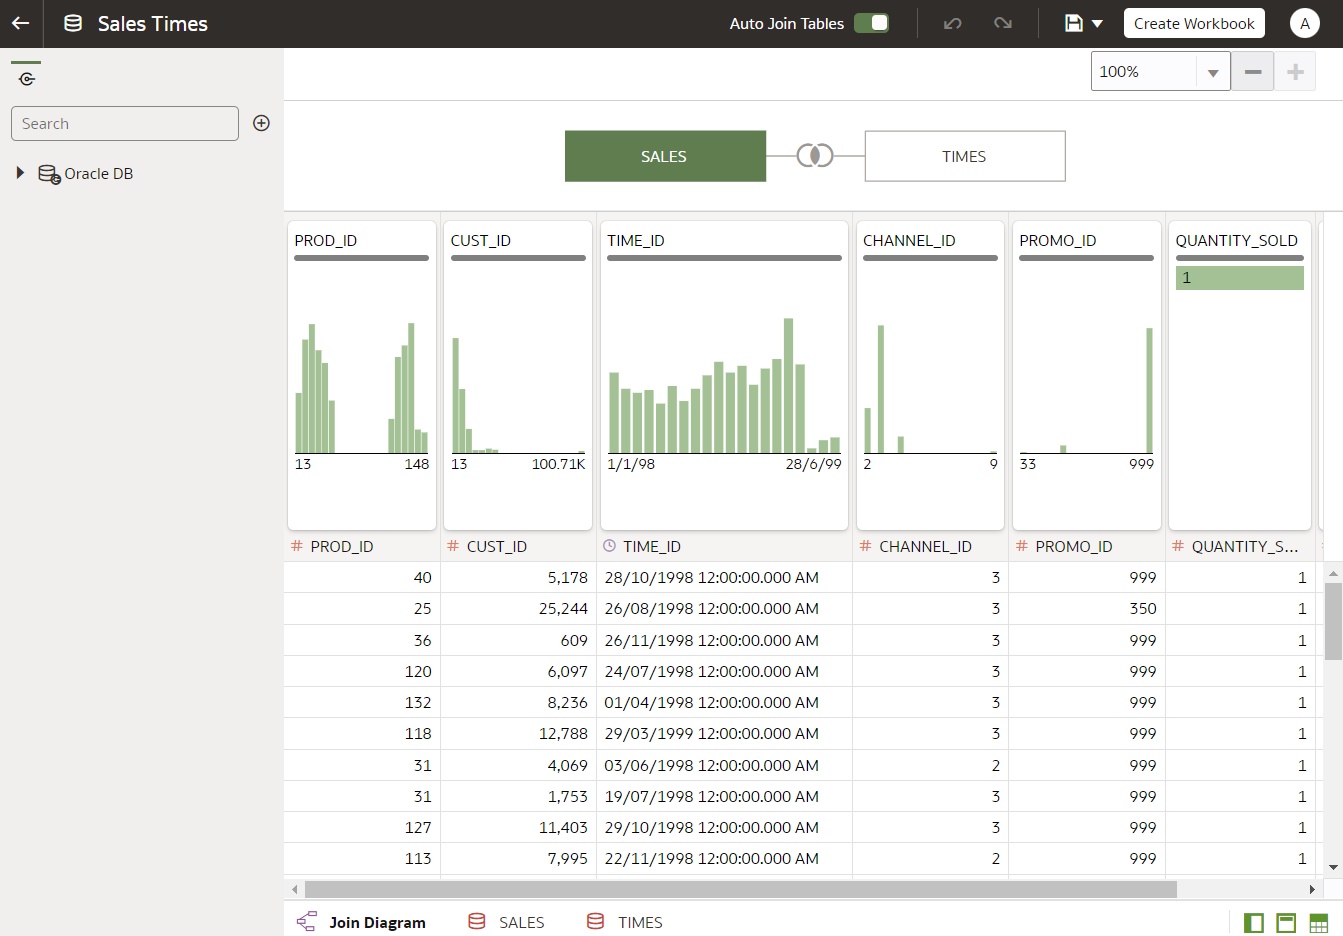
Use the Dataset editor to create or edit a dataset that includes tables, joins, and enriched data.
When you create a dataset from a connection that supports datasets with multiple tables, Oracle Analytics displays the Dataset editor. See Data Sources Available for Use in Datasets.
You can't create datasets with multiple tables from Oracle EPM Cloud, Oracle Essbase, or Google Analytics connections. Use the transform editor for connections that don't support datasets with multiple tables.
Each Dataset editor feature and what you can do with it is explained here:
-
Connections Pane
This pane on the Data Panel displays the data source connection's schemas and tables, and uploaded files. To add a table or file from the Connections Pane to the Join Diagram, drag and drop it from the list to the diagram or double-click it. You can add more than one table or file.
Click Add to open the Add Connection or Add File dialog where you can select or create another connection or select a file to add to the dataset.
Use Search to find a schema, table, or file displayed in the Connections pane.
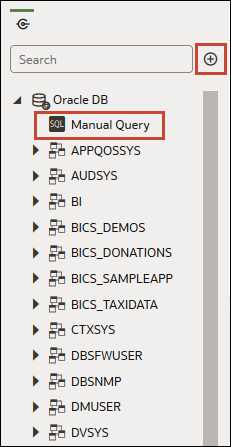
To write a SQL statement to create a table, drag and drop the Manual Query item to the diagram. Then go to the diagram and double-click the Manual Query table to access the SQL editor.Note:
Use Manual Query when a JDBC connection doesn't provide a schema and tables listing. - Data Diagram
The Data Diagram displays data files in a workbook.

Description of the illustration data-diagram.png -
Join Diagram
The Join Diagram displays the tables and joins in the dataset. Drag and drop tables to reposition them in the diagram.
When you select a table, the Preview Data area displays a sample of the table's data. If you double-click a table, then the transform editor is displayed where you transform or enrich the table's data.The diagram's join links and icons indicate the relationships between tables. Click on a join to display the Join editor, which enbles you to configure it.
-
Data Preview
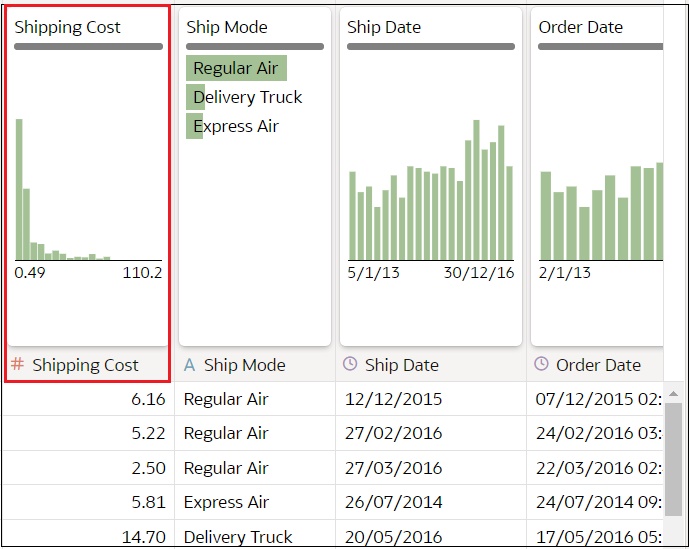
The data preview area displays a data sample for the table selected in the Join Diagram. From the data preview area you can click a column's type attribute to change its type. For example, change the CALENDAR_YEAR column from a measure to an attribute.
A quality insight tile is displayed for each column, which enables you to view the data distribution as a pictogram and assess the quality of the data using a representative sample. See What Are Quality Insights?
-
Dataset Table Page Tabs
The Dataset editor displays a tab for each table in the dataset. Click a table tab to go to the transform editor to transform or enrich the table's data. The tabs also display at the bottom of the transform editor. Use them to navigate to other tables or back to the Join Diagram.
You can also drag and drop tabs to reorder tables to make it easy to locate the tables and columns that you use most often in visualizations.
-
Dataset Editor Toggle Buttons
These buttons control which parts of the Dataset editor are displayed.

This button hides or displays the Data Panel:

This button hides or displays the Quality Tiles:

This button hides or displays the Preview Data area:


