7.2 Creating and Managing Dashboards
7.2.1 Adding a Dashboard
- On the Catalog page, click Create New Item and selectDashboard from the drop-down list.
- On the Type Properties screen, enter the following details:
- Name
- Description
- Tags
- Click Next.
- On the Source Details page, enter the following details:
- Begin: Select this option to build a dashboard from Beginning or Latest offset. Available options are latest and earliest. If you select the latest option, the dashboard shows only the new records that have been received after opening the dashboard. If you select the earliest option, then the records are read from the beginning of the OSA pipeline topics.
- CSS: Enter a custom stylesheet for the dashboard.
- Click Save.
7.2.2 Editing a Dashboard
-
On the Catalog page click the dashboard that you want to edit.
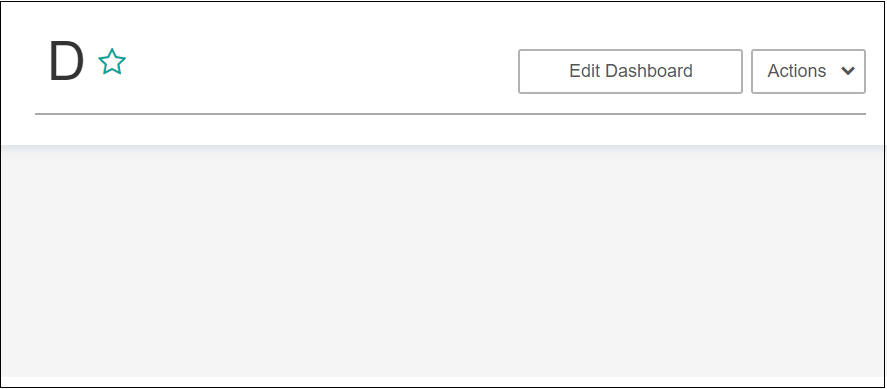
The dashboard opens in the View Mode.
-
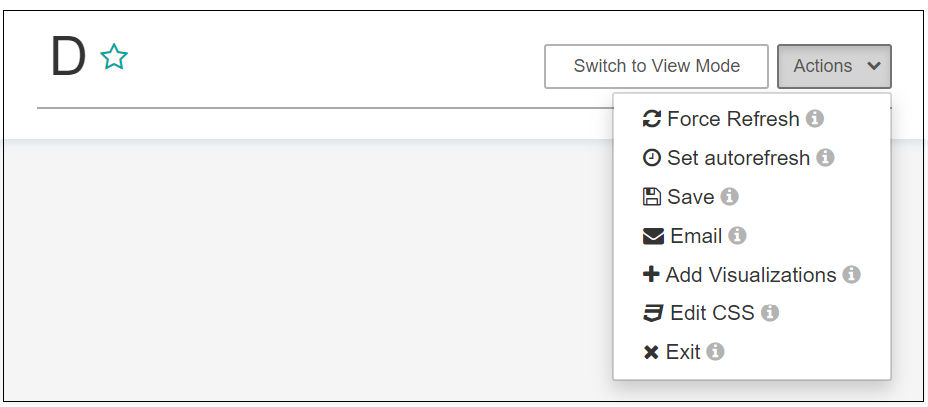
Click Edit Dashboard to view the dashboard editing options under Actions.

- Click Force Refresh to force refresh the dashboard.
-
Click Set autorefresh to select the refresh frequency for the dashboard. This is applicable only for cube based visualizations not applicable for streaming charts created out of pipeline.
This is just a client side setting and is not persisted.
Note:
The Refresh options work only for druid-based visualizations, and not for streaming visualizations because they have continuous data flow. -
Click the Save icon to save the changes you have made to the dashboard.
-
Click the Edit CSS icon to edit and apply a CSS to the dashboard. You can also edit the CSS in the live editor.
You can email the dashboard link to someone using the Email the link icon.
-
Click Add visualizations to see a list of existing visualizations. Visualizations from the pipelines and as well as from the cube explorations appear here. Go through the list, select one or more visualizations and add them to the dashboard.
-
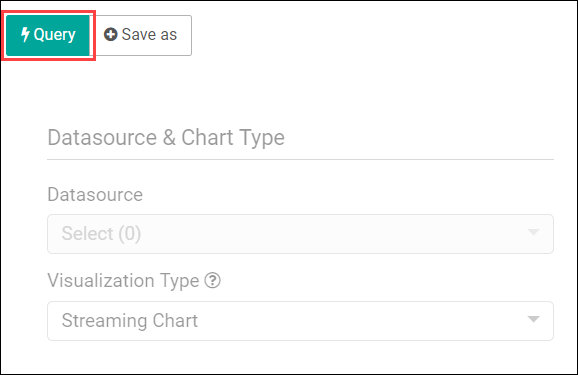
Hover over the added visualization, click the Explore chart icon to open the chart editor of the visualization.


Description of the illustration explore_chart.pngYou can see the metadata of the visualization. You can also move the chart around the canvas, refresh it, or remove it from the dashboard.
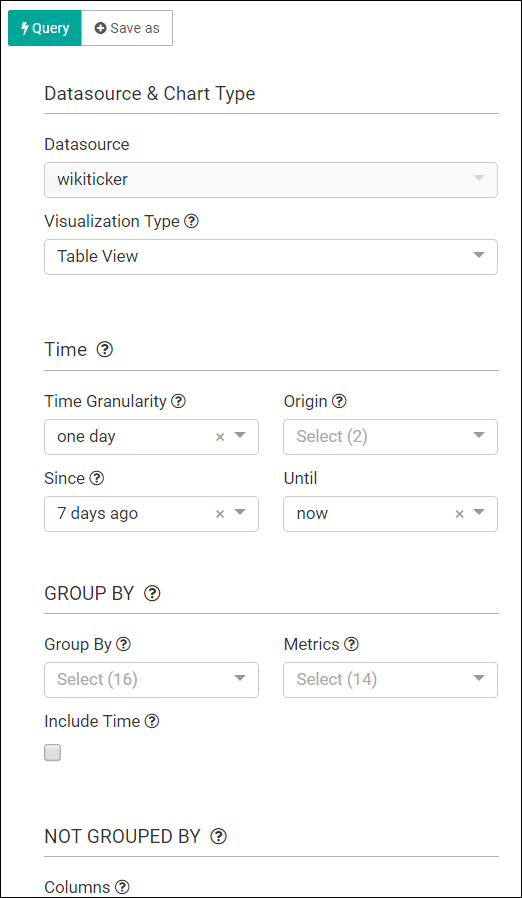
A cube exploration looks like the following:

Description of the illustration cube_exploration.pngThe various options like time granularity, group by, table timestamp format, row limit, filters, and result filters add more granularity and details to the dashboard.
-
Click Save as, to make the following changes to the dashboard:
-
Overwrite the visualization
-
Overwrite the current visualization with a different name
-
Add the visualization to an existing dashboard
-
Add the visualization to a new dashboard
-
7.2.3 Sharing a Dashboards with Peers
- On the Catalog page, click the dashboard you want to share.
- Copy the URL of the dashboard from the browser's address bar. Share this URL with users who want to access the dashboard.
7.2.4 Deleting a Dashboard
- Go to the Catalog page and hover the mouse over the dashboard that you want to delete.
- Click the delete icon that appears to your right side on the screen.
- On the Delete Confirmation screen, click Delete.
7.2.5 Importing a Dashboard with all its Dependencies
- On the Catalog page, click Import.
- In the Import dialog box, click Select, to locate and select the exported zip file on your computer.
- Click Import.
7.2.6 Exporting a Dashboard with all its Dependencies
- On the Catalog page, hover the mouse over, or select the dashboard that you want to export another GGSA instance.
- Click the Export option that appears to your right side on the screen.
- The selected dashboard and its dependent artifacts are exported as a JSON zip file, to your computer's default
Downloadsfolder.
You can share, or import this zip file on the required user instances, to add the dashboard with all its dependencies.
