10.1.3 Pipeline Details
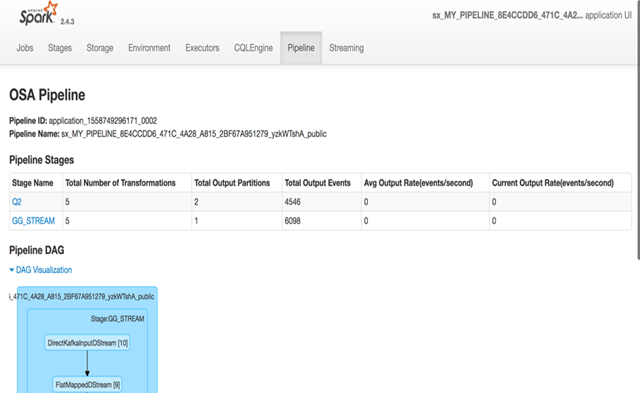
Click the Pipeline tab to view the Pipeline details page. 
Description of the illustration pipeline_details_page.png
This page has following information about a pipeline:
-
Pipeline ID: Unique pipeline id in Spark Cluster
-
Pipeline Name: Name of Oracle Stream Analytics Pipeline given by user in Oracle Stream Analytics UI.
-
Pipeline Stages Table: This section displays a table having detailed runtime metrics of each pipeline stage. Each entry in the table is corresponding to a pipeline stage in Oracle Stream Analytics UI pipeline graph.
-
Pipeline DAG: This is a visual representation of all stages in form of a DAG where it displays the parent-child relation various pipeline stages. This diagram also shows the information about the transformations in each of the pipeline stage.
-
The Pipeline Stages table contains the following columns.
-
Total Number of Transformations: This measurement is number of spark transformations applied to compute each stage.
Oracle Stream Analytics supports various types of stages e.g. Query Stage, Pattern Stage, Custom Stage etc. For each pipeline stage, Oracle Stream Analytics defines a list of transformations which will be applied on the input stream for the stage. The output from final transformation will be the output of stage.
-
Total Output Partitions: This measurement is total number of partitions in the output stream of each stage.
Every pipeline stage has its own partitioning requirements which are determined from stage configurations. For example, If a QUERY stage defines a summary function and doesn't define a group-by column, then QUERY stage will have only one partition because there will be no partitioning criteria available.
-
Total Output Events: This measurement is total number of output events (not micro-batches) emitted by each stage.
-
Average Output Rate: This measurement is the rate at which each stage has emitted output events so far. The rate is a ratio of total number of output events so far and total application execution time.
If the rate is ZERO, then it doesn't always mean that there is ERROR in stage processing. Sometime stage doesn't output any record at all (e.g. No event passed the Filter in Query stage).This can happen if rate of output events is less than 1 events/second.
-
Current Output Rate: This measurement is the rate at which each stage is emitting output events. The rate is ratio of total number of output events and total application execution time since last metrics page refresh. To get better picture of current output rate, please refresh the page more frequently.