Monitor pipelines
Monitor your pipelines to ensure that your data replication processes are running smoothly without lag. Use the tools available to troubleshoot or diagnose issues you may encounter.

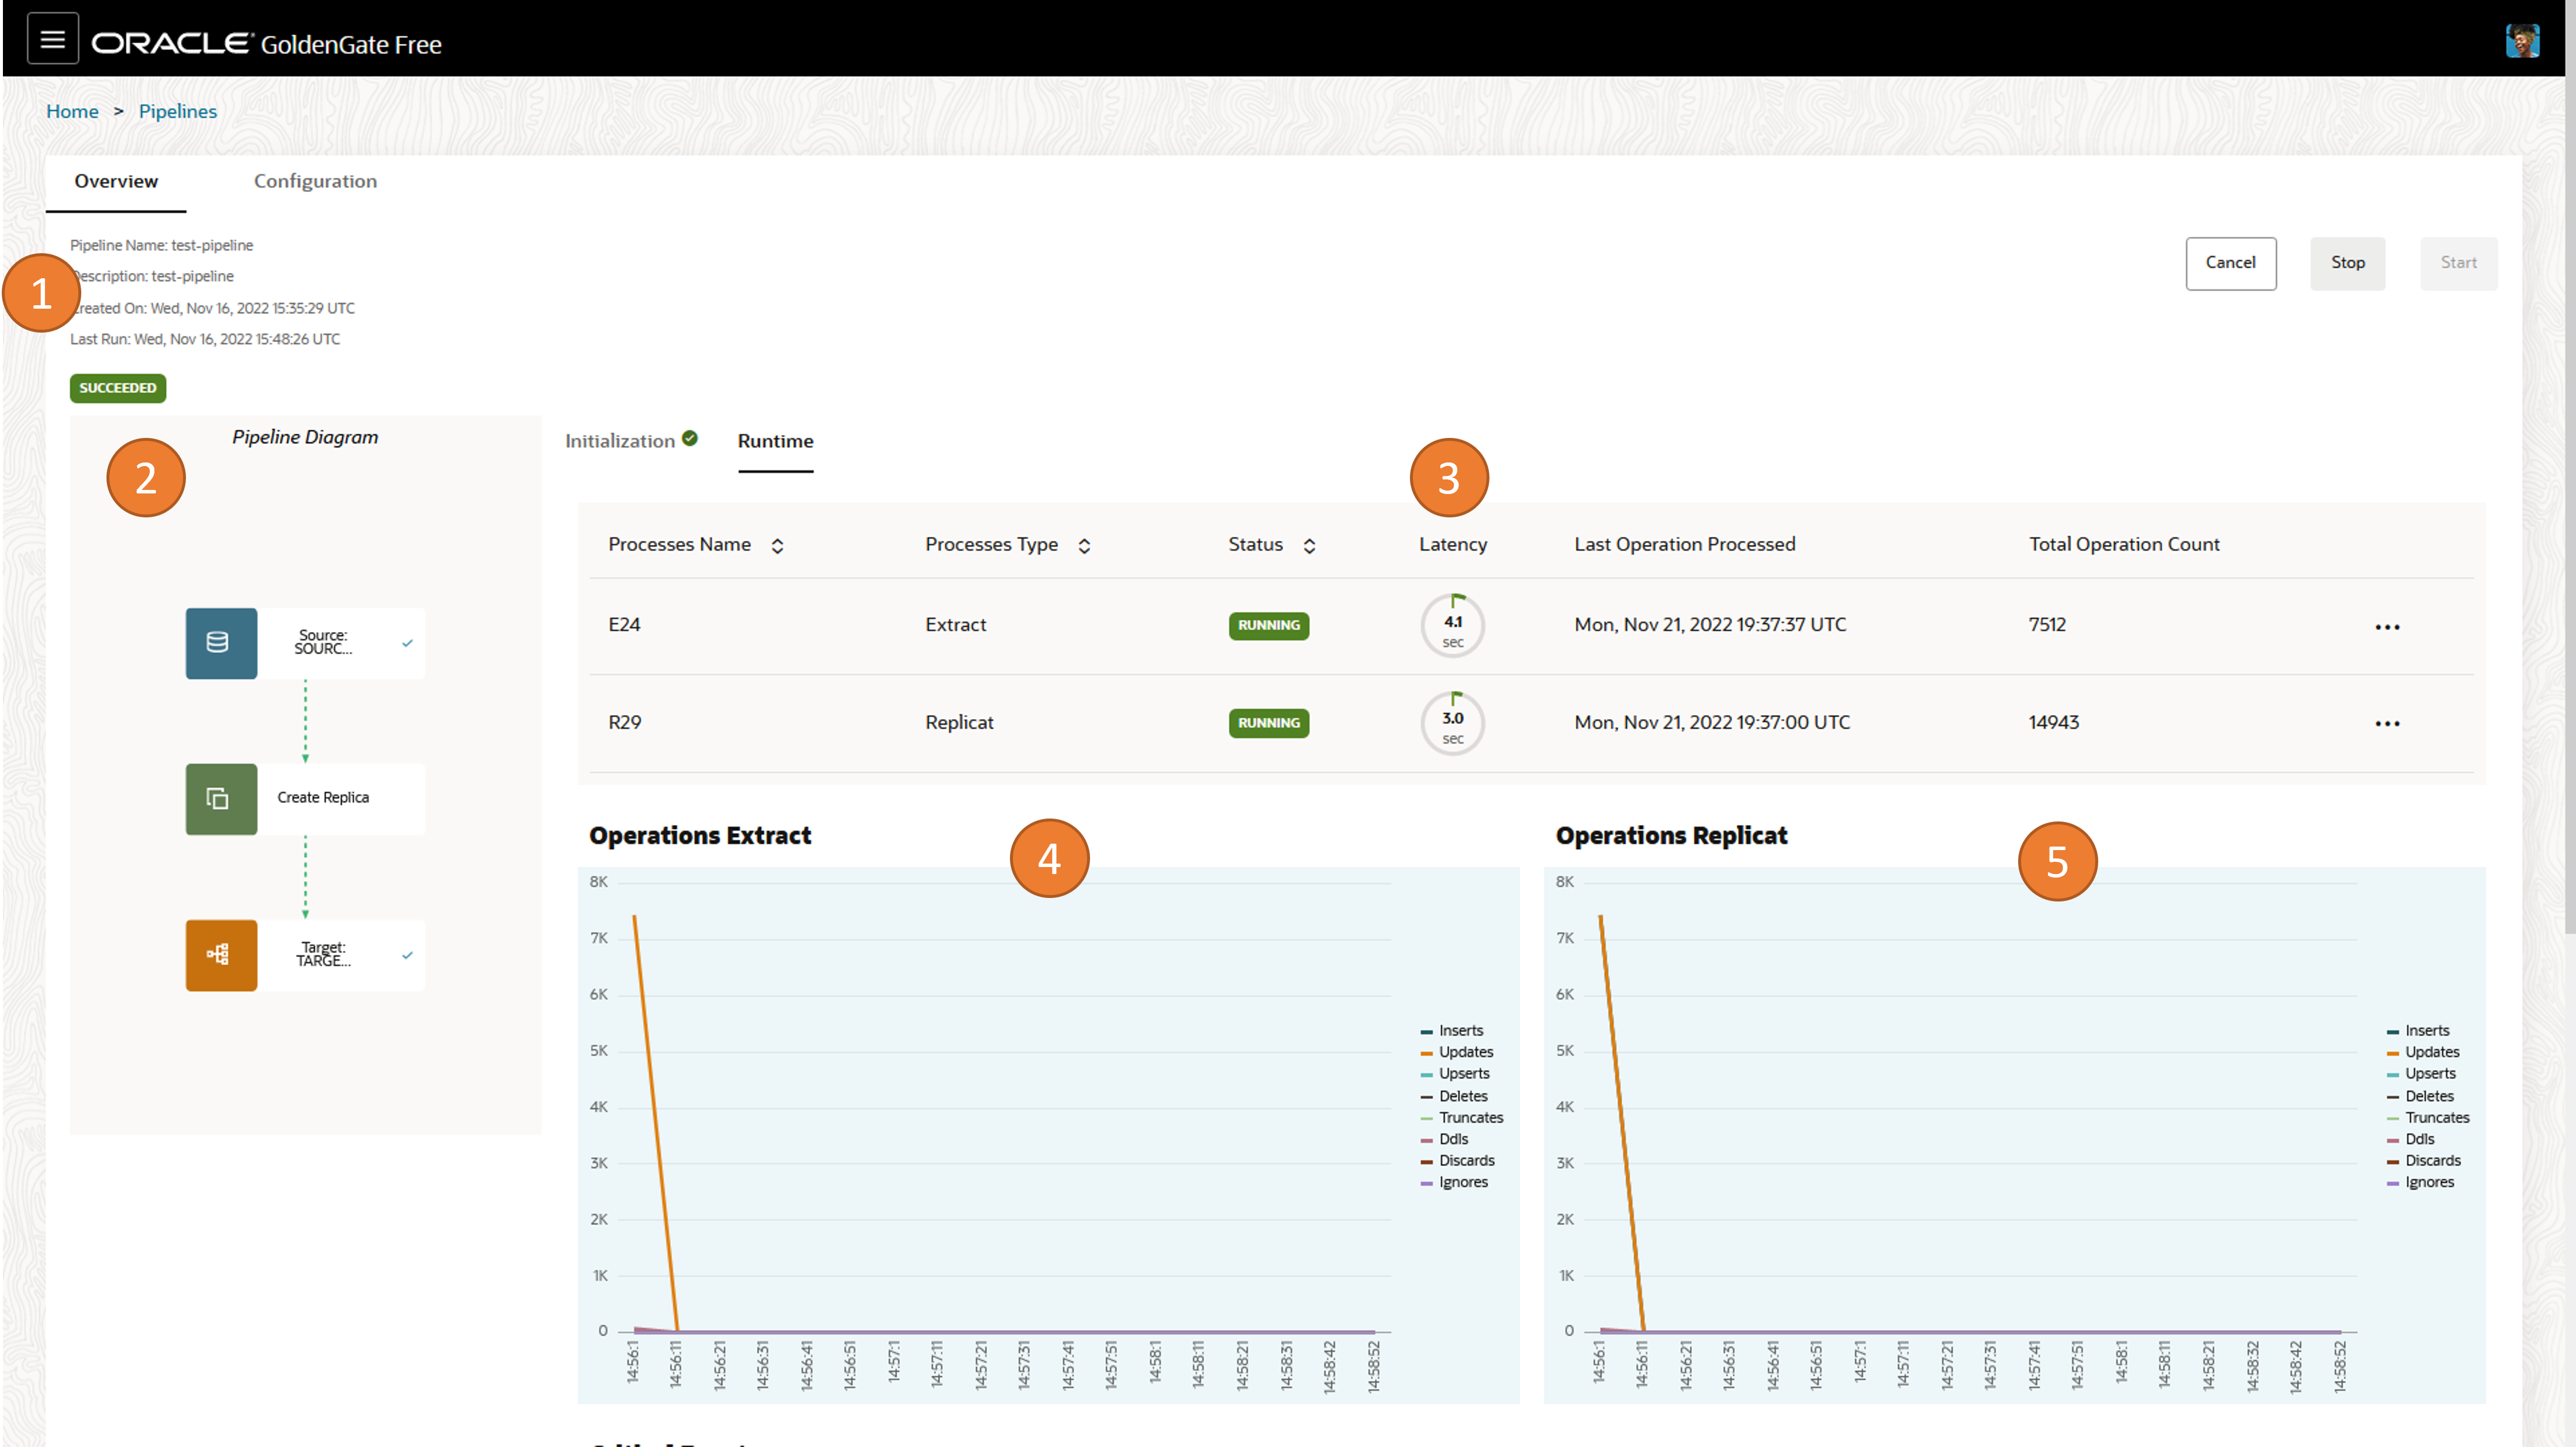
Description of the illustration pipeline-runtime-annotated.png
When you select an active pipeline from the Pipelines page, you're brought to the
pipeline's Runtime page. Here, you can view:
- Basic pipeline information, including the pipeline's name, description, created date, and run date.
- A realtime visual pipeline diagram, that updates as you make changes to the pipeline configuration.
- Information about the pipeline processes, including process names, process types, their statuses, their latency, when their last operation was processed, and their total operation count. You can also view the processes' log events, reports, latency graphs, or launch the full GoldenGate console for advanced monitoring from the processes' Action menus.
- Operations Extract graph, showing inserts, updates, upserts, deletes, truncates, DDLs, discards, and ignores over time
- Operations Replicat graph, showing inserts, updates, upserts, deletes, truncates, DDLs, discards, and ignores over time
- (Not shown) A list of critical events, along with their codes, when they occurred, their severity, and message details.
For each process, you can access the following when you open the ellipsis (three dots)
menu:
- View log events
- Access the Oracle GoldenGate Administration Server UI
- Download reports
- Download latency details
For more information about performance monitoring in the Oracle GoldenGate Microservices UI, see Monitor performance using the Oracle GoldenGate console.