Create a Graph to Visualize the Statistic Values
Create the following sheet metadata file named util1.json in the directory /usr/lib/webui/analytics/sheets/site/. Each graph or visualization must be in a group, each group must be in a section, and each section must be in a sheet. Each visualization, group, section, and sheet must have a unique name: They cannot all be named util1 statistics, for example. The following file defines two visualizations in one group: one visualization for the read and write operations counts, and one visualization for the error count.
{
    "$schema": "file:///analytics-import.schema.json",
    "v1": {
        "groups": [
            {
                "description": "Reads, writes, and error counts for the util1 example",
                "uniqueName": "util1 statistics Group",
                "visualizations": [
                    "util1 operations",
                    "util1 errors"
                ]
            }
        ],
        "sections": [
            {
                "groups": [
                    "util1 statistics Group"
                ],
                "uniqueName": "util1 statistics Section"
            }
        ],
        "sheets": [
            {
                "description": "Statistics for the util1 data_attach example.",
                "sections": [
                    "util1 statistics Section"
                ],
                "tags": [
                    "data_attach",
                    "memory map"
                ],
                "uniqueName": "util1 statistics"
            }
        ],
        "visualizations": [
            {
                "description": "Count of errors from util1",
                "ssids": [
                    "//:class.app/util1//:stat.errors"
                ],
                "style": "time-series",
                "uniqueName": "util1 errors"
            },
            {
                "description": "Counts of read and write operations for util1",
                "ssids": [
                    "//:class.app/util1//:stat.reads",
                    "//:class.app/util1//:stat.writes"
                ],
                "style": "time-series",
                "uniqueName": "util1 operations"
            }
        ]
    }
}
Run the soljsonfmt tool on the .json file to check for JSON syntactic errors. Run the soljsonvalidate tool on the .json file to check for JSON semantic errors:
# soljsonfmt util1.json
# soljsonvalidate /usr/lib/webui/analytics/sheets/analytics-import.schema.json util1.json
Restart the webui/server:default service and ensure the service is online:
$ svcadm restart svc:/system/webui/server:default
$ svcs webui/server
STATE          STIME    FMRI
online         14:02:22 svc:/system/webui/server:default
Ensure the new sheet file was successfully read:
$ svcs -Lx webui/server
[ 2016 Jun 22 14:02:20 Executing start method ("/lib/svc/method/svc-webui-server start"). ]
Importing preference files
Found     : 14 files
Imported  : 1 updated/new files

Successfully imported 1 files, removed 0 files
Import succeeded
Starting Apache webserver
Apache start completed
[ 2016 Jun 22 14:02:22 Method "start" exited with status 0. ]
When administrators open the Sheets view in the System Web Interface, they see a new sheet named "util1 statistics". If the util1 program is not running, the "util1 operations" and "util1 errors" visualizations show only the last values that were recorded. When the util1 program is started, the graphs show the values updating as they are recorded.
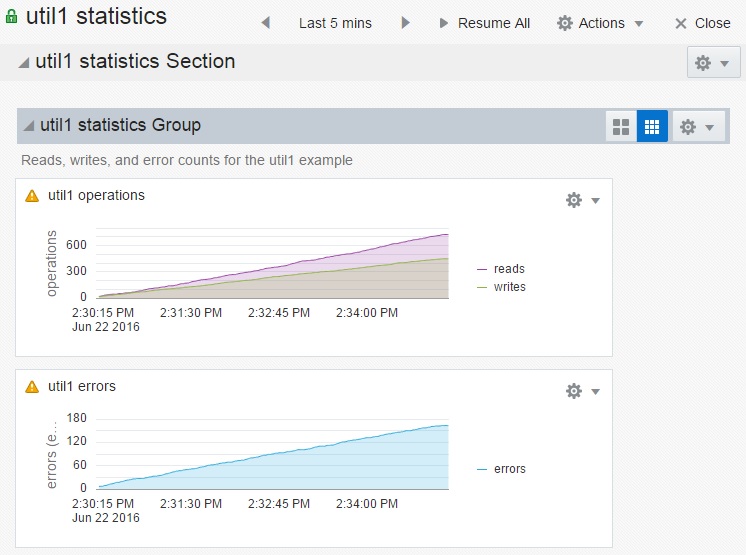
The following figure shows the values of uniqueName specified in the util1.json sheet definition file displayed as the names of the sheet, section, group, and visualizations. The statistic labels in the legend of each visualization were specified in description elements in the stat.util1.json statistic definition file, and the units of the y-axis were specified in the units elements. The reads and writes statistics must be the same units to display on the same visualization.
Graphs Showing Updating Values

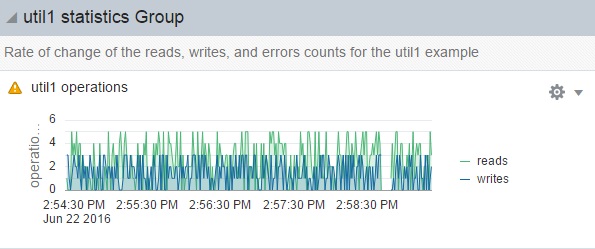
What do your users need to know about these statistics? An ever-increasing total count of operations over time might not be very useful. Edit the sheet definition file to add //:op.rate to each statistic as shown:
{
    "$schema": "file:///analytics-import.schema.json",
    "v1": {
        "groups": [
            {
                "description": "Rate of change of the reads, writes, and errors counts for the util1 example",
                "uniqueName": "util1 statistics Group",
                "visualizations": [
                    "util1 operations",
                    "util1 errors"
                ]
            }
        ],
        "sections": [
            {
                "groups": [
                    "util1 statistics Group"
                ],
                "uniqueName": "util1 statistics Section"
            }
        ],
        "sheets": [
            {
                "description": "Statistics for the util1 data_attach example.",
                "sections": [
                    "util1 statistics Section"
                ],
                "tags": [
                    "data_attach",
                    "memory map"
                ],
                "uniqueName": "util1 statistics"
            }
        ],
        "visualizations": [
            {
                "description": "Rate of change of errors count from util1",
                "ssids": [
                    "//:class.app/util1//:stat.errors//:op.rate"
                ],
                "style": "time-series",
                "uniqueName": "util1 errors"
            },
            {
                "description": "Rate of change of read and write operations count for util1",
                "ssids": [
                    "//:class.app/util1//:stat.reads//:op.rate",
                    "//:class.app/util1//:stat.writes//:op.rate"
                ],
                "style": "time-series",
                "uniqueName": "util1 operations"
            }
        ]
    }
}
Restart the webui/server:default service and ensure the service is online. The System Web Interface will close and request that you log in again. Restart the util1 program, and now you see a graph of the rate of change of the statistics.
Graph Showing Rate of Change of Statistics
