Oracle Database Sheet
If the system is running the Oracle Database, you can use the Oracle Solaris System Web Interface to view a high-level overview of Oracle Database performance and problems on that system. The information provided enables an Oracle Solaris administrator to diagnose whether the source of a problem is in the operating system, network, or storage, or whether a database administrator is required to further diagnose the problem.
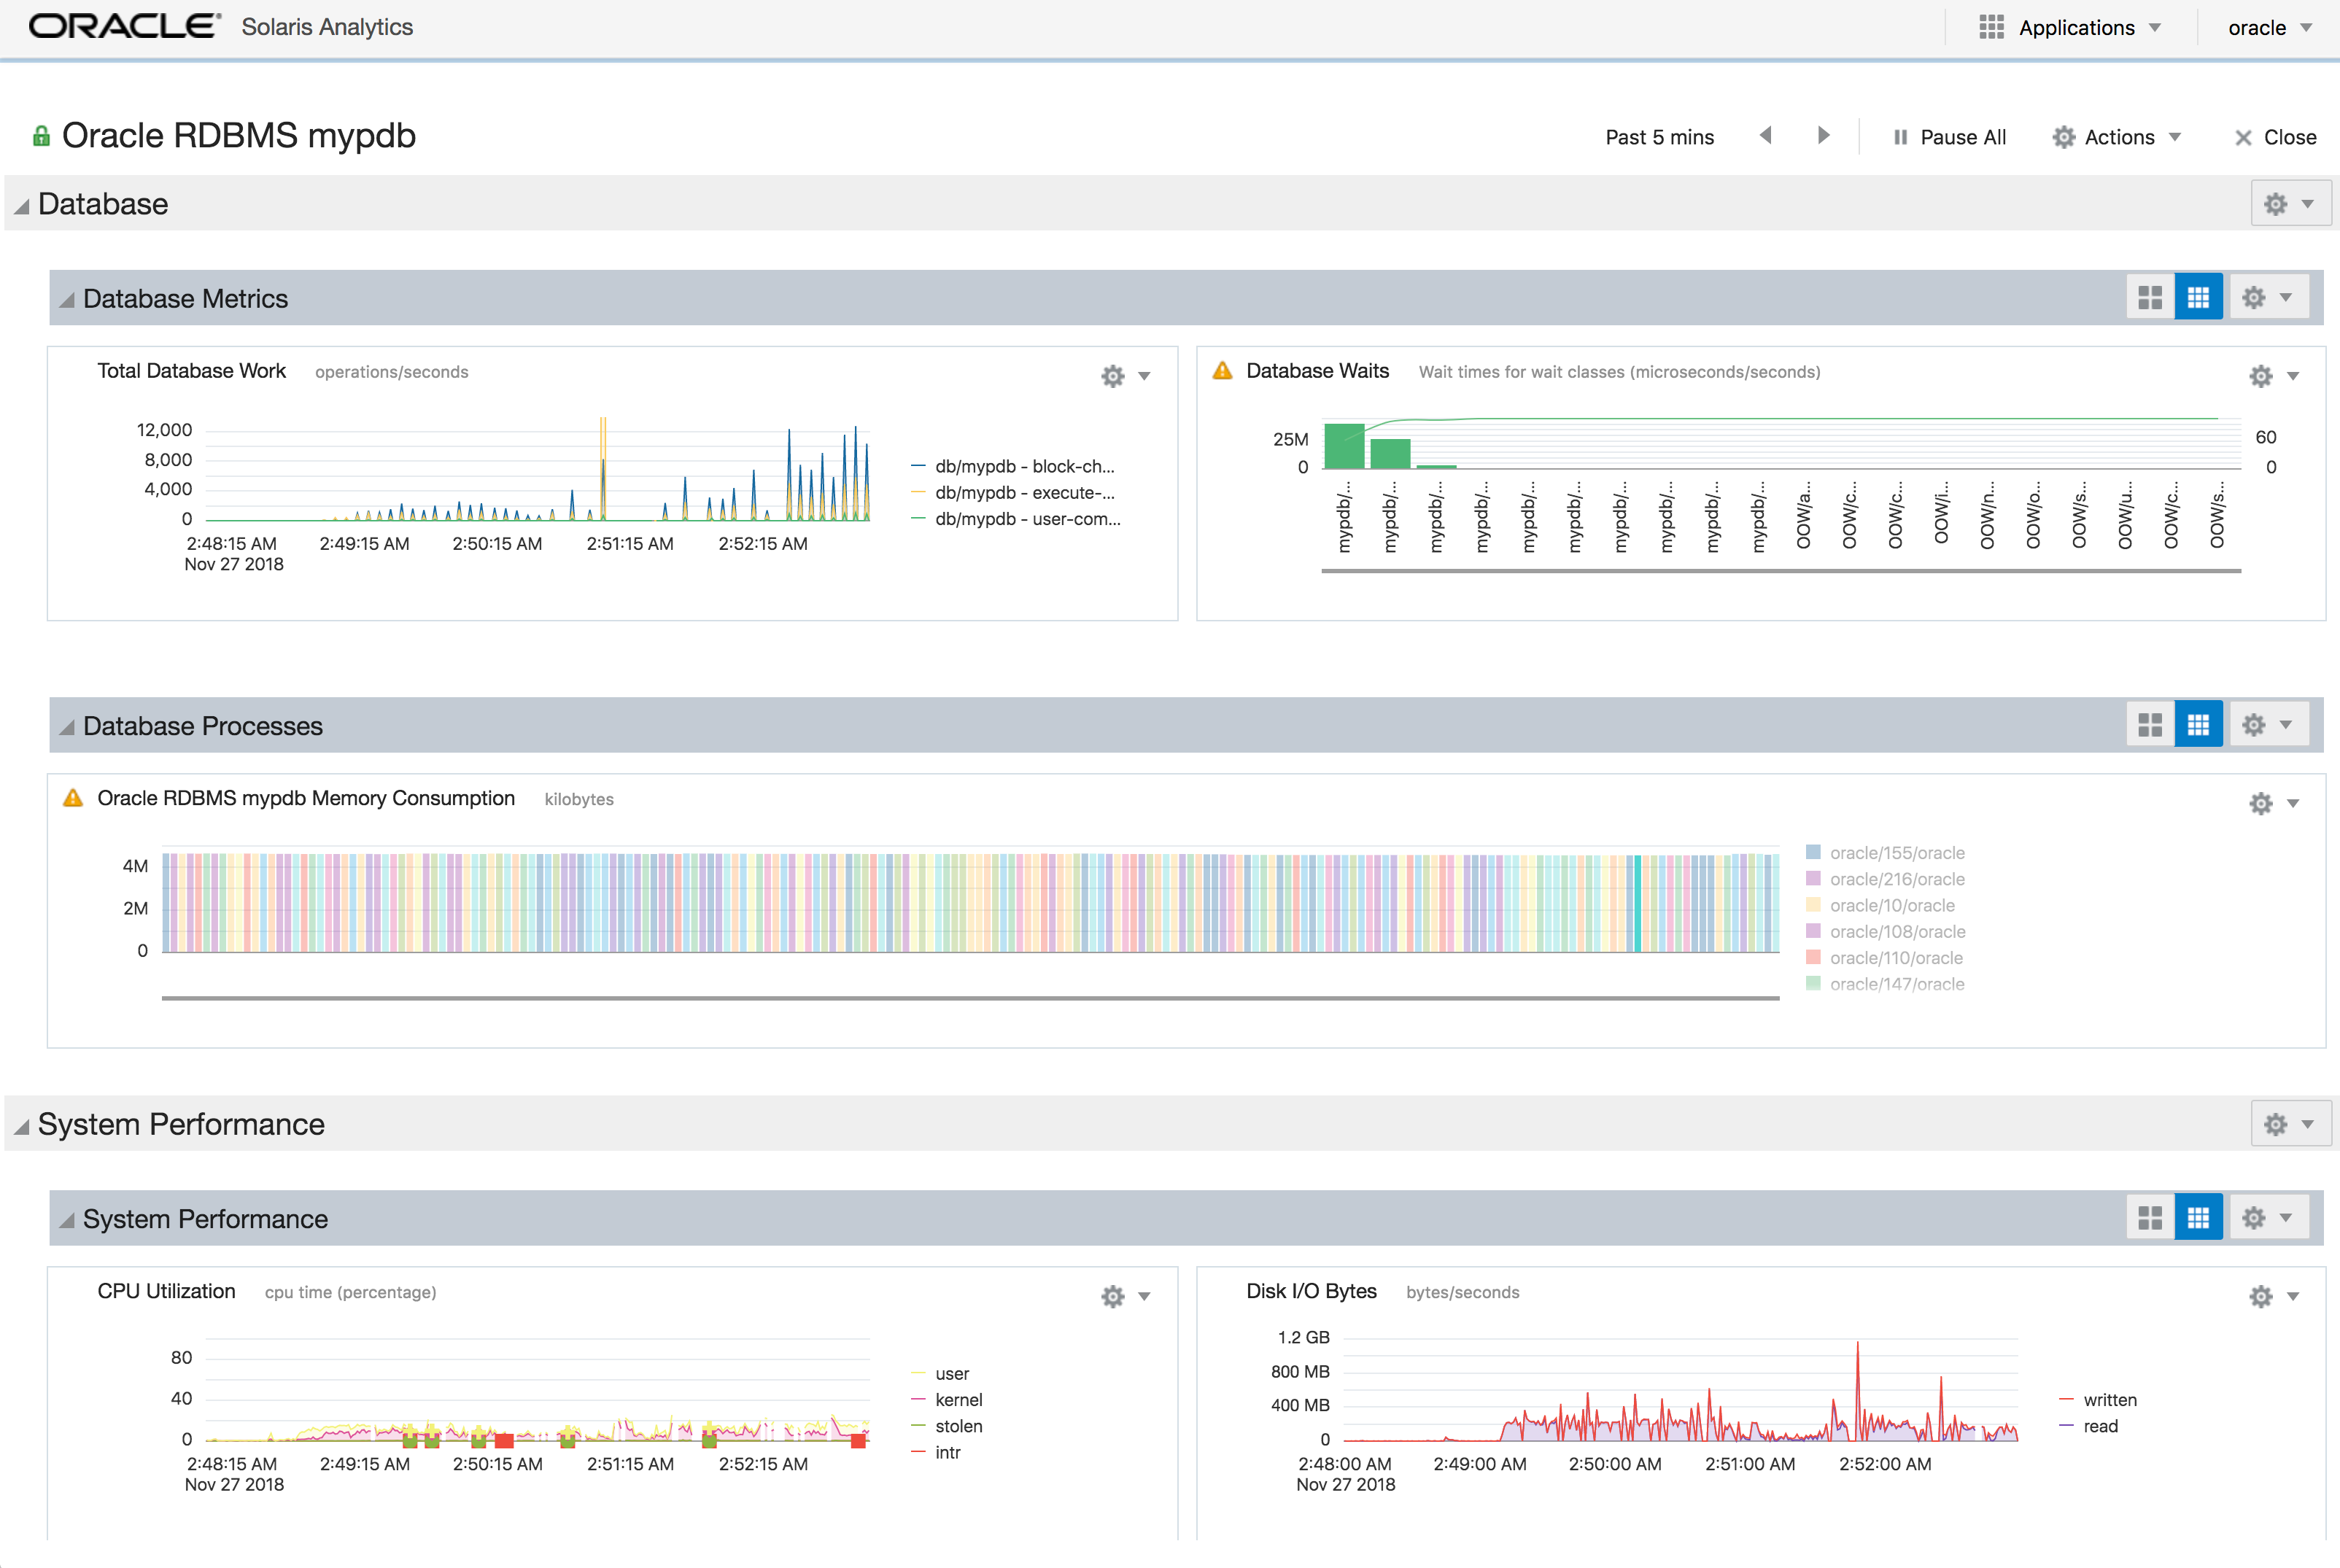
Use the Oracle Database sheet to examine data such as the following:
-
Number of times per second that the database performs block changes, data retrievals, or user commits.
-
Amount of time the database spends waiting due to system events, user application code, and system configuration.
See
V$SYSTEM_EVENTandV$SYSSTATin “Instance Tuning Using Performance Views” in the database performance tuning guide. For example, see Oracle Database Performance Tuning Guide 20c . In particular, see “Table of Wait Events and Potential Causes.” -
Memory consumption of running database processes. Note that memory consumption is in kilobytes. In the graph in the following figure, memory consumption is shown in millions of kilobytes so that the data fits on the graph. Thus “4M” on the y-axis means 4 million kilobytes, or 4 GB.
The following figure shows an example of an Oracle Database sheet. The Oracle Database instance in this example is mypdb.
Sample Oracle Database Sheet

The Oracle Database sheet also includes system performance visualizations that are not specific to Oracle Database but are included for convenience. For example, you could correlate a drop in database work or an increase in database wait times with an increase in disk reads and writes from other sources or with a CPU going offline.