Using the Drill Down Menu
When you double-click on a line graph or click an item in a graph legend for a visualization that is showing a partitioned statistic, the drill-down menu is displayed.
In the following figure, the user selected "kernel" in the legend.
Drill Down Menu Options

In the previous figure, the user selected "Drill Down on" to display the choices shown in the dialog box in the following figure. If the list of choices is long, use the "Type to filter" field to show fewer choices. The Clear button clears the filter field and shows all choices. In this example, as soon as the user selected "user," the graph changed to show only the user part of the mode partition of the CPU utilization statistic. The dialog box remains displayed so that you can select additional partitions or change your selections. Click the Done button to close the dialog box.
Drill Down On Options

The user selected Done on the dialog box shown in the preceding figure, and then took one of the following paths to drill down further:
-
Selected Partition from the Visualization Actions menu, and selected “cpu” from the list of available partitions.
-
Selected "user" in the visualization legend, selected "Drill Down on" user from the Drill Down menu that displayed, and selected "cpu" from the list of available partitions.
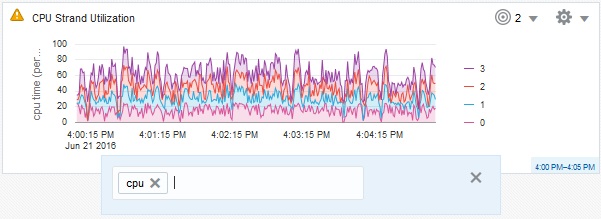
The following figure shows the list of choices for drilling down another level.
Second Level of Drill Down

The Undo History menu changed to show a “2” because the user has drilled down two times and can undo two levels of drill down:
-
Drilled down on
userfrom the display of all parts of themodepartition. -
Drilled down on the
cpupartition.
The preceding figure shows the percentage of CPU time that is user time on each CPU in the system.