Analyze Inefficient Databases

Use Database Performance Analytics to identify inefficient databases and view database performance degradation.

Analyze Database Performance Degradation

View the change in activity and demand for databases with the highest performance degradation. You can view the actual and forecasted response time by demand and activity or active sessions.

Use the Performance Degradation table to identify databases whose performance has degraded over time and is correlated with change in demand. Activity in the Y axis is the Database Time. Demand in X axis is number of SQL executions.

The following are definitions:

  • Database Time (DB Time): Total time session spends in all database calls.
  • Active Session: Session currently spending time in a database call.
  • Average Activity of the Session (% Activity): Ratio of time active to total wall clock time. Sum (Active Time) / Elapsed Time

The Performance Degradation table includes categories for Degradation with Decrease in Demand, Degradation without Change in Demand, and Degradation with Increase in Demand. Click a value to display a list of the top databases within that specific category, along with the database type, change in activity, and change in demand for each. Select a database from the list to view more information specific to that database.

You can identify databases that have the following types of degraded performance:

  • Degradation with decrease in demand
    • Change in activity greater than 20%
    • Change in demand less than -10%
  • Degradation without change in demand
    • Change in activity greater than 20%
    • Change in demand between 10% and -10%
  1. Select the time period to analyze in the upper right corner of the Database Performance Analytics page.
    The Summary panel displays the number of databases (DBs) with Performance Degradation, Workload Variability and Database Inefficiency.
  2. Scroll down to view the Performance Degradation chart, which shows the correlation of Change in Activity (%) and Change in Demand (%) for your databases (DBs). The chart highlights the databases whose activity has increased with decrease in demand or no change in demand.
  3. Click a value to view the list of databases impacted.

    A list with the names of the databases experiencing degradation and some high-level information is displayed.

  4. Click a database name to drill down to greater details.
    The Performance Trend tab provides activity details and the demand trend for the database.
  5. Click Settings. Use the regression models, forecast period, and confidence percentage to forecast demand.

Identify Inefficient Databases

Inefficient databases are databases where workload spends time on non-CPU, non-I/O, non-idle wait events, such as row locks.

Database Performance Analytics monitors database performance and calculates inefficiencies in the following ways:

  • Inefficiency percentage (%): A database’s inefficiency percentage is calculated by dividing inefficient wait time by the sum of the I/O wait time, CPU time, and inefficient wait time. Inefficient (%) = (inefficient wait time) /( IO + CPU + inefficient wait time).

    Inefficient wait times are active sessions that are not part of CPU time, I/O wait time, or idle wait events.

  • Inefficient Databases: A database is marked as inefficient when the workload spends more than 50% of the database time in waits (not on CPU or I/O).

  • Increasingly Inefficient: An Inefficient Database with an Inefficiency (%) that is increasing over time.

  1. Select the time period to analyze in the upper right corner of the Database Performance Analytics page.
    The Summary panel displays the number of databases (DBs) with Performance Degradation, Workload Variability and Database Inefficiency.
  2. Scroll down to view the overall Database Inefficiency chart, which shows the number of databases, the types of databases, and the Inefficiency percentage.

    The analytics page helps you to quickly focus on databases in the following categories:

    • Inefficient Databases: the number of databases that are over 50% inefficient.

    • Increasingly Inefficient: the number of databases that are over 50% inefficient and that have an inefficiency percentage that is increasing over time.

  3. Click the value in Database Inefficiency in the Summary panel or Inefficient Databases next to the Database Inefficiency chart to view the list of databases names.
    For example, click 3 DBs to display a list of the three database names that are identified as inefficient.
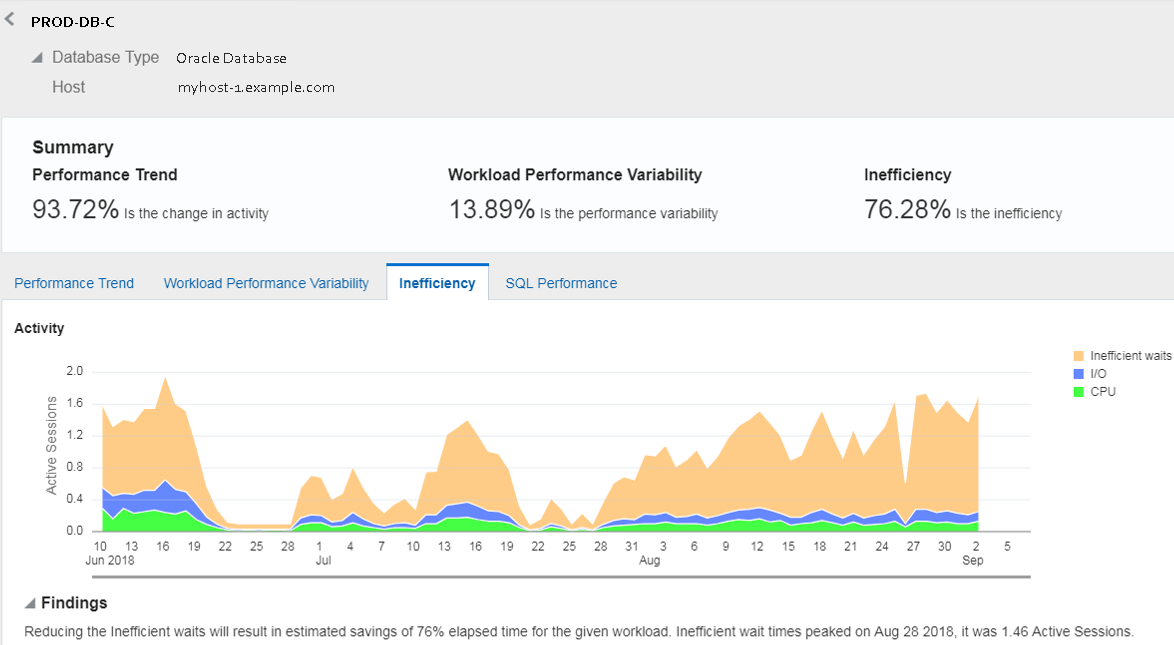
  4. Click a database name to view the I/O waits, CPU, and inefficient waits activity over time for that database.

    The following database-specific metrics appear on the Inefficiency page:

    • Inefficiency percentage. A database is marked as inefficient when the workload spends more than 50% of the database time in waits (not on CPU or I/O).

    • Breakdown of Inefficient waits, I/O waits, and CPU for the database for the selected time period.

  5. Expand and review the Findings at the bottom of the graph for information on the activity and the impact of reducing workload.
    The Findings are the results of machine learning for your dataset and provide insight into the estimated database performance that you can gain when you eliminate inefficient waits. For example, in the image in the previous step, the Findings show that reducing the inefficient waits will result in estimated savings of 76% elapsed time for the given workload. The findings also show the date that inefficient wait times peaked and the number of active sessions at the peak activity.
    You can improve the database performance by reducing inefficient waits and make adjustments to active sessions. However, simply increasing compute resources is of limited help for workloads running on inefficient databases. To reduce the workload, perform application tuning.