Fine-tune supply chain retail allocations with OCI Forecasting
Using modern analytical techniques like artificial intelligence and machine learning, allocation logic can be enhanced to consider potential impacts.
Business Solution
A retailer decides that lightweight floral print sweaters will be a big hit for spring, so they purchase, say, 5000 floral sweaters and then send an allocation of 100 to each of 50 stores.
The retailer realizes that some parts of the country are already pretty hot in the spring, so they design the allocation plan to ship more to the northern states because very few people in the southern states will want to wear sweaters of any kind when it is 80 degrees outside.
They might further refine the allocation plan to skew towards rural areas because urban areas seem to prefer solid colors and not prints. Retailers uses their best judgement to decide on allocations: seasonal weather, historical sales, current fashion trends, competitive pressures, macroeconomic trends, and so on.
- The customer is happy because they got the item they wanted when they wanted it.
- Margin is preserved because markdown pricing was not needed – and if reshipping costs emerge, you can do factual analysis when it does and does not make sense.
- Space becomes available in each store for new merchandise.
- Large shipping costs (reverse logistics) are controlled.
- Supply chain is more agile because inventory and allocations can be adjusted with finer granularity to maintain profits.
Dashboards
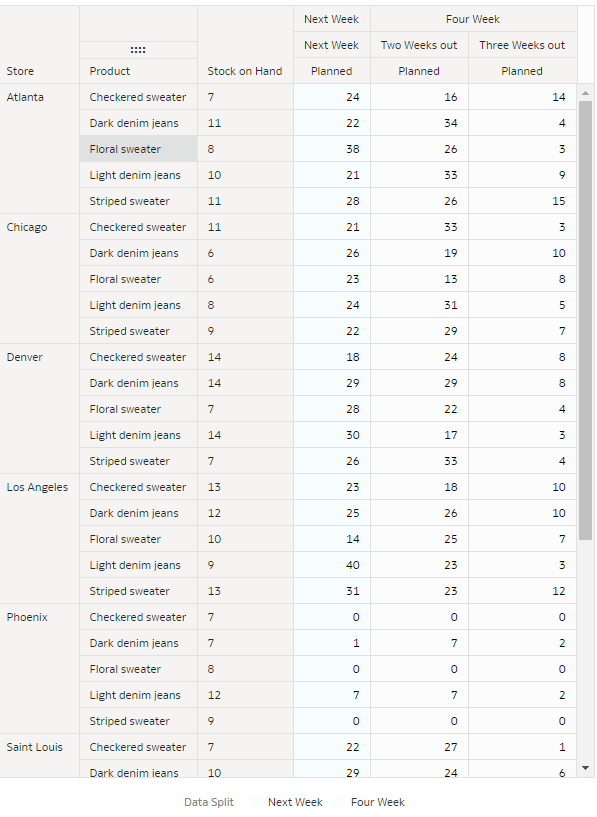
The following are example dashboards for the retail allocations solution. Consider a scenario where each store is allocated the same assortment of floral, striped and checkered sweaters with the same variety of sizes during allocation planning (using the retailer’s packaged allocation app).
The dashboard shows that some stores (historical sales) are selling more floral sweaters vs. striped sweaters. It identifies a correlation between jeans sales and sweaters: stores that sell more dark denim jeans tend to sell more checkered sweaters and stores that sell light-colored jeans sell more floral sweaters. Adding social media trend analysis, weather patterns, and so on, the dashboard recommends changing allocations based on those insights.
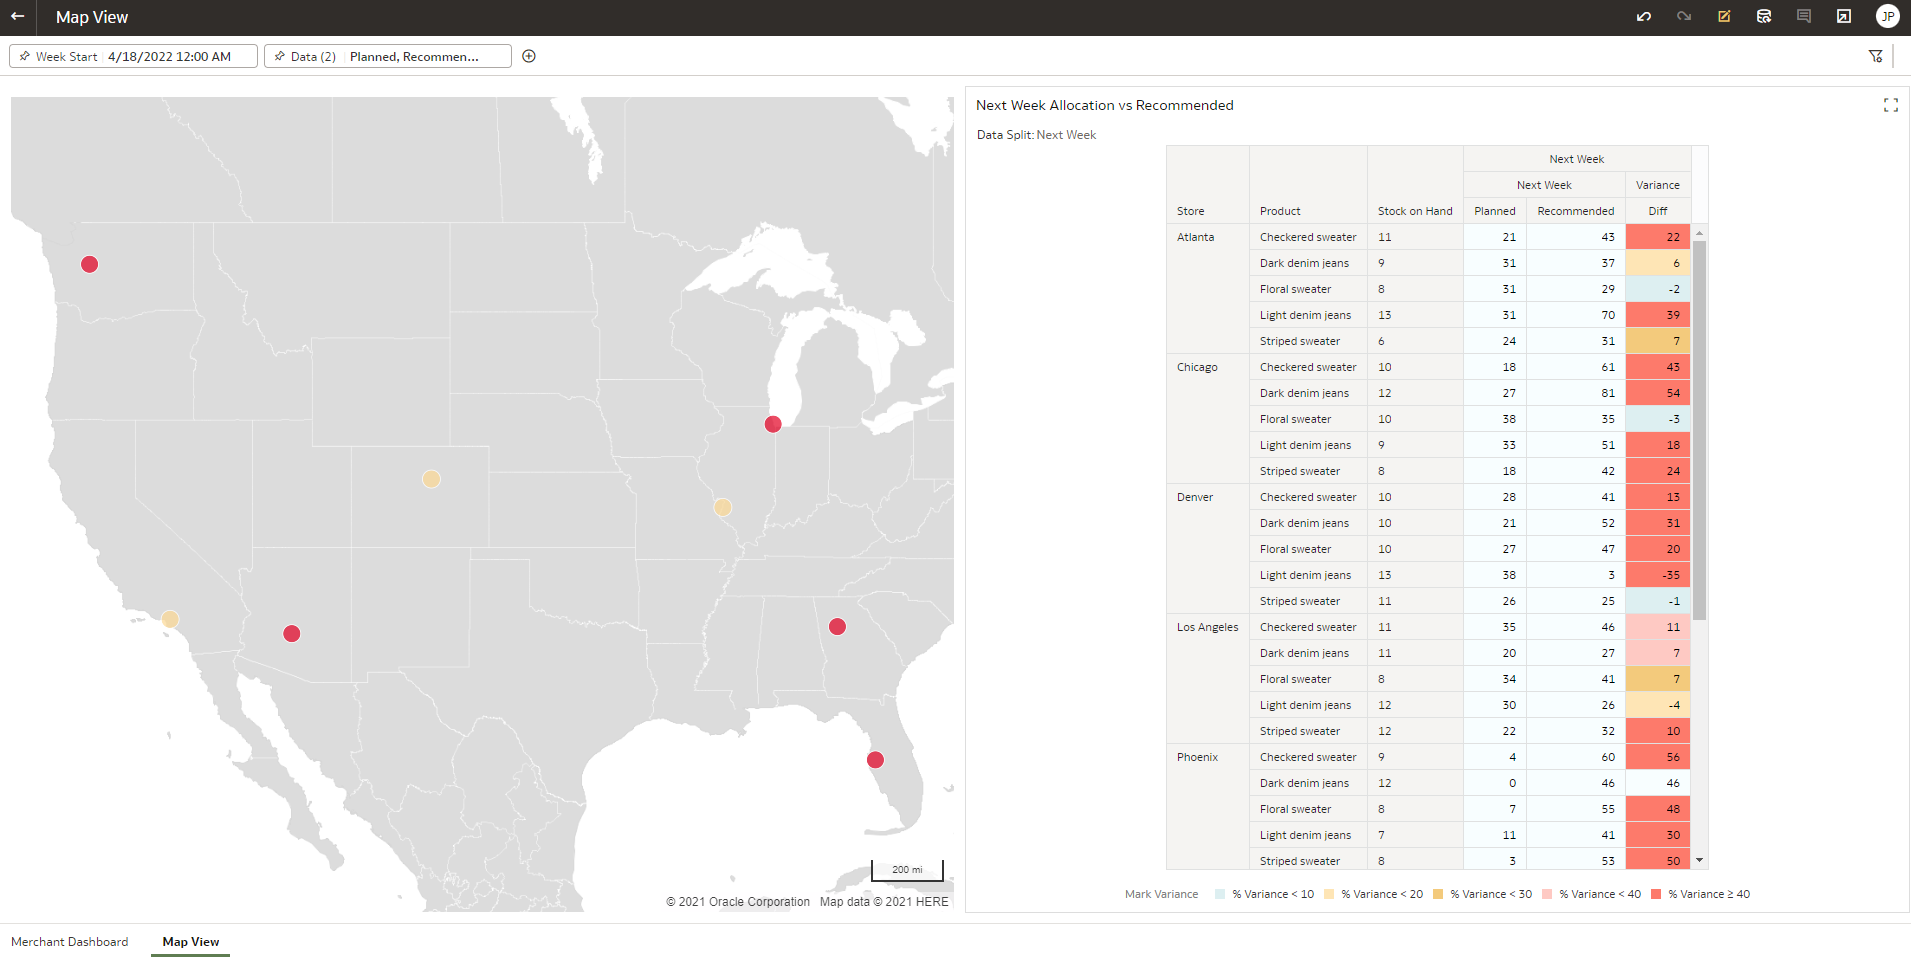
Based on artificial intelligence analysis of both historical and future data, the OCI Forecasting service recommends revised allocation amounts, for example, send 25 more striped sweaters to San Francisco stores and 31 more floral to Miami. The dashboard also includes a map view that shows which stores around the country should update their allocations in order to meet projected demand more accurately.
Dashboard design
You can see a dashboard that has 2 views:
- Dashboard shows items in each store, including the planned allocations for upcoming weeks (sourced from the Allocations app).
- The planned allocations are based on historical sales and professional experience of the merchant.
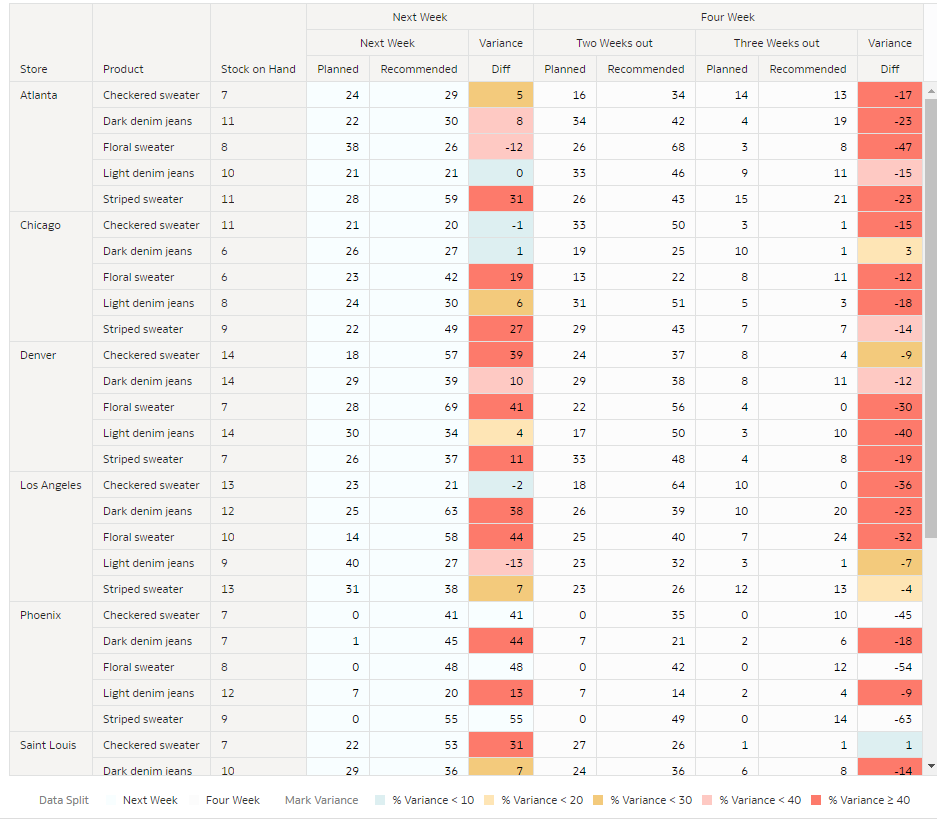
The following image shows the dashboard where the OCI Forecasting service provides additional columns that show predicted values with variances highlighted in blue, yellow, and red color.
These forecast allocations are based on:
- Previous sales (sales history per item per store)
- Social media trend analysis: A social media influencer wore the floral sweater in a recent social media post and it generated significant reaction on social channels, which will drive extra demand for that product nationwide.
- Weather patterns: There will be a huge shift in the prevailing weather. The Northeast will be unseasonably warm through April and May, and the entire Southeast will be 15 degrees below normal. Due to this change, the expected demand will be nearly reversed, low demand for sweaters in the warm Northeast, and high demand for sweaters in the cold Southeast.
Map view: A view with heatmaps showing projected hotspots where allocation levels of clothing will be incorrect for the next week.
Technical Solution
In this solution playbook, OCI Forecasting provides predictions and confidence intervals, based on local and global influencing factors such as promotions, prices, weather conditions that predict problems with the current allocation plan of a retail chain.
You can also uncover some correlations between the sales of one product that impact the sales of other products which would have been difficult to see without the use of AI. Using AI, retailers can fine-tune allocations, down to the individual store level based on factors like:
- Long range weather forecasts
- Surges or declines in item popularity based on social media sentiment analysis
- Local events that might affect demand, such as conventions, festivals or large sporting events
- Labor shortages
- Competitive pressures
- Possible supply chain disruptions due to political or social unrest
- Emerging public health emergencies
- Mid-season changes (weather, demand, trends)
Architecture
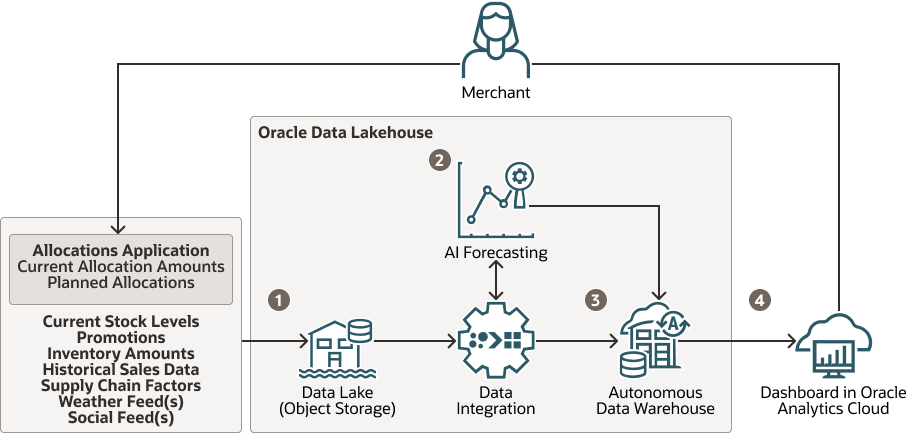
This architecture shows how the OCI Forecasting service is used to detect complex relationship patterns, trends, seasonality, errors, and external factors in time-series data.
The following image shows the high-level architecture.
- Structured and semi-structured data flows into the data lake (object storage).
- OCI Data Integration reads information from the data lakehouse, invokes AI capabilities (provided by OCI Forecasting) and pushes the insights into Autonomous Data Warehouse.
- The forecast includes predictions, confidence intervals, plus local and global influencing factors such as promotions, prices, weather conditions that predict problems with the current allocation plan.
- The structured insights can now be visualized using Oracle Analytics Cloud and exported back to the packaged allocations application.
This architecture supports the following components:
- AI Forecasting
Oracle Cloud Infrastructure (OCI) Forecasting is one of the several cloud-native AI services. OCI Forecasting delivers time-series forecasts through advanced machine learning and statistical algorithms. OCI Forecasting helps developers quickly create accurate forecasts for critical business metrics, including product demand, revenue, and resource requirements.
- Data Lake
A data lake is a scalable, centralized repository that can store raw data and enables an enterprise to store all its data in a cost effective, elastic environment. A data lake provides a flexible storage mechanism for storing raw data. For a data lake to be effective, an organization must examine its specific governance needs, workflows, and tools. Building around these core elements creates a powerful data lake that seamlessly integrates into existing architectures and easily connects data to users.
- Oracle Data Integration
Oracle Cloud Infrastructure Data Integration is a fully managed, serverless, cloud-native service that extracts, loads, transforms, cleanses, and reshapes data from a variety of data sources into target Oracle Cloud Infrastructure services, such as Autonomous Data Warehouse and Oracle Cloud Infrastructure Object Storage.
- Autonomous Data
Warehouse
Oracle Autonomous Data Warehouse is a self-driving, self-securing, self-repairing database service that is optimized for data warehousing workloads. You do not need to configure or manage any hardware, or install any software. Oracle Cloud Infrastructure handles creating the database, as well as backing up, patching, upgrading, and tuning the database.
- Object storage
Object storage provides quick access to large amounts of structured and unstructured data of any content type, including database backups, analytic data, and rich content such as images and videos. You can safely and securely store and then retrieve data directly from the internet or from within the cloud platform. You can seamlessly scale storage without experiencing any degradation in performance or service reliability. Use standard storage for "hot" storage that you need to access quickly, immediately, and frequently. Use archive storage for "cold" storage that you retain for long periods of time and seldom or rarely access.
- Analytics
Oracle Analytics Cloud is a scalable and secure public cloud service that empowers business analysts with modern, AI-powered, self-service analytics capabilities for data preparation, visualization, enterprise reporting, augmented analysis, and natural language processing and generation. With Oracle Analytics Cloud, you also get flexible service management capabilities, including fast setup, easy scaling and patching, and automated lifecycle management.


