Analyze Database CPU Usage
View the current aggregate CPU utilization trend, compare CPU utilization across databases, and forecast future CPU needs to plan your resources for a later time period.
Analyze Available CPU Resources
The CPU section under the Overview tab displays the available CPU capacity and the current utilization.
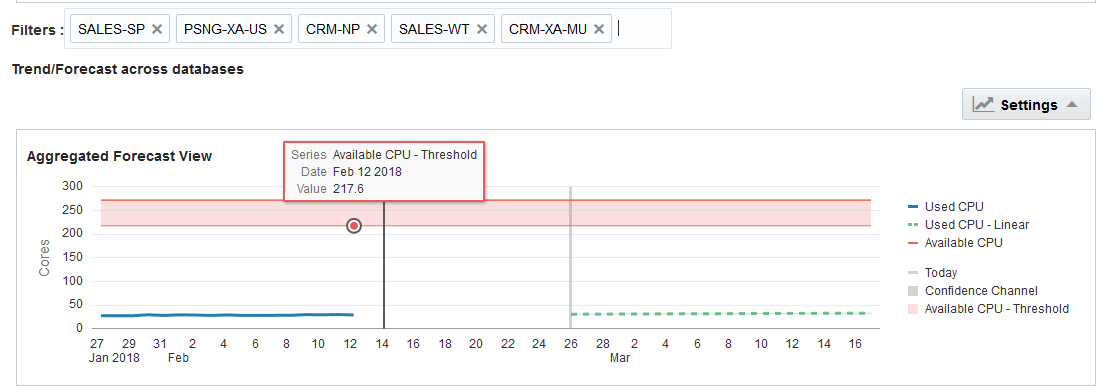
Alternatively, click the CPU tab in the left pane. The first chart (Aggregate Forecast View) shows you the actual CPU utilization (Used CPU), the available capacity (Available CPU), and the availability threshold (Available CPU - Threshold).
Figure - Aggregate Forecast View for CPU Usage

Description of "Figure - Aggregate Forecast View for CPU Usage"
The difference between the values for Used CPU and Available CPU is your unused capacity. The smaller the difference between your actual resource usage and your resource capacity, the more urgent the need to expand your available resource capacity.
Compare CPU Utilization Between Databases
The CPU breakdown by individual databases chart lets you compare how your different, individual databases are using their resources.
The number of database processes run on the CPU, and the percentage change are represented visually, through the size and color of the cells, respectively. Cells that are larger in size run more database processes than smaller cells. The largest cell would be that of the databases using the most CPU resources. The color of the cells is determined by the percentage change in the CPU resources used by the databases.
Analyze Current CPU Trend and Forecast Utilization
From the Aggregated Forecast View chart, you can view the current trend of CPU utilization, and use this trend to forecast your CPU utilization.
You can plan your database capacity based on the current and forecast resource utilization.
Figure - Trend and Forecast Chart for CPU Utilization

Description of "Figure - Trend and Forecast Chart for CPU Utilization"
In the image, the forecast CPU utilization increases slowly over time. This means that at some point in the future, the CPU capacity will be entirely used. You should plan to expand the CPU resource capacity before that point, to ensure that your databases have enough resources to function smoothly.