Identify Drives With the Most Errors

A high number of errors may indicate a problematic drive.

Identify the drives that have had the most errors recently to see if their error rates have changed to answer questions such as, "Which drives have had the most errors this week? Have their error rates gone up?"

  1. In the left navigation, expand Tape System Hardware, then select Drives Overview.
  2. In the Templates drop-down, select "STA-Drive-Health".
  3. In the Dismounts with Errors (30 Days) column, click the Sort Descending Sort Descending icon arrow. The drives with the most errors are brought to the top of the list.
    Dismounts with Errors column with Sort Descending noted
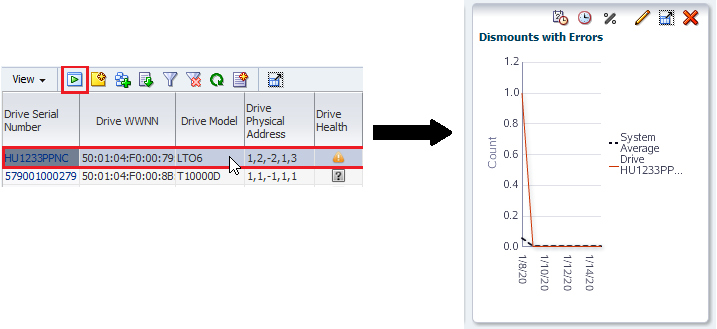
  4. Add drives to the graphs to compare their attributes against the system average.
    1. Select the drives you want to add to the graphs (shift- or ctrl-click to select multiples).
    2. Click Apply Selection Apply Selection icon.

      The graphs are updated with the drive data. In the example below, one of the drives shows a high level of errors when compared with the system average.

  5. Narrow down the date range on the Drive Errors graph pane.
    1. Click Choose Date Range Choose Date Range icon on the graph's toolbar.
      Graph toolbar with Choose Date Range icon selected
    2. Complete the Choose Date Range dialog box as follows:
      • Select Time Range.
      • In the Starting Date and Ending Date fields, enter the start and end dates of the current week.
    3. Click OK.

      The graph will update with the new time period. Variations in the graph lines should show increases and decreases in error rates during the week.