Report Library Activity Levels

Identify which library in your environment is the busiest. This may be helpful to determine how to reallocate resources.

This procedure addresses the questions, "Which library in my tape environment is the busiest? Which is the least busy?" The definition of busy varies by site; common definitions include the number of exchanges, mounts, or dismounts. This procedure uses the number of mounts. In addition, it provides instructions for graphing the data so you can compare the libraries to one another and to the system average.

  1. In the left navigation, expand Tape System Hardware, select Libraries Overview.
  2. In the Templates menu, select "STA-Lib-Utilization".
  3. Click Sort Ascending or Sort Descending for one of the following columns: Mounts (30 Days), CAP Enters (30 Days), CAP Ejects (30 Days), Occupied Storage Cells, or MB R/W (30 Days).
    Cursor hovering over column heading to show sort arrows.
  4. Add a graph pane showing dismounts.
    1. Click Add Graph Add Graph.
    2. Within the graph's toolbar, click Change Graphed Attribute Change Graph Attribute icon and select Dismounts.
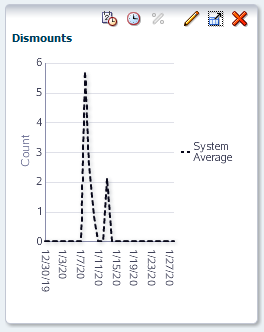
    3. The graph is updated to display the system average for dismount data.
      Sample Dismounts graph
  5. Add selected libraries to the graph to compare to the system average.
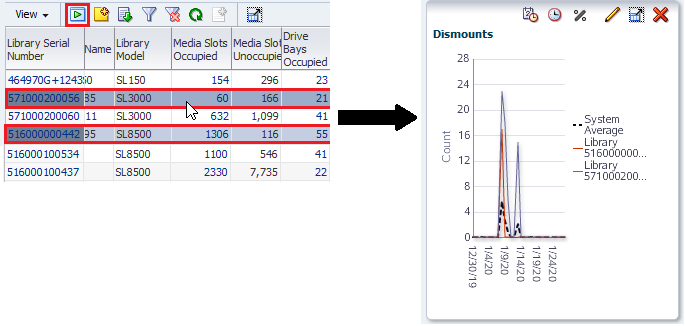
    1. In the table, select the libraries you want to add to the graphs.
    2. Click the Apply Selection Apply Selection icon.