Spark Charts
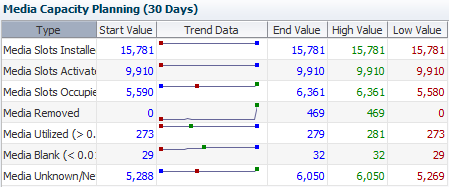
A spark chart is a small line graph that plots up to four key values—Start, End, High, and Low—for a date range. Spark charts can help you to see patterns in data values over time.
Some dashboard panes contain embedded spark charts. Depending on the date range selected and the variation among the key values, a given chart may have only two or three dots plotted, rather than four. This is because the dot for one value may hide the other if two key values are close in date and value. Filtering for a shorter date range may reveal more detail.
