Capacity: Capacity Percent Used (BUI)
This is a "trendable" statistic that graphically renders datasets, and displays the trends over the full time span of the datasets in the worksheet. These trend graphs can be both viewed and manipulated. This particular statistic shows the trends for storage capacity usage as a percentage, and is broken down by storage pools. To set a threshold alert for capacity usage by percentage, see Capacity: Capacity Percent Used (CLI).
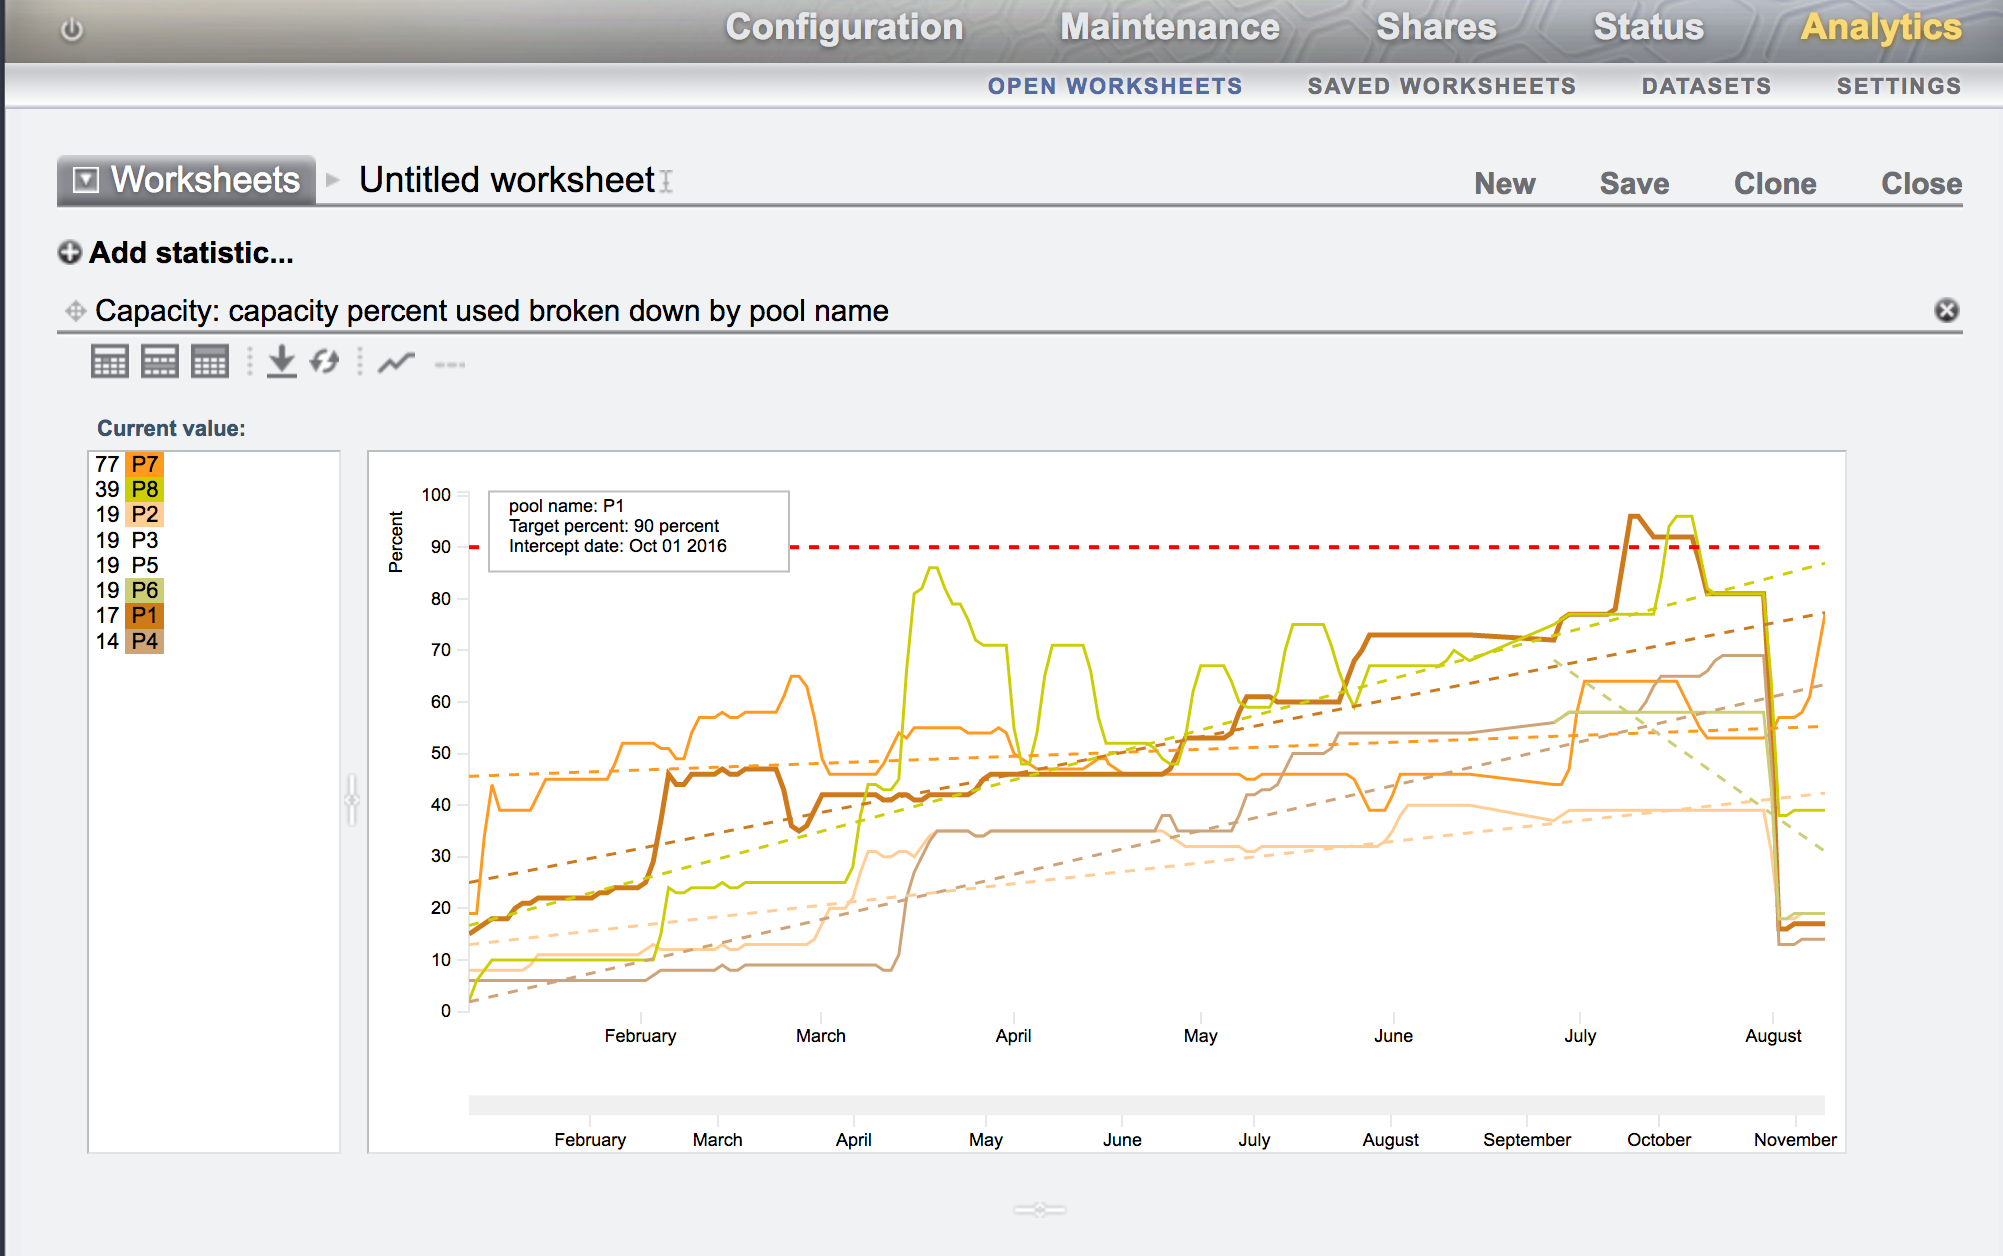
The following figure shows the percent-used capacity trend broken down by storage pools over the full time span of the datasets.

The red-dotted line is the reference line, while other dotted lines show the individual trends. The solid lines reflect the actual capacity usage. The dotted lines, except the red-dotted reference line, are color coded with the solid lines to match the color associated with the storage pool, as seen in the Current value pane. When mousing over a pool in the Current value pane, a box displays the pool name, target (or reference) percentage, and intercept date. The intercept date is when the pool reaches the target (or reference) percentage. When mousing over a pool in the graph, the capacity is displayed for the point in time.
You can control which storage pools are displayed, the time span, the value for the reference line, whether the trend lines are displayed, and when to reload the data, as described in the following table. The reference line is not displayed until a value is set for it.
Table 5-18 Modifying the Capacity Percentage Used Graph
| Graph Icon | Element | Description |
|---|---|---|
|
Storage Pool |
Select a pool in the Current value pane to highlight it and display it in the graph. Select an already highlighted pool to hide it. |
|
|
|
Reference Line |
Select the reference line icon to set a value for the reference line. To hide the reference line, select the icon again. To set a new reference line value, select to show the icon again. |
|
|
Trend Line |
To show the trend lines, click the trend line icon. To hide the trend lines, select the icon again. |
|
|
Reload Data |
To reload data from the back-end, and to redisplay data over the full interval on which the data are available, click the reload data icon. Both the reference line and the trend lines are removed. |
 |
Time Span |
Select a time span by dragging the mouse on the bar between the dates. After a time span is selected, you can drag the entire, highlighted span to new settings, or you can select an end of the time span and drag it to a new setting. |
When to Check Capacity Percent Used
This statistic can be used to view the capacity usage trend over a set period of time. The information can be used for storage capacity planning on a storage-pool basis. To set a threshold alert for capacity usage based on percentage, see Capacity: Capacity Percent Used (CLI).
Capacity Percent Used Breakdowns
Pool - Name of the pool for which the capacity trend is shown