Worksheet Graphs and Plots
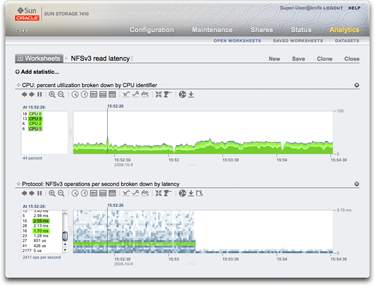
Worksheets are the main interface for Analytics. A worksheet is a view where multiple statistics may be graphed. The following screen shot shows two statistics:
-
CPU: percent utilization broken down by CPU identifier - as a graph
-
Protocol: NFSv3 operations per second broken down by latency - as a quantize plot
The following sections introduce Analytics features based on the following screen shot.
NFSv3 by Latency
