In this section Hide
Content details specify how to display values of an analysis variable; that is, the aggregation method for values. For example, you may want to show an actual value, a count of records with a value, a percentage of records with the value, and so on. You can specify multiple aggregation methods for an analysis variable; each aggregation method is represented in the report.
When you add an analysis variable to a report, the term Value appears by default as the aggregation method:
Value stands for First value, which is the default aggregation method. (It is used when no other aggregation method is selected.) When you change the aggregation method, an abbreviation of that aggregation method appears in the table cell. For example, if you select Count as the aggregation method, N appears in the table cell:
Notes:
1. On the Edit Report Columns page, highlight the aggregation method that appears in the table cell below the analysis variable. You must click the aggregation method, not the column heading. You can choose more than one aggregation method for a variable.
2. Next to Content Details, click Select.
The Content Details dialog box appears.
3. Select the desired aggregation methods and percentages. Available aggregation methods depend on the data type of a variable.
4. Click OK.
For an analysis variable with a data type of text or date, check one or more of the following check boxes. The abbreviation appears in the report column heading.
|
Check box |
Abbreviation |
Meaning |
|
Count |
N |
The number of non-NULL values. |
|
Count (Unique) |
N (U) |
The number of unique non-NULL values. |
|
Row % |
Row % |
Count of non-unique values for the row and column/Count of non-unique values for the row for all columns. (There must be a column for All.) |
|
Column % |
Column % |
Count of non-unique values for the column and row/Count of non-unique values for the column for all rows. (There must be a row for All.) |
|
Overall % |
Overall % |
Count of non-unique values for the column and row/Count of non-unique values for all columns and all rows. (There must be a column for All and a row for All.) |
|
Row % (Unique) |
Row % (U) |
Count of unique values for the row and column/Count of unique values for the row for all columns. (There must be a column for All.) |
|
Column % (Unique) |
Col % (U) |
Count of unique values for the column and row/Count of unique values for the column for all rows. (There must be a row for All.) |
|
Overall % (Unique) |
% (U) |
Count of unique values for the column and row/Count of unique values for all columns and all rows. (There must be a column for All and a row for All.) |
|
All values |
ALL |
All values, including null values, separated by commas. Null values are shown as blanks, so you may see a list of values like "DrugA, , DrugC". |
|
All values (excluding NULLs) |
All |
All values except null values, separated by commas. |
|
Unique values |
ALL (U) |
Unique values (in ascending order), including NULL values, separated by commas. Null values are represented in the list by the string "null". |
|
Unique values (excluding NULL) |
All (U) |
Unique values (in ascending order), excluding NULL values, separated by commas. |
|
Unique values and counts |
ALL (N) |
Unique values (in ascending order), including NULL values, separated by commas; after each value is the count of the value. Null values are represented in the list by the string "null". |
|
Unique values and counts (Excluding NULL) |
All (N) |
Unique values (in ascending order), excluding NULL values, separated by commas; after each value is the count of the value. |
|
First value |
Value |
First non-NULL value from the database (for the case series or query being used). If you do not specify an aggregation method, this method is used by default. |
For an analysis variable with a data type of number, check one or more of the following check boxes. The abbreviation appears in the report column heading.
Note: If a case is counted in multiple columns or rows, a count in the All column or row is not necessarily the same as the total of counts in other columns or rows of the report. Also, percentages in the columns or rows can add up to greater than 100 percent.
|
Check box |
Abbreviation |
Meaning |
|
Count |
N |
The number of non-NULL values. |
|
Count (Unique) |
N (U) |
The number of unique non-NULL values. |
|
Row % |
Row % |
Count of non-unique values for the row and column/Count of non-unique values for the row for all columns. (There must be a column for All.) |
|
Column % |
Col % |
Count of non-unique values for the column and row/Count of non-unique values for the column for all rows. (There must be a row for All.) |
|
Overall % |
% |
Count of non-unique values for the column and row/Count of non-unique values for all columns and all rows. (There must be a column for All and a row for All.) |
|
Row % (Unique) |
Row % (U) |
Count of unique values for the row and column/Count of unique values for the row for all columns. (There must be a column for All.) |
|
Column % (Unique) |
Col % (U) |
Count of unique values for the column and row/Count of unique values for the column for all rows. (There must be a row for All.) |
|
Overall % (Unique) |
% (U) |
Count of unique values for the column and row/Count of unique values for all columns and all rows. (There must be a column for All and a row for All.) |
|
Sum |
Sum |
The sum of the values. |
|
Mean |
Mean |
The mean of the values. |
|
Median |
Median |
The median of the values. |
|
Standard Deviation |
SD |
The standard deviation of the values. |
|
1st Quartile |
Q1 |
The first quartile of the values. |
|
3rd Quartile |
Q3 |
The third quartile of the values. |
|
Min |
Min |
The minimum value. |
|
Max |
Max |
The maximum value. |
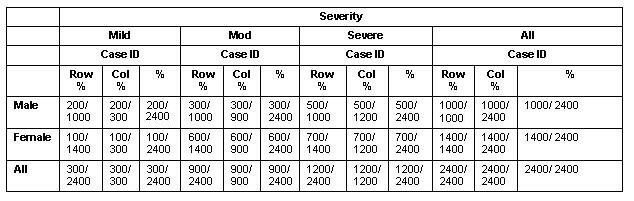
For example, suppose that a report includes counts like this:
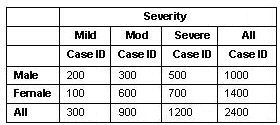
If you replace the counts in the report with row, column, and overall percentages, the report display changes to this: