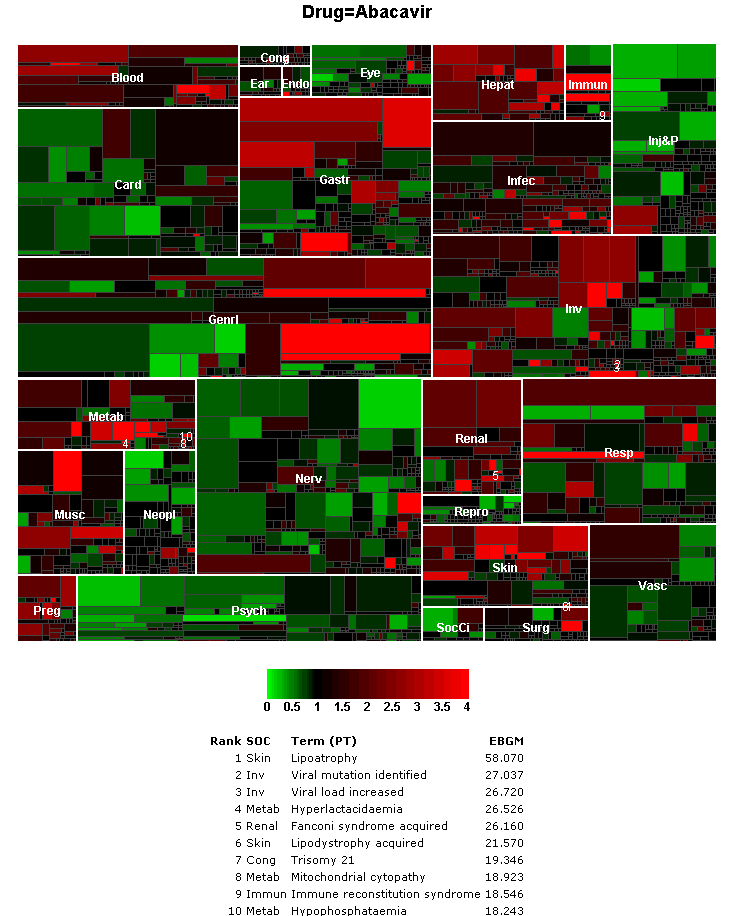
A sector map for data mining results is a visual presentation of data for a particular drug across all System Organ Classes (SOCs). A large tile represents each System Organ Class (SOC) in the sector map. Smaller tiles within each SOC tile represent Preferred Terms (PTs). A sector map graph is available for two-dimensional results of MGPS data mining runs.
The application ranks PTs in descending order of values of the statistic (EBGM, EB05, Chi-statistic, or PRR) that you choose. A color key indicates relative ranking. You can also list the ranked PTs below the sector map.
Note: The primary path of a PT determines where it appears in the sector map. If a PT is not in the event hierarchy associated with the configuration, it appears in a SOC tile named Unknown.
The list of ranked PTs below the sector map includes the following information:
|
Field |
Description |
|
Rank |
Ranking of the term (combined with the drug) according to values of the statistic you have configured the sector map to use (via the Color controlled by option). |
|
SOC |
SOC containing the term. |
|
Term (PT) |
Specific PT. |
|
EBGM. EB05, Chi-statistic, or PRR |
Value of the statistic you have configured the sector map to use (via the Color controlled by option). |
If Notes is checked when you display the graph, a Notes section provides information about the selection criteria and display options used for the graph.
The following example is for a two-dimensional data mining run, with the drug Abacavir selected on the Select Criteria page: